Intel GPA for Android - optimizing graphics in mobile applications
 In continuation of a series of articles devoted to Intel INDE, I want to talk about a unique (I’m not afraid of this word) developer tool created by Intel - Intel GPA ( Graphics Performance Analyzers ). I already mentioned it in a review article on Intel INDE .
 The Intel GPA includes tools to analyze performance, find bottlenecks, and optimize application performance. At the same time, the tools have an intuitive, user-friendly graphical interface, which gives developers the opportunity to start “right off the bat”, without even having much experience in optimizing and debugging graphical applications.
Intel GPASupports application performance analysis for Windows and Android. The Windows version (DirectX) has been on the market for a long time, many articles have been written about it; the version for Android intended for applications using OpenGL appeared relatively recently, and many developers are not even aware of its existence. I’m going to fill this gap.
System requirements
Intel GPA is available for the following host OS
- Windows 7, 8, 8.1
- OS X
- Ubuntu
Mobile device
You will also need an Android device based on Intel Atom, this is due to the fact that the analysis of the application is performed directly on the device, without having to root or somehow prepare the device, the only requirement is that the device must be detected by ADB ( Android Debug Bridge ).
application
The profiled application must have the debuggable = ”true” flag in the manifest
And permission android.permission.INTERNET
Install Intel GPA
There are two ways to install Intel GPA:
As part of Intel INDE
We go to the Intel INDE website , download and install the package manager (more on this in the review article about Intel INDE ).
Select the GPA System Analyzer , click Download , wait for the download to finish and install.
From the Intel GPA Home Page
Open the Intel GPA homepage , select the package for your OS, download, install.
What's inside
Together with the GPA System Analyzer , the GPA Performance Analyzers and GPA Frame Analyzer will be installed . All tools in the package deserve special attention, however, in order not to overload the article with information about all three, this time I will talk about the GPA System Analyzer .
Beginning of work
First you need to connect the device to the host and make sure that it appears in the ADB list.
At the command line
adb devices

GPA System Analyzer
This tool allows you to analyze application performance, find potential bottlenecks, take metrics for more detailed analysis. Displays various performance characteristics of the mobile platform such as:
- CPU Status
- Memory
- power usage
- Network, disk activity
- GPU Metrics
- OpenGL ES API Metrics
- power usage
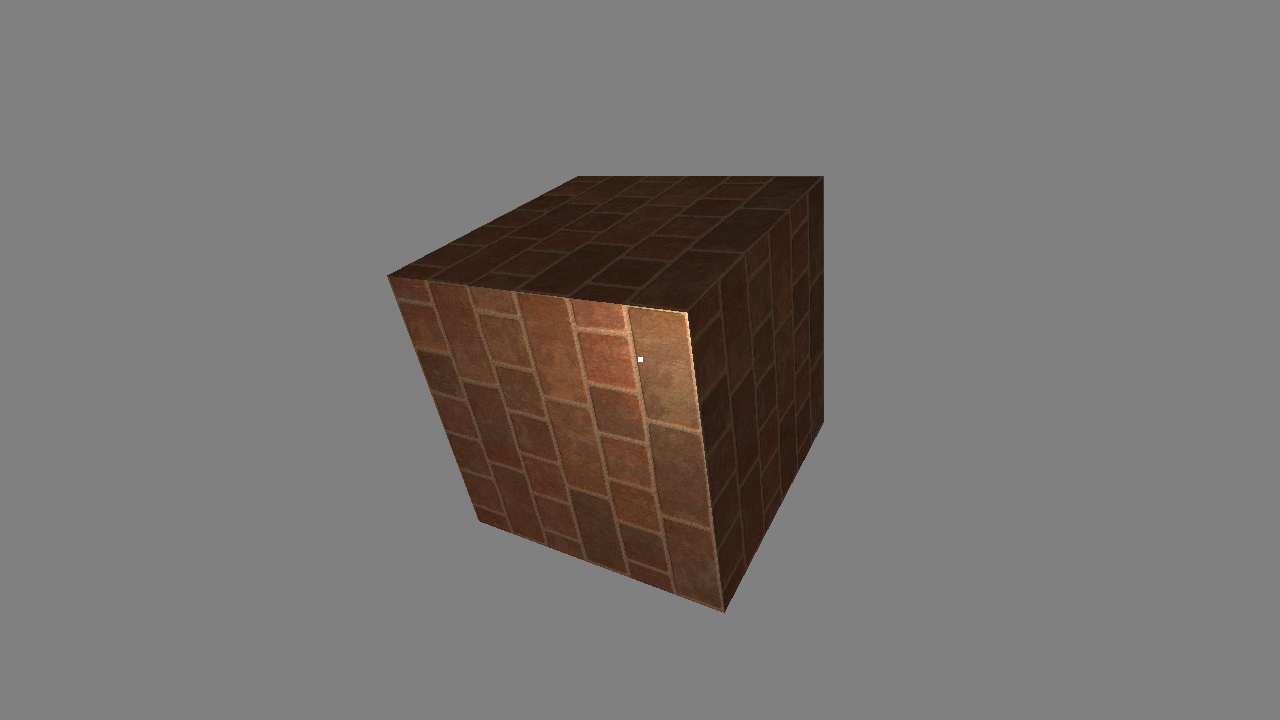
GPA System Analyzer allows you to "play" with various rendering parameters, without making changes to the code. At the same time, the result can be immediately seen on the screen of the mobile device and observed on the graphs ( CPU , GPU , FPS load ), as this affects the performance. In addition, the tool allows you to collect performance data, the current frame, which can be analyzed in more detail using the GPA Performance Analyzers and GPA Frame Analyzer .
So, launch the GPA System Analyzer . After starting, a list of available devices should be displayed:
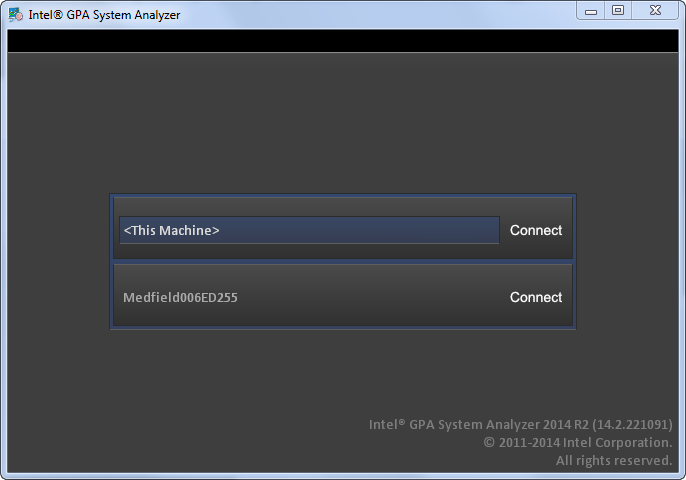
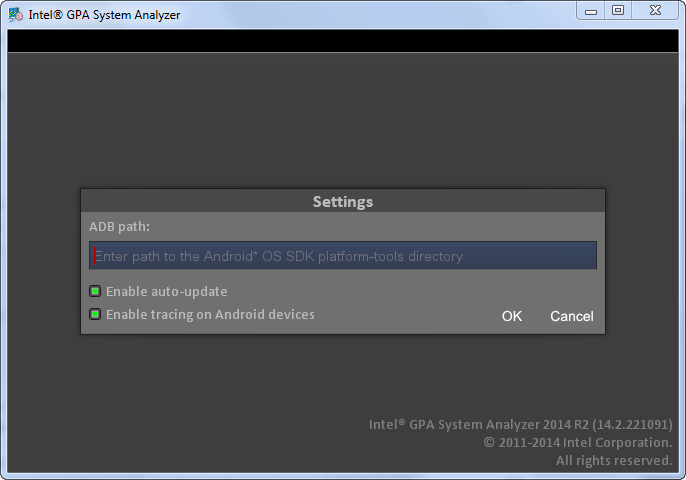
If the device is detected by ADB, but not in the list - try manually specifying the path to ADB . To do this, press Ctrl + F1 and enter the path to the folder with ADB .
After connecting to the device, you will see a list of applications installed on the device:
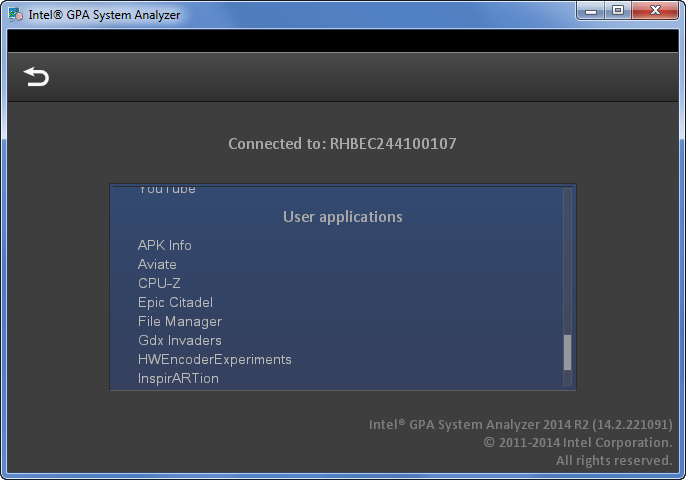
To start and start analyzing the application, simply click on its name in the list.
After launching the application on your mobile device, you will see the following screen.
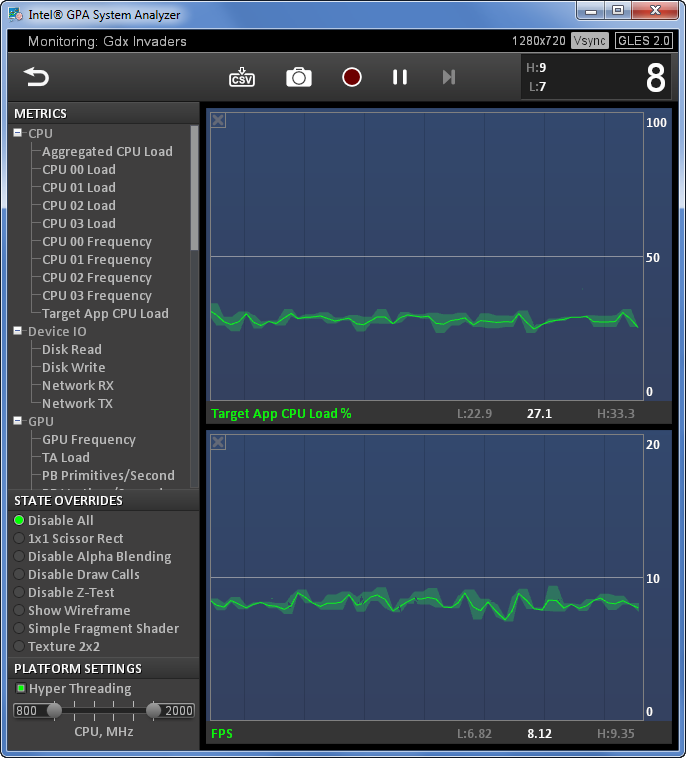
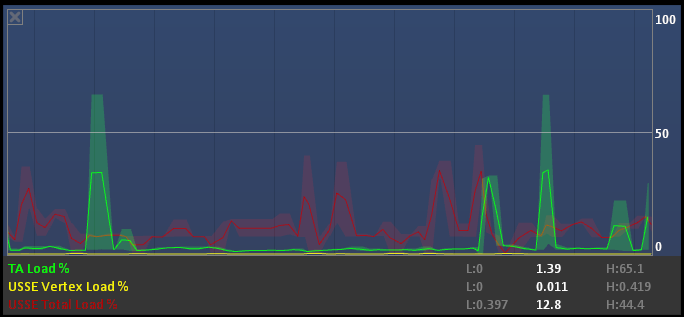
The left column displays various Metrics and State Overrides rendering options . On the right side are graphs that display performance metrics (in this case, the CPU load of the analyzed application and FPS ).
To add a graph of the selected performance indicator, simply drag the line with its name into the graph area.
You can also combine two or more charts on one (useful when monitoring related metrics) if you hold down the Ctrl key while moving the metric to the chart area:
Metrics
CPU
- The Load CPU Aggregated - total loading CPU
- CPU 0x Load - loading of each core
- CPU 0x Frequency - current frequency of each core
- Target App CPU Load - CPU loading by a profiled application
Device IO
The metrics listed below take into account read / write operations by all applications on the device, without reference to the profile application.
- Disk Read - speed of data reading operations from the drive (internal memory or SD card).
- Disk Write - write speed to the drive.
- Network RX - speed of receiving data from the network (including all network interfaces except loopback )
- Network TX - data rate
GPU
- Frequency GPU - operating frequency GPU in the monitoring process
- TA Load - percentage Tile Accelerator load
- PB Primitives / Second - the number of graphic primitives loaded into the Parameter Buffer
- PB Vertices / Second - the number of vertices loaded in the Parameter Buffer
- PB Vertices / Primitive - the number of vertices per primitive, a summary parameter indicating the effectiveness of the process of constructing primitives
- ISP Load - percentage of time spent on Image Synthesis Processor cutting off invisible surfaces, in percent
- TSP Load - time spent by Texture Shading Processor on texturing visible fragments, in percent
- USSE Vertex Load - the time that the Universal Scalable Shader Engine is busy calculating vertices, in percent
- USSE Pixel Load - the time that USSE spends processing pixels
- USSE Total Load - the time that USSE spends on executing instructions
- USSE Vertices / Second - the number of vertices processed by USSE , per second
Memory
- App Resident Memory - amount of memory ( RAM ) occupied by the analyzed application
- Available Memory - the amount of memory of the mobile device available to the application
Opengl
- Buffer Creations - the number of buffers created by the application, per frame
- Draw Calls - the number of calls the drawing function, per frame
- Indexed Draw Calls - same as Draw Calls , but for indexed primitives
- Vertex Count - the number of vertices involved in rendering the scene, per frame
- Indexed Vertex Count - same as Vertex Count , but for indexed vertices
- FPS - frames per second
- Frame Time - time to draw one frame
- Frame Number - current frame number
- RT Clears - how many times glClear was called for Render Target per frame
- Error Gets - the number of glGetError calls per frame
- Total State Changes - total change of Open GL states in one frame
- Bind Texture Calls - the number of glBindTexture calls per frame
- Bind Buffer Calls - the number of glBindBuffer calls per frame
- Use Program Calls - the number of glUseProgram calls per frame
Power
- Battery Voltage - current battery voltage
- Current Charging - shows how many milliamps is consumed by the device via USB to charge the battery
- Current Discharging - how many milliamps are consumed by the mobile device from the battery
- Power Charging - the number of watts consumed by the battery
- Power Discharging - the number of watts consumed by the device
Finding issues and ways to improve performance with metrics
As you can see, the GPA System Analyzer helps you monitor virtually any metric that reflects application performance. But not all metrics can directly indicate problems (as in the case of CPU loading - the higher the worse), some of them will tell you something useful, only when comparing with others.
GPU Performance Metrics
TA Load and USSE Vertex Load
Ideally, both indicators should be balanced, which allows for better performance.
TA Load high, USSE Vertex Load low - the scene contains too many vertices, you can improve performance by simplifying objects.
TA Load low, USSE Vertex Load high - vertex shader too complex, there is a place for optimizing the shader code.
PB Primitives / Second
Too high an indicator indicates that most likely the problem is the size of the vertex format.
PB Vertices / Second
A high indicator may indicate a large amount of data transferred between the vertex and fragment shaders.
PB Vertices / Primitive
A high indicator indicates the possibility of optimization by reducing the number of vertices in the models, for example, through their reuse using the index buffer.
ISP Load
A high indicator can be in cases where one Z-buffer is used with several Render Target . To improve the situation, you can create your own buffer for each RT .
TSP Load, Texture Unit Load, USSE Pixel Load
High TSP Load indicates the possibility of improving performance by optimizing shaders (high load USSE Pixel Load ) or textures (high load Texture Unit ) by reducing resolution, using compression.
USSE Total Load, USSE Vertex Load, USSE Pixel Load
A high USSE Total Load indicates the possibility of increasing productivity by optimizing the operation of vertex (high USSE Vertex Load ) or fragment ( USSE Pixel Load ) shaders.
OpenGL Metrics
Draw Calls & Indexed Draw Calls
From a performance point of view, calling drawing functions is a costly operation. High metrics can indicate performance improvements by grouping vertices and drawing in a single call.
Buffer creations
Allocating a buffer is a costly operation, ideally should happen somewhere at the stage of initialization of the scene. The appearance of this indicator on the chart indicates that you have the opportunity to increase the efficiency of the code by transferring the code that creates buffers to initialization, loading the scene.
Error Gets
GlGetError calls degrade performance. In the final version of your application, this figure should be zero.
State overrides
Another interesting tool is the ability to override the state of the analyzed application without making changes to the code. In fact, these are various experiments that you can put on your application to understand how the inclusion of certain parameters affects the performance of the application.
Disable All
Disables all active options. Displays the active scene as is.

1x1 Scissor Rect
Disables the processing of pixels in the graphics pipeline. If the FPS option does not change when the option is turned on , then most likely the problem is too complex scene geometry or vertex shader.

(in this case, an empty scene will be displayed)
Disable Alpha Blending
Disables Alpha Blending . Operations related to transparency can seriously affect performance. This experiment will show you how disabling blending affects FPS .
Disable Draw Calls
Ignores drawing functions. This experiment will help to understand how the application will behave on a device with an infinitely fast graphics chip.
Disable Z-Test
Z buffer is used to trim objects located in full or in part behind other objects in the scene. Enabling this option should greatly “slow down” the drawing of the scene. If this does not happen, then you have the opportunity to improve performance by sorting objects from close to distant before rendering them.
Show wireframe
Includes wireframe display mode , allows you to visually assess the order of objects, the complexity of the models.

Simple fragment shader
Replaces the fragment shader with a simple, single color. If performance is improved by enabling this option, try optimizing the fragment shader code.

Texture 2x2
Replaces used textures with simpler ones. If when you enable this option you see a performance improvement - there is a way to optimize the application by optimizing the textures (decreasing resolution, using compression).

This part on the GPA System Analyzer ends. I hope the information received will help you quickly master this tool and put it into practice.
Next time I’ll talk about a tool called GPA Frame Debugger , which allows you to conduct a detailed analysis of OpenGL scenes in a simple and clear way.