How we did network monitoring for 14,000 objects
We had 14,000 objects, zabbix, api, python and unwillingness to add objects by hand. Under the cut - how networkers implemented monitoring with automatic addition of network nodes, and a little about the pain that I had to go through.
The article is more focused on network engineers with little experience in python. To help automate monitoring and improve the quality of life and work, in the absence of the need to manually update the entire fleet of objects.

Hello! My name is Alexander Prokhorov, and together with the team of network engineers of our department we are working on the network at # ITX5. Our department develops network infrastructure, monitoring and network automation. And everything connected with the transfer of data.
I would break the monitoring system into 5 subtasks:
In this article, we would like to share how the monitoring integration with the master data in our company was done.
We have 14,000 retail properties, and the first task we solved is the definition of inaccessible objects, their number and geographical distribution.
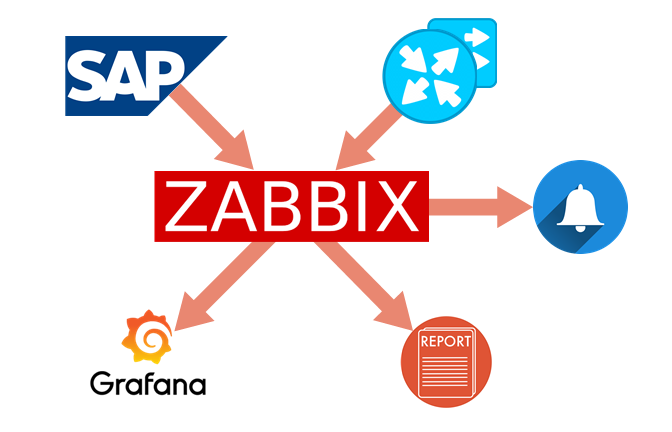
Monitoring was done on Zabbix . In a nutshell, why - lucky and legacy. Rest:
Zabbix version - 3.0 LTS . We are updating only within the limits of LTS versions.
Configuration - 4 virtual machines: Server + Database, Proxy, Proxy, Web
For resources, we tried to follow the recommendations on zabbix.com for a large and very large deployment.
The first problem we faced was the automatic addition of network nodes to the monitoring. Regular discovery disappeared immediately. Our range of networks is in all spaces of the 10/8 supernet. A lot of addresses would have to be polled and automatic detection would take up a lot of system resources, but would not solve the problem of adding non-technical information about the object.

The solution was to use external scripts to add objects. Master data on trade objects found in used in the company SAP'e. Synchronous access to the web-service to upload data directly from SAP did not come out, the request for all objects was carried out for a long time. Made an asynchronous call. Exactly at midnight, the full unloading from SAP is added to ftp as XML , and during the day XML 'ki with diffs from the latest versions are included. Zabbix API was
used to load data into Zabbix , and interacted with it from Python .
At the first stage, the data set was determined, which we need to create an object. We use all received signs for correct classification of an object in the system or for further convenience. These features include:

The main purpose of this module is XML parsing and translation into JSON for Zabbix API. It is very convenient in this case to use Python dictionaries, since you do not need to format them further, - using the zabbix.api module, you can simply feed a dictionary with the correct structure to it. JSON with structure looks like this:
We in the field with the IP address in SAP store the address of the server, not the router, but using the ipaddress module, we consider the first subnet address, which in our case is always the router.
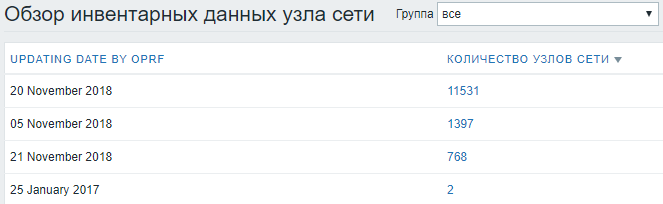
The date of the last successful update is recorded in Inventory , in controversial situations it helps to understand how relevant the information is in the system.
Then in the inventory it is very convenient to look at the statistics on the update date:
The most important field - STATUS , “open” - is added and starts to be monitored, any other status - deactivates the network node. Objects are not deleted in order to preserve historical data and statistics.
After the tests, I had to add the ping function in order to check if the host is available before the initial addition. in practice, “Open” statuses began to come across that are not quite open yet, but almost now.
Earlier in Zabbix API there was a host.exist function , but in new versions it was combined with host.get . If the node exists, the request returns hostid in the zabbix database. If not found, it returns 0. To verify now I had to add existhost , but in fact it is host.get .
Finally, we collect information about the work done, add logs, reports and move the processed file to the repository in the OLD.
In general, the base for monitoring is ready, let the script run in cron for autorun and forget.

We are no longer we, we are networkers.
The second stage - filling objects with the data that engineers need for work. You need to see all the data to solve the incident in one system, so as not to run on different systems, collecting information piece by piece from different sources. And since the main technical data is in monitoring, we also involve the rest in monitoring.
In order to collect and transmit the necessary information , inventory.py was written in Zabbix , which to a large extent deals with the collection of data on SNMP from equipment, and to a lesser parsing of the Excel file.
This begs the question - why not use the built-in item 's and enter their result in inventory by means of Zabbix itself? Three answers:
The data on the providers, without which engineers of the 1st and 2nd lines cannot do, is stored in the excel-file on a common network drive and updated by the managers leading communication contracts. Integration with the file caused great doubts - the manual parsing of excel, which can change the structure, name, location, etc., will most likely be constantly throwing out errors. But due to the lack of other relevant source of such data had to use it. In order to somehow protect themselves from the constant changes of the script, we agreed with the managers about the structure and correct filling, explained how the automatic unloading will be performed and that it is important to observe the current structure. In practice, of course, errors occurred, but we rather quickly tracked them, swore, but corrected.
The file BGP-AS-BASE.cfg represents the correspondence between the AS number and the name of the provider. It is necessary to determine the provider with which BGP is established (all of a sudden there is an error in the contract file). The external base was not used, since There are many private AS numbers .
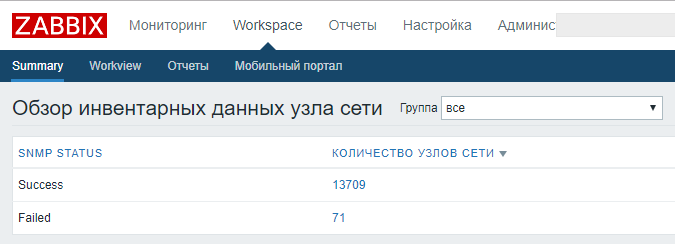
In the SNMP part :
The whole block associated with SNMP is enclosed in try-except , so that if there is no SNMP equipment on the script, the script does not fall out, and we at least get data from Excel from the providers. To understand which part of the script is executed and which is not - the success of the SNMP block is recorded in the date_hw_expiry field , plus the date is recorded, when it was last able to remove all data on SNMP, and the date when it was last able to find data in the Excel file.
All this is returned in the form of JSON ready for Zabbix .
Updating all inventory data is run once a day, unloading all hosts and running inventory.py for each object.
Multiprocessing is used (example taken from the vast expanses of the Internet). To search, use the SAP ID , which we have in the host name. The resulting output is recorded update in the Zabbix.
For the implementation of all the integration, auto-update and update the built-in mechanisms of the Zabbix API is more than enough. The main functions used are host.get , host.create and host.update , which together allow you to fully manage the creation and updating of the database of monitoring objects. Data to the input of these functions can be supplied from any systems and sources that are available.
The main modules of python that helped us cope with this task: pysnmp , xlrd , zabbix.api , xml , ipaddress , json .
xlrd - excel parsing.
xml - parsing XML.
pysnmp - pulling data via SNMP from equipment.
Interaction via SNMP is easier than via SSH, at least because in practice, the hardware responds more quickly to SNMP than it does to an SSH connection, parsing SNMP responses is almost unnecessary, although the CLI of different vendors often differs greatly from one another the teams may differ even in different models of the same vendor.
The main OIDs used are:
iso.3.6.1.2.1.4.20.1.1 - addresses of all interfaces of the router
iso.3.6.1.2.1.4.20.1.3 - subnet masks of all interfaces of the router
iso.3.6.1.2.1.15.3.1.7 - all BGP peers of the router
iso.3.6.1.2.1.15.3.1.9 - AS of all BGP peers of the iso.3.6.1.2.1.47.1.1.1.1.1.13.1 router
- model
iso.3.6.1.2.1.47.1.1.1.1.10.1 - short version of software
iso.3.6.1.2.1.47.1.1.1.1.12.1 - vendor
iso.3.6.1.2.1.1.1.0 - detailed version of software
iso.3.6 .1.2.1.47.1.1.1.1.7.1 - model, chassis type
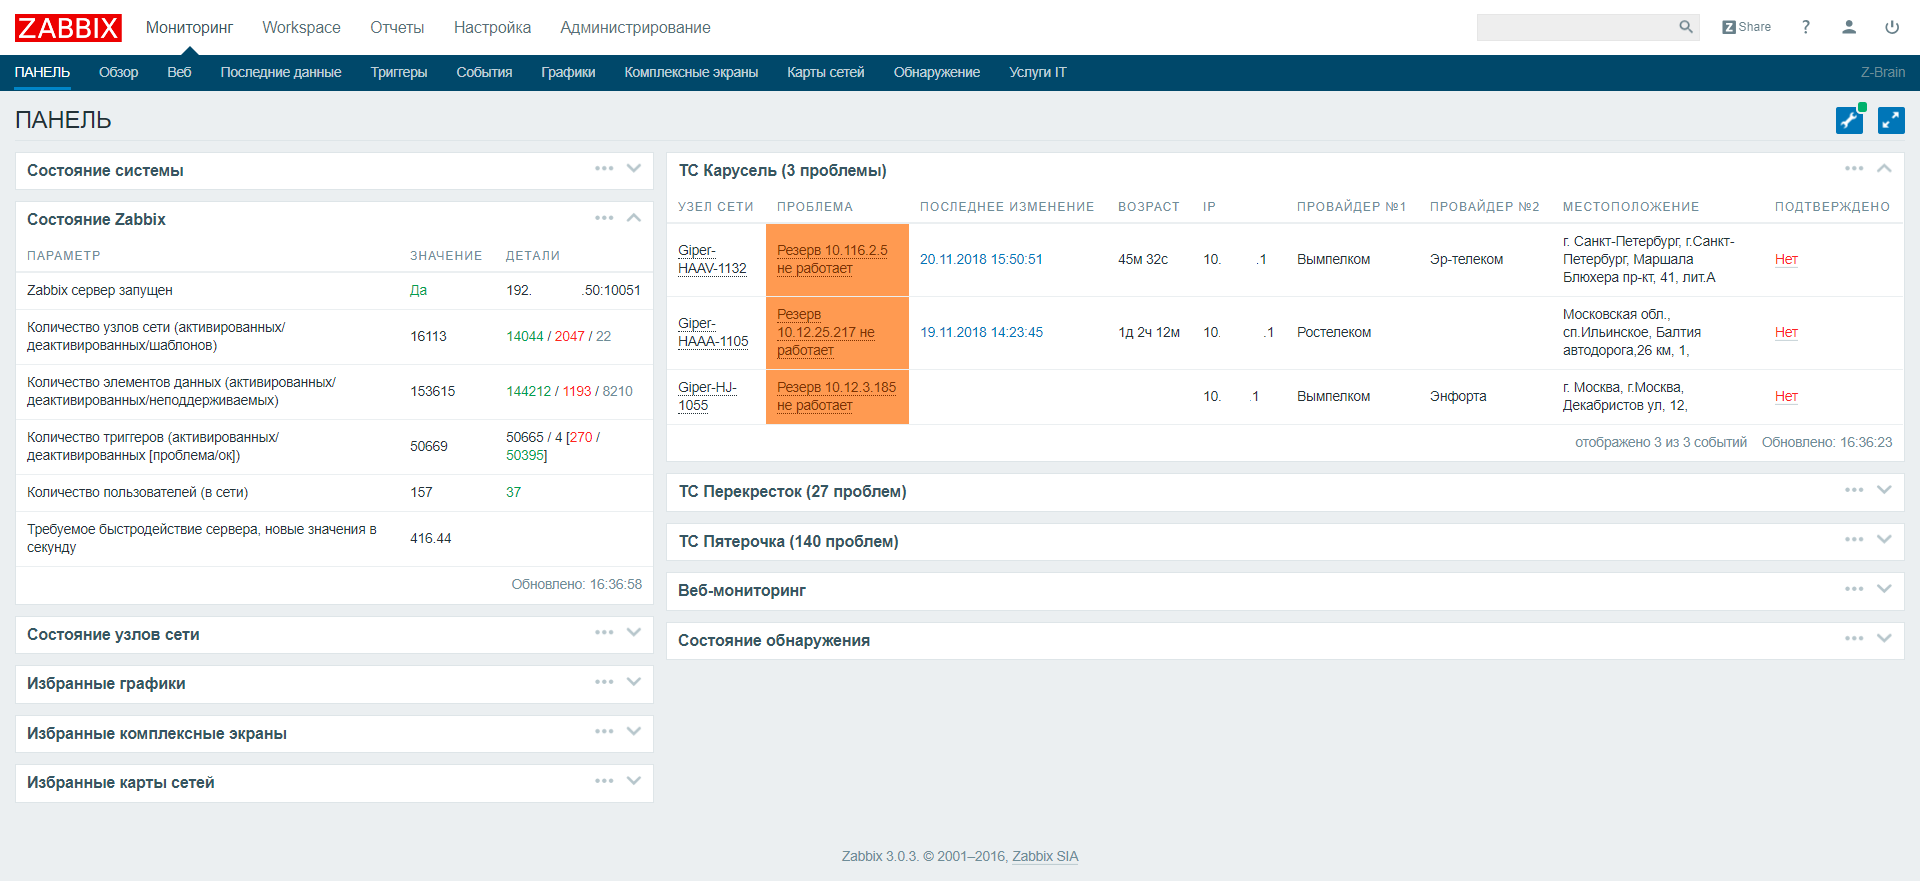
Dashboard had to be added a little to separate problems on trading networks and not to disturb them in a heap. Also add several fields, for example ip, the name of the provider and the address, so that in the event of a mass accident it was enough to copy-paste from the browser into the letter all the objects with the problem, immediately with all the necessary data for the provider.
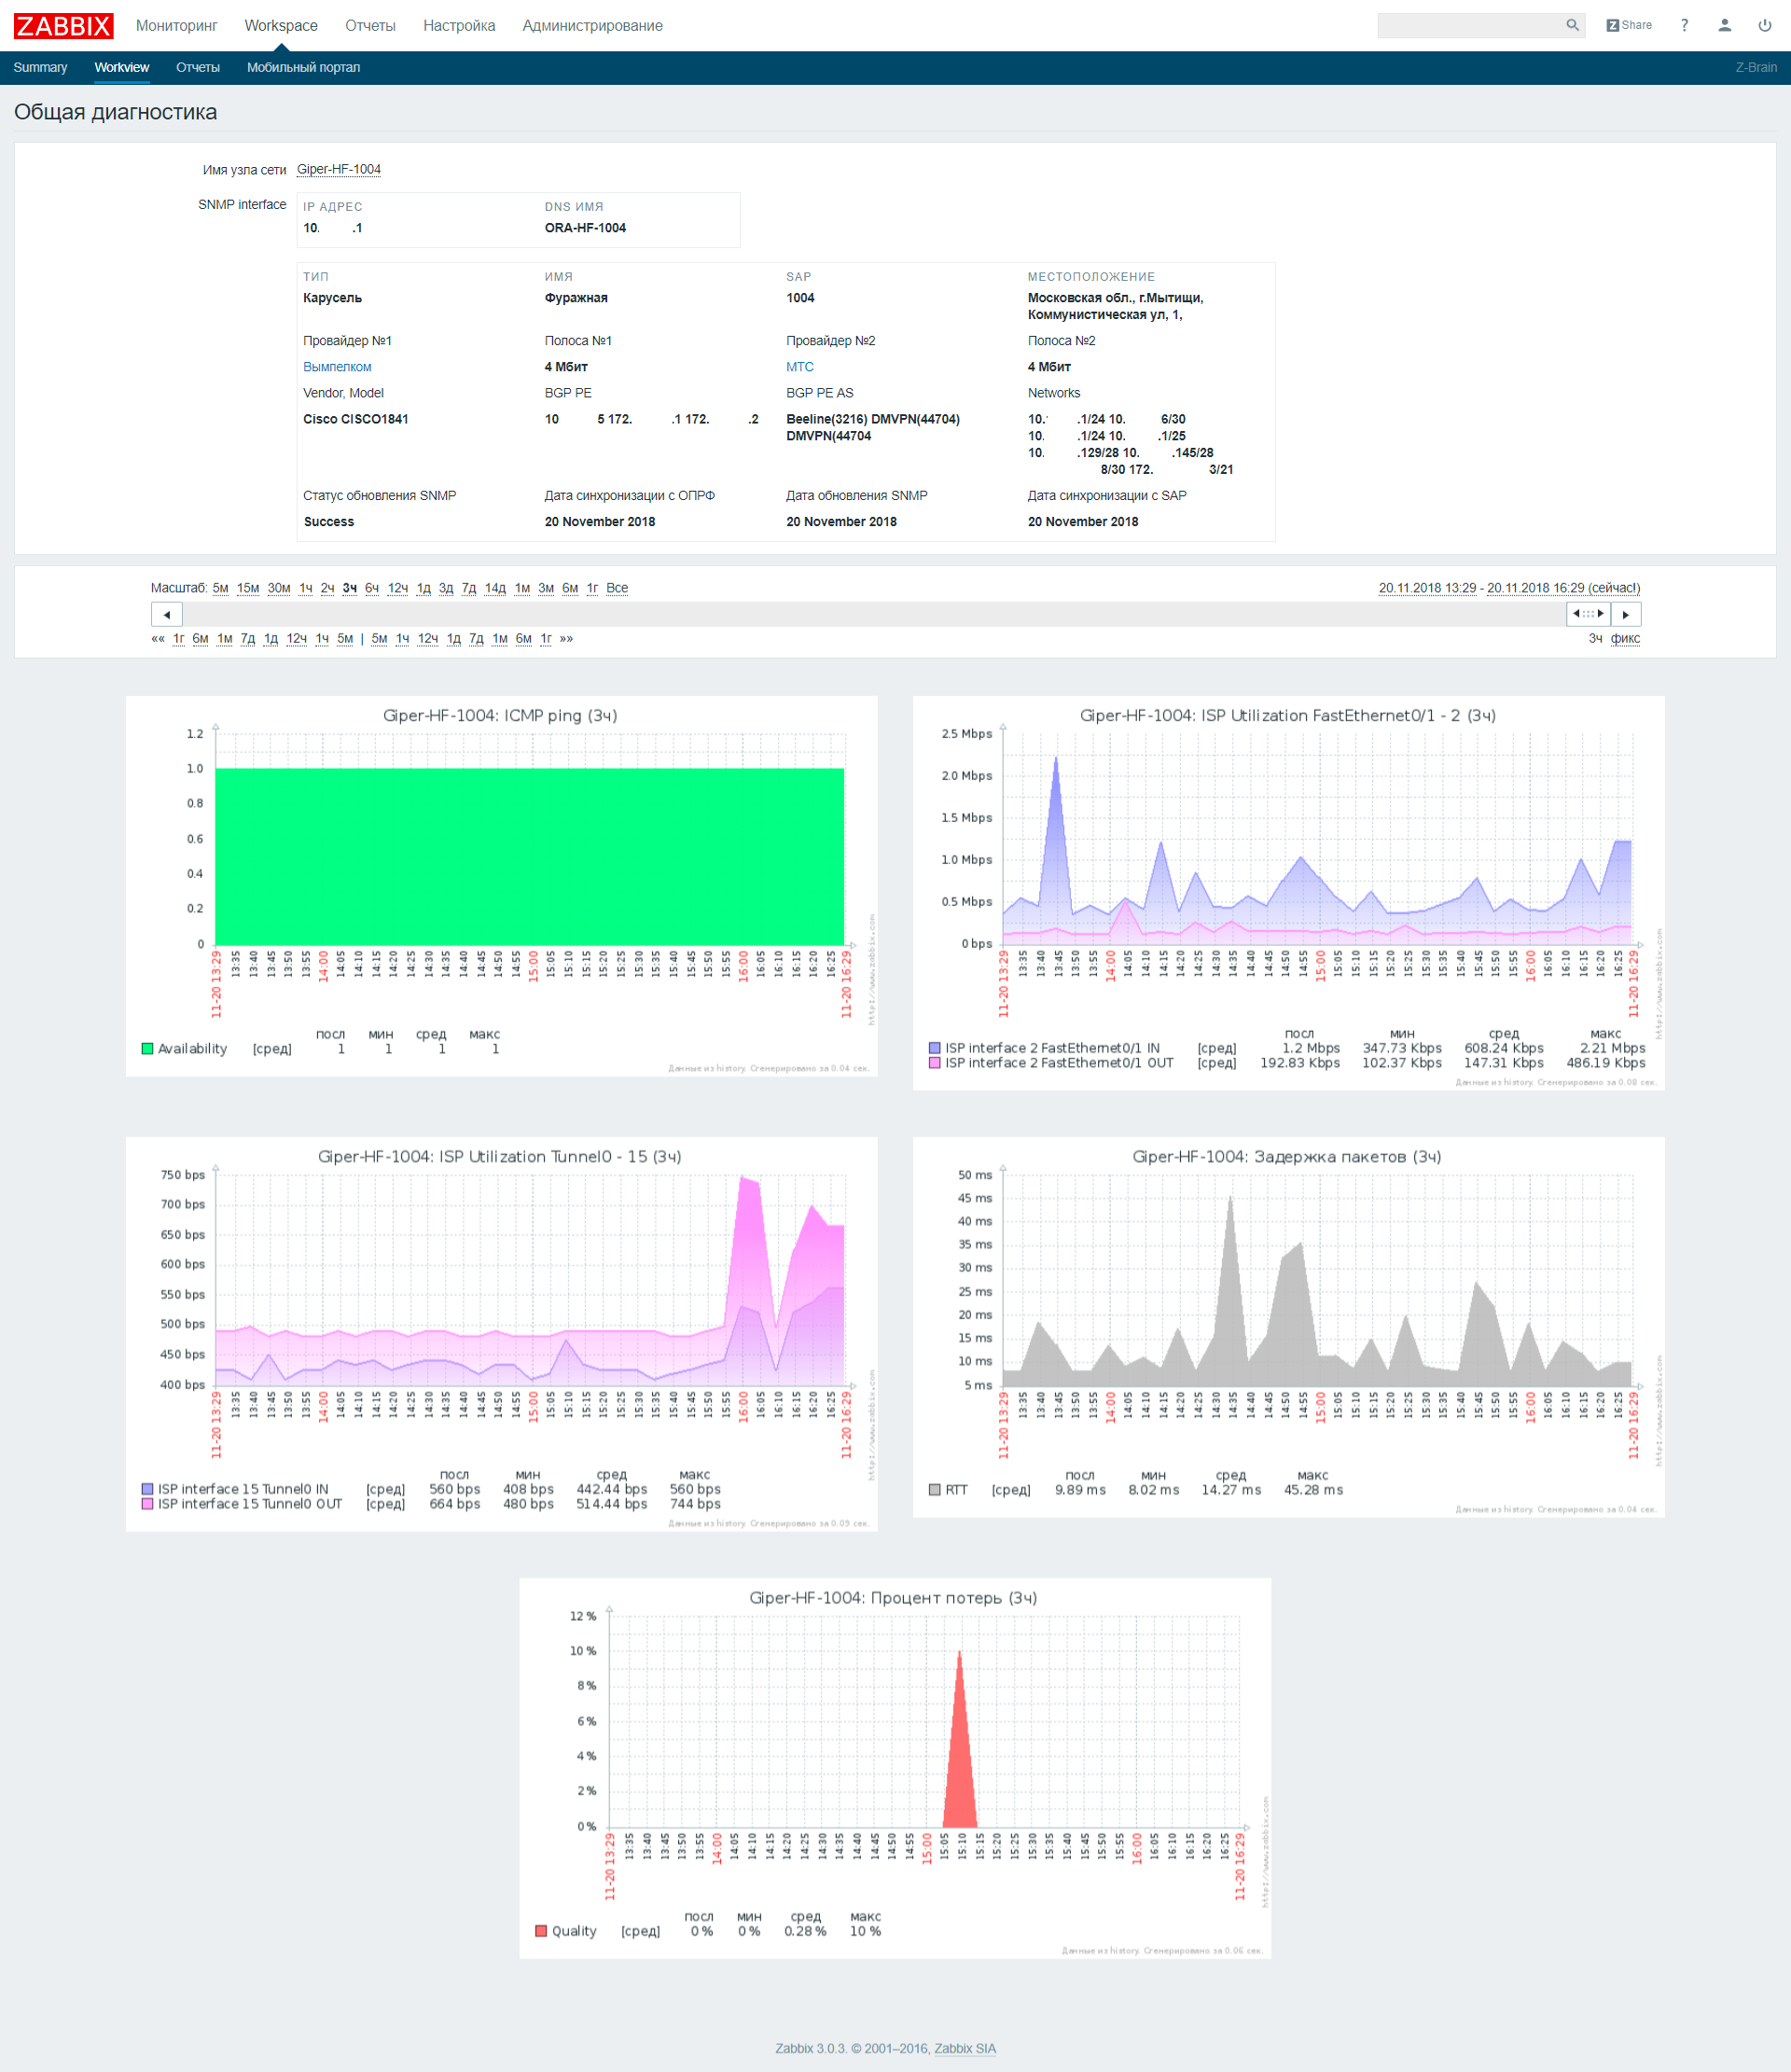
Separately, a “Workview” was written in which we can find all the collected information, plus graphs that are collected for this object.
The article is more focused on network engineers with little experience in python. To help automate monitoring and improve the quality of life and work, in the absence of the need to manually update the entire fleet of objects.
Long story short, we have built a monitoring
Hello! My name is Alexander Prokhorov, and together with the team of network engineers of our department we are working on the network at # ITX5. Our department develops network infrastructure, monitoring and network automation. And everything connected with the transfer of data.
I would break the monitoring system into 5 subtasks:
- Master Data Download
- Getting information about the state of objects
- Triggers and alerts
- Drawing up reports
- Visualization
In this article, we would like to share how the monitoring integration with the master data in our company was done.
We have 14,000 retail properties, and the first task we solved is the definition of inaccessible objects, their number and geographical distribution.
Monitoring was done on Zabbix . In a nutshell, why - lucky and legacy. Rest:
Long story.
Все началось с установки мониторинга на компьютер под столом…
Когда я пришел работать в компанию в 2013 году, у нас не было мониторинга сети, хотя сеть даже на тот момент была большой, порядка 4000 объектов. О массовых (и не очень) падениях мы узнавали чаще всего от лавинообразного поступления заявок, пользователей или от других отделов.

Первым был установлен Zabbix 1.8, как набирающий обороты (модный, современный, молодежный) продукт, легкий и доступный к установке open source с большим сообществом. Нам просто повезло с выбором.
Ресурсов для установки не было, никто и не запрашивал. Было непонятно, будет ли это вообще работать, опыта внедрения ни у кого не было. Но нам было нужно, и мы установили его на компьютер «под стол». Уровень резервирования — ИБП.
Основной вопрос после установки — как влить все объекты (4к!) в мониторинг, и при этом успевать делать заявки, которые уже висят в Remedy. Zabbix уже поддерживал импорт/экспорт xml с данными по узлам сети. Количество объектов большое, создавать отдельную группу под объект смысла не было(да и не появилось), и было решено вгружать в качестве узла сети роутер объекта. Больше из сетевого оборудования ничего не управлялось (уже управляется).
Был сделан парсинг нашего файла с хостами сети (IPAM в excel), он и переформатирован в xml, который «Заббикс» согласен переварить. Не с первого раза, но все хосты были вгружены, актуализацию проводили раз в три месяца, удаляя закрывшиеся объекты и добавляя новые. Со временем получилось так, что Zabbix стал главным и единственным источником информации для нас и горячей линии по доступности объектов и, главное, по массовым падениям. Это позволило горячей линии узнавать о массовых авариях даже ночью, и будить инженеров звонками (к слову, когда никто об этом не знал, жить было проще). Не всегда ночные отключения питания в офисе позволяли ИБП достойно поддерживать мониторинг нашей сети. В какой-то момент мы стали уже делать бекапы. Т.к. мониторинг работал нестабильно и с перебоями, в компании приняли решение организовать группу, занимающуюся только этой задачей. Очень скоро она занялась внедрением централизованного Zabbix, который проверяет не только сеть.
Наш старенький Zabbix продолжал жить под столом. После добавления определенного количества item’ов стала немного тормозить база, web, очередь и задержка опроса вырастала, так что вскоре пришлось обзавестись еще двумя компьютерами в качестве proxy и поставить их все в кроссовую, чтобы уж настоящее резервирование (да и место под столом закончилось). Жизнь в нем поддерживалась, чтобы быстро добавлять какой-то кастомный параметр в мониторинг и наблюдать за ним. В остальном мы переехали на централизованный.
Централизованный мониторинг занимался всем IT-оборудованием – роутерами, серверами, кассами, терминалами. Спустя время он оброс огромным количеством item'ов. Для доступа к бесценной информации о доступности необходимо было слегка подождать, возможно, даже выпить кофе. К тому же у нас появлялось все больше требований к более специфичному и кастомному мониторингу сети. Имея на тот момент некоторый опыт по работе с системой, мы решили сделать старое внедрение с нуля, но уже правильно, — под названием zabbix.noc.x5.ru Он разместился в ЦОДе с реализацией необходимых нам функций by ourselves. Об этом то внедрении и основное тело статьи.
Когда я пришел работать в компанию в 2013 году, у нас не было мониторинга сети, хотя сеть даже на тот момент была большой, порядка 4000 объектов. О массовых (и не очень) падениях мы узнавали чаще всего от лавинообразного поступления заявок, пользователей или от других отделов.
Первым был установлен Zabbix 1.8, как набирающий обороты (модный, современный, молодежный) продукт, легкий и доступный к установке open source с большим сообществом. Нам просто повезло с выбором.
Ресурсов для установки не было, никто и не запрашивал. Было непонятно, будет ли это вообще работать, опыта внедрения ни у кого не было. Но нам было нужно, и мы установили его на компьютер «под стол». Уровень резервирования — ИБП.
Основной вопрос после установки — как влить все объекты (4к!) в мониторинг, и при этом успевать делать заявки, которые уже висят в Remedy. Zabbix уже поддерживал импорт/экспорт xml с данными по узлам сети. Количество объектов большое, создавать отдельную группу под объект смысла не было(да и не появилось), и было решено вгружать в качестве узла сети роутер объекта. Больше из сетевого оборудования ничего не управлялось (уже управляется).
Был сделан парсинг нашего файла с хостами сети (IPAM в excel), он и переформатирован в xml, который «Заббикс» согласен переварить. Не с первого раза, но все хосты были вгружены, актуализацию проводили раз в три месяца, удаляя закрывшиеся объекты и добавляя новые. Со временем получилось так, что Zabbix стал главным и единственным источником информации для нас и горячей линии по доступности объектов и, главное, по массовым падениям. Это позволило горячей линии узнавать о массовых авариях даже ночью, и будить инженеров звонками (к слову, когда никто об этом не знал, жить было проще). Не всегда ночные отключения питания в офисе позволяли ИБП достойно поддерживать мониторинг нашей сети. В какой-то момент мы стали уже делать бекапы. Т.к. мониторинг работал нестабильно и с перебоями, в компании приняли решение организовать группу, занимающуюся только этой задачей. Очень скоро она занялась внедрением централизованного Zabbix, который проверяет не только сеть.
Наш старенький Zabbix продолжал жить под столом. После добавления определенного количества item’ов стала немного тормозить база, web, очередь и задержка опроса вырастала, так что вскоре пришлось обзавестись еще двумя компьютерами в качестве proxy и поставить их все в кроссовую, чтобы уж настоящее резервирование (да и место под столом закончилось). Жизнь в нем поддерживалась, чтобы быстро добавлять какой-то кастомный параметр в мониторинг и наблюдать за ним. В остальном мы переехали на централизованный.
Централизованный мониторинг занимался всем IT-оборудованием – роутерами, серверами, кассами, терминалами. Спустя время он оброс огромным количеством item'ов. Для доступа к бесценной информации о доступности необходимо было слегка подождать, возможно, даже выпить кофе. К тому же у нас появлялось все больше требований к более специфичному и кастомному мониторингу сети. Имея на тот момент некоторый опыт по работе с системой, мы решили сделать старое внедрение с нуля, но уже правильно, — под названием zabbix.noc.x5.ru Он разместился в ЦОДе с реализацией необходимых нам функций by ourselves. Об этом то внедрении и основное тело статьи.
Zabbix version - 3.0 LTS . We are updating only within the limits of LTS versions.
Configuration - 4 virtual machines: Server + Database, Proxy, Proxy, Web
For resources, we tried to follow the recommendations on zabbix.com for a large and very large deployment.
The first problem we faced was the automatic addition of network nodes to the monitoring. Regular discovery disappeared immediately. Our range of networks is in all spaces of the 10/8 supernet. A lot of addresses would have to be polled and automatic detection would take up a lot of system resources, but would not solve the problem of adding non-technical information about the object.
How to add objects
The solution was to use external scripts to add objects. Master data on trade objects found in used in the company SAP'e. Synchronous access to the web-service to upload data directly from SAP did not come out, the request for all objects was carried out for a long time. Made an asynchronous call. Exactly at midnight, the full unloading from SAP is added to ftp as XML , and during the day XML 'ki with diffs from the latest versions are included. Zabbix API was
used to load data into Zabbix , and interacted with it from Python .
At the first stage, the data set was determined, which we need to create an object. We use all received signs for correct classification of an object in the system or for further convenience. These features include:
- IP Address - the most important field to create a monitoring interface.
- SAP ID - we have a unique object identifier
- Status - open / closed
- Name - the name or number of the object, often used by users when accessing
- Location - physical address
- Phone - contact phone
- Groups - we form this set of groups based on the type and location of the object.
Sap-sync.py module
XML from SAP
<?xml version="1.0" encoding="ISO-8859-1"?><werks><WERKS>1234</WERKS><NAME1>4321-Пятерочка</NAME1><PLANT_IP>192.168.1.50</PLANT_IP><REGION>31</REGION><PSTLZ>308580</PSTLZ><CITY1>с.Мониторинговое</CITY1><CITY2>Москвоская обл.</CITY2><STREET>Ленина ул.</STREET><HOUSE_NUM1>1</HOUSE_NUM1><TEL_NUMBER>(999)777-77-77</TEL_NUMBER><BRANCH>CH</BRANCH><REGION>CH_MSK</REGION><REGION_NAME>Регион Центральный</REGION_NAME><FORMAT>CH_MSK_D</FORMAT><STATUS>Объект открыт</STATUS></werks>sap-sync.py
#!/usr/bin/python3import sys, os, getopt, ipaddress
from datetime import datetime as dt
from zabbix.api import ZabbixAPI
import xml.etree.cElementTree as et
from report import report
import existhost
defping(ip):if os.system('ping -c 2 -W 1 %s > /dev/null'%ip) == 0:
        returnTrueelse:
        returnFalsedefmain(argv):global opath
    try:
        opts, args = getopt.getopt(argv,"hp:",["path="])
    except getopt.GetoptError:
        print('sync-sap-chg.py -p <path>')
        sys.exit(2)
    for opt, arg in opts:
        if opt == '-h':
            print('sync-sap-chg.py -p <path>')
            sys.exit()
        elif opt in ("-p", "--path"):
            opath = arg
defasynchronization(file, reportdata):
 zapi = ZabbixAPI(url='http://z.noc.x5.ru', user='user', password='pwd')
 #Константы, которые потом пригодятся
 left_kidney = '17855'
 right_kidney = '17856'
 f_type={'S':'Super','D':'DK','H':'Giper','A':'DK'}
 format={'D':'13','S':'14','H':'12','A':'13'}
 region={'CT':'21','UR':'19','SZ':'17',~omit~}
 try:
  #Начинаем разбор XML
  tree = et.ElementTree(file=file)
  root = tree.getroot()
  for werks in root.iter('werks'):
	#Создаем структуру словаря для объекта Zabbix
	interfaces=[{
	 'main':'1',
	 'type':'2',
	 'useip':'1',
	 'port':'161'
	}]
	shop={
	 'inventory':{},
	 'interfaces':interfaces,
	 'groups':[],
	 'templates':[{'templateid':'10194'}],
	 'inventory_mode':'1'
	}
	#Данные, которые будем искать в XML
	di = {
	 'WERKS':'',
	     ~omit~,
	 'STATUS':'Object Opened'
	}
	#Переводим все в словарьfor item in werks:
	  di[item.tag] = item.text
	  #Достаем из SAPID только цифрыif item.tag == 'WERKS':
	    n_proxy = ''.join(filter(lambda x: x.isdigit(), item.text))
	  #Находим IP роутера по адресу сервера. Подсеть везде /26try:
		ipaddress.ip_interface('%s/%s'%(di['PLANT_IP'].strip(),26))
		ip_chk = Trueexcept:
		ip_chk = False#Дальнейшая обработка, только если IP адрес верныйif (di['PLANT_IP'] != '1.1.1.1') and ip_chk:
		   #Записываем данные в словарьif di['FORMAT'][-1] in ['D','A','S','H']:
			  shop['inventory']['alias']=di['WERKS']
			  shop['inventory']['name']=di['NAME1']
			  shop['inventory']['poc_1_phone_a']=di['TEL_NUMBER']
			  shop['inventory']['location']=di['STREET']
		   #Особенности для каждого форматаif (di['FORMAT'][-1] in ['H']):
			  shop['host']=f_type[di['FORMAT'][-1]]+di['WERKS']
			  shop['interfaces'][0]['ip']=str(ipaddress.ip_interface('%s/%s'%(di['PLANT_IP'].strip(),24)).network[1])
			  #Добавляем ID шаблона мониторинга для объекта
			  shop['templates'][0]['templateid']='29529'elif (di['FORMAT'][-1] in ['S']):
			  ~omit~
		   #For D balance in proxiesif int(n_proxy[-1]) % 2 == 0:
			  shop['proxy_hostid'] = right_kidney
		   else:
			  shop['proxy_hostid'] = left_kidney
		   #В inventory тоже добавим IP
		   shop['inventory']['oob_ip']=shop['interfaces'][0]['ip']
		   #Назначение групп по словарям format и region
		   shop['groups']=[{'groupid':'9'}]
		   shop['groups'].append({'groupid':format[di['FORMAT'][-1]]})
		   shop['groups'].append({'groupid':region[di['FORMAT'][:2]]})
		   #Проверка статуса магазинаif di['STATUS'] == 'Объект открыт':
			  shop['status']='0'else:
			  shop['status']='1'#Записать текущую дату
		   T = dt.date(dt.now()).strftime("%d %B %Y")
		   shop['inventory']['date_hw_decomm'] = T
		   #Проверить есть ли такой хост в Zabbix
		   hostid = existhost.exist(shop['host'])
		   ip = shop['interfaces'][0]['ip']
		   #Если новый - создаем!if hostid == 0and shop['status'] == '0'and ping(ip):
			  zapi.host.create(shop)
			  reportdata['new'].append(di['WERKS'])
		   #Если уже есть - обновляем!elif hostid != 0and di['PLANT_IP'] != '1.1.1.1':
			  #Указываем какой HOSTID обновляем
			  shop['hostid']=hostid
			  #При обновлении нужно отрезать интерфейсы
			  shop.pop('interfaces')
			  zapi.host.update(shop)
			  reportdata['update'].append(di['WERKS'])
  #Переместить обработанный файл в архив
  os.system('mv %s /mnt/ftp/old_data/'%(file))
 except:
  reportdata['error'].append(di['WERKS'])
  report('Ошибка с файлом %s. Объект с ошибкой:%s'%(file, str(reportdata['error'])), 'SAP Sync Failed!')
  sys.exit()
defchecking(path):
	files = os.listdir(path)
	files.sort()
	reportdata ={'new':[], 'update':[], 'error':[]}
	for file in files:
		asynchronization(path+file, reportdata)
	if files != []:
		report('Файлы %s успешно синхронизированы! \n Добавлено %s объектов. \n Их sap:\n %s. \n Обновлено %s объектов. \n Их sap:\n %s'%(str(files), len(reportdata['new']), str(reportdata['new']), len(reportdata['update']), str(reportdata['update'])), 'SAP Sync Succeed!')
if __name__ == "__main__":
	main(sys.argv[1:])
	checking(opath)
The main purpose of this module is XML parsing and translation into JSON for Zabbix API. It is very convenient in this case to use Python dictionaries, since you do not need to format them further, - using the zabbix.api module, you can simply feed a dictionary with the correct structure to it. JSON with structure looks like this:
{
      'host': 'Hostname'
      'groups': [...]
      'interfaces': [{},{},{}]
      'inventory': {}
      'templates': [{},{},{}]
      'inventory_mode': '1'
      'proxy_hostid': 'INT'
      'status': '0'
}
[] - массив
{} - словарь
We in the field with the IP address in SAP store the address of the server, not the router, but using the ipaddress module, we consider the first subnet address, which in our case is always the router.
str(ipaddress.ip_interface('%s/%s'%(di['PLANT_IP'].strip(),24)).network[1])
The date of the last successful update is recorded in Inventory , in controversial situations it helps to understand how relevant the information is in the system.
#Записать текущую дату
T = dt.date(dt.now()).strftime("%d %B %Y")
shop['inventory']['date_hw_decomm'] = T
Then in the inventory it is very convenient to look at the statistics on the update date:
The most important field - STATUS , “open” - is added and starts to be monitored, any other status - deactivates the network node. Objects are not deleted in order to preserve historical data and statistics.
After the tests, I had to add the ping function in order to check if the host is available before the initial addition. in practice, “Open” statuses began to come across that are not quite open yet, but almost now.
defping(ip):if os.system('ping -c 2 -W 1 %s > /dev/null'%ip) == 0:
        returnTrueelse:
        returnFalse
Earlier in Zabbix API there was a host.exist function , but in new versions it was combined with host.get . If the node exists, the request returns hostid in the zabbix database. If not found, it returns 0. To verify now I had to add existhost , but in fact it is host.get .
existhost.py
#!/usr/bin/python3import sys, getopt
from zabbix.api import ZabbixAPI
defmain(argv):global aname
   try:
      opts, args = getopt.getopt(argv,"hn:",["name="])
   except getopt.GetoptError:
      print('existhost.py -n <name>')
      sys.exit(2)
   for opt, arg in opts:
      if opt == '-h':
         print('existhost.py -n <name>')
         sys.exit()
      elif opt in ("-n", "--name"):
         aname = arg
defexist(name):
   zapi = ZabbixAPI(url='http://z.noc.x5.ru/', user='user', password='pwd')
   hostget = zapi.host.get(search={'name':'%s'%name}, output='hostid')
   if hostget == []:
       return0else:
       return int(hostget[0]['hostid'])
if __name__ == "__main__":
        main(sys.argv[1:])
        print(exist(aname))
Finally, we collect information about the work done, add logs, reports and move the processed file to the repository in the OLD.
report.py
#!/usr/bin/python3# -*- coding: utf-8 -*-import smtplib, sys
from email.mime.text import MIMEText
defreport(message, subject):
	me = 'zbx-scripts@x5.ru'
	you = 'mail@x5.ru'
	smtp_server = 'smtp.ru'
	msg = MIMEText(message)
	msg['Subject'] = subject
	msg['From'] = me
	msg['To'] = you
	s = smtplib.SMTP(smtp_server)
	s.sendmail(me, [you], msg.as_string())
	s.quit()
if __name__ == '__main__':
	report(sys.argv[2], sys.argv[1])
In general, the base for monitoring is ready, let the script run in cron for autorun and forget.
How to fill inventory
We are no longer we, we are networkers.
The second stage - filling objects with the data that engineers need for work. You need to see all the data to solve the incident in one system, so as not to run on different systems, collecting information piece by piece from different sources. And since the main technical data is in monitoring, we also involve the rest in monitoring.
In order to collect and transmit the necessary information , inventory.py was written in Zabbix , which to a large extent deals with the collection of data on SNMP from equipment, and to a lesser parsing of the Excel file.
This begs the question - why not use the built-in item 's and enter their result in inventory by means of Zabbix itself? Three answers:
- Insufficient nesting of actions, since It is often necessary to pull a value on SNMP and use the result in the next query
- Running once a day the collection of data on all nodes with an external script does not burden the main monitoring activity and there is no queue for an item
- There is data that can not be collected via SNMP
The data on the providers, without which engineers of the 1st and 2nd lines cannot do, is stored in the excel-file on a common network drive and updated by the managers leading communication contracts. Integration with the file caused great doubts - the manual parsing of excel, which can change the structure, name, location, etc., will most likely be constantly throwing out errors. But due to the lack of other relevant source of such data had to use it. In order to somehow protect themselves from the constant changes of the script, we agreed with the managers about the structure and correct filling, explained how the automatic unloading will be performed and that it is important to observe the current structure. In practice, of course, errors occurred, but we rather quickly tracked them, swore, but corrected.
inventory.py
#!/usr/bin/python3# -*- coding: utf-8 -*-import sys, json, pysnmp, ipaddress, xlrd
from datetime import datetime as dt
from pysnmp.entity.rfc3413.oneliner import cmdgen
defsnmp(host, operation, *oid):
  generator = cmdgen.CommandGenerator()
  auth_data = cmdgen.UsmUserData('user', 'pwd', 'hash')
  transport = cmdgen.UdpTransportTarget((host, 161))
  getAtt = getattr(generator, '%sCmd'%operation)
  rst = (errorIndication, errorStatus, errorIndex, varBinds) = getAtt(auth_data, transport, *oid)
  ifnot errorIndication isNoneor errorStatus isTrue:
     return"Error: %s %s %s %s" % rst
  else:
     if operation=='get':
        return varBinds
     elif operation=='next':
        result=[]
        for var in varBinds:
           result.append(var)
        return result
defxlsdata(file, sap):
  rb = xlrd.open_workbook(file)
  sheet = rb.sheet_by_index(0)
  base = {}
  for i in range(0, sheet.nrows-1):
     sapnum = str(round(sheet.cell(i,4).value)) if isinstance(sheet.cell(i,4).value,float) else sheet.cell(i,4).value
     name = str(round(sheet.cell(i,8).value)) if isinstance(sheet.cell(i,8).value,float) else sheet.cell(i,8).value
     if sap.upper() == sapnum.upper():
        base = {
          'type'		: (sheet.cell(i,2).value),
          'serialno_a'	: (sheet.cell(i,13).value),
          'serialno_b'	: (sheet.cell(i,20).value),
          'tag'		: ('2') if sheet.cell(i, 20).value != ''else ('1'),
          'macaddress_a'	: (sheet.cell(i, 15).value),
          'macaddress_b'	: (sheet.cell(i, 22).value)
        }
        base['date_hw_purchase'] = dt.date(dt.now()).strftime("%d %B %Y")
  return (base)
definventory(host, sap):
  BGPASBASE={}
  for line in open('/path/a.prokhorov/integration/BGP-AS-BASE.cfg'):
     if':'in line:
        line = line.split(':')
        BGPASBASE[line[0]]='%s(%s)'%(line[1].rstrip(), line[0])
  ### Get Data from Operator
  shop = xlsdata('/mnt/oprf/providers_base.xlsx', sap)
  shop['date_hw_expiry'] = 'Failed'### Get SNMP data
  shop['host_router'] = 'None'
  shop['host_netmask'] = 'None'
  shop['host_networks'] = 'None'try:
     ### Get Networks from router
     networks = ''for ip,mask in snmp(host, 'next', 'iso.3.6.1.2.1.4.20.1.1', 'iso.3.6.1.2.1.4.20.1.3'):
        networks = networks+str(ipaddress.ip_interface(u'%s/%s'%(ip[1].prettyPrint(), mask[1].prettyPrint())))+'\n'
     shop['host_networks']=networks
     ### Get BGP information
     bgppeers, ispnames = '',''for peer,asbgp in snmp(host, 'next', 'iso.3.6.1.2.1.15.3.1.7', 'iso.3.6.1.2.1.15.3.1.9'):
        asbgp = asbgp[1].prettyPrint()
        bgppeers = bgppeers+peer[1].prettyPrint()+'\n'
        ispnames = ispnames+(BGPASBASE.get(asbgp) if BGPASBASE.get(asbgp)!=Noneelse asbgp)+'\n'
     shop['host_router'] = bgppeers.strip()[:38]
     shop['host_netmask'] = ispnames.strip()[:38]
     ### Get Vendor name and Model type
     hardware = snmp(host, 'get', 'iso.3.6.1.2.1.47.1.1.1.1.13.1', 'iso.3.6.1.2.1.47.1.1.1.1.10.1', 'iso.3.6.1.2.1.47.1.1.1.1.12.1', 'iso.3.6.1.2.1.1.1.0', 'iso.3.6.1.2.1.47.1.1.1.1.7.1')
     if str(hardware[0][1]) == '0235A325':
        shop['model'] = hardware[4][1].prettyPrint()
     else:
        shop['model'] = hardware[0][1].prettyPrint()
     shop['os_short'] = hardware[1][1].prettyPrint()
     shop['vendor'] = hardware[2][1].prettyPrint()
     version = hardware[3][1].prettyPrint()
     os = version.split('\n')[0]
     shop['os_full'] = version[:250]
     shop['os'] = ''.join(os.split(',')[:2])[:60]
     ### Make indicators
     shop['date_hw_expiry'] = 'Success'
     shop['date_hw_install'] = dt.date(dt.now()).strftime("%d %B %Y")
  except:
     shop.pop('host_router')
     shop.pop('host_netmask')
     shop.pop('host_networks')
  return shop
  #return json.dumps(dict([('inventory',shop)]), sort_keys=True, indent=4)if __name__ == "__main__":
  print(inventory(sys.argv[1], sys.argv[2]))
BGP-AS-BASE.cfg
3216:Beeline

9002:Retn

2854:Orange

~omit~

8359:MTS
The file BGP-AS-BASE.cfg represents the correspondence between the AS number and the name of the provider. It is necessary to determine the provider with which BGP is established (all of a sudden there is an error in the contract file). The external base was not used, since There are many private AS numbers .
In the SNMP part :
- we request the subnet router by OID 1.3.6.1.2.1.4.20.1.1 and the subnet masks by OID 1.3.6.1.2.1.4.20.1.3 in a single request. We process, translate into the form xxxx / xx and write to the host_networks cell .
- we request the data on the ip addresses of BGP peers, as well as their ASN , we find in the database we created the name of the provider by the number. We write them in the host_router and host_netmask fields . It is important to immediately make a limit of 38 characters, since these fields do not support more. We have the names of the fields in the database do not always coincide with the data they store, because used the already existing fields in the Zabbix database, so that it does not bother with the creation of new fields in the table. The correct field names ruled in WEB, there was no confusion.
- unload data on the vendor, model and software equipment. Parsim, we write to variables. The construction associated with the recording of the model of the piece of iron is due to the fact that Cisco in some models has the name written in another OID (most often for the chassis), so I had to do additional data verification.
The whole block associated with SNMP is enclosed in try-except , so that if there is no SNMP equipment on the script, the script does not fall out, and we at least get data from Excel from the providers. To understand which part of the script is executed and which is not - the success of the SNMP block is recorded in the date_hw_expiry field , plus the date is recorded, when it was last able to remove all data on SNMP, and the date when it was last able to find data in the Excel file.
All this is returned in the form of JSON ready for Zabbix .
Updating all inventory data is run once a day, unloading all hosts and running inventory.py for each object.
mp-update.py
#!/usr/bin/python3# -*- coding: utf-8 -*-from multiprocessing import Pool
import time
from zabbix.api import ZabbixAPI
from inventory import inventory
from report import report
defupdating(shop):try:
    shop['inventory'] = inventory(shop['interfaces'][0]['ip'], shop['host'][-4:])
    shop.pop('interfaces')
    shop['inventory_mode'] = '1'
    shop.pop('host')
    print (shop['hostid'])
    return zapi.host.update(shop)
  except:
    print(">>>",shop['hostid'])
    with open ('/home/local/integration/error.txt', 'a') as err:
       err.write(shop['hostid'])
       err.write("\n")
if __name__ =='__main__':
  t = time.time()
  zapi = ZabbixAPI(url='http://z.noc.x5.ru/', user='user', password='pwd')
  shopbase = zapi.host.get(output=['host', 'hostid'], groupids= ['12', '13', '14'], monitored="1", selectInterfaces=['ip'])
  pool = Pool(processes=10)
  p=[0for x in range(0,len(shopbase))]
  for i in range(0, len(shopbase), 10):
     print ("Index:", i,"\n",shopbase[i],"\n")
     pool.map(updating,shopbase[i:i+10])
  pool.close()
  pool.join()
  print(time.time()-t)
  report('Инвентарные данные обновлены в Zabbix.', 'Inventory updating succeed')
Multiprocessing is used (example taken from the vast expanses of the Internet). To search, use the SAP ID , which we have in the host name. The resulting output is recorded update in the Zabbix.
Summary
For the implementation of all the integration, auto-update and update the built-in mechanisms of the Zabbix API is more than enough. The main functions used are host.get , host.create and host.update , which together allow you to fully manage the creation and updating of the database of monitoring objects. Data to the input of these functions can be supplied from any systems and sources that are available.
The main modules of python that helped us cope with this task: pysnmp , xlrd , zabbix.api , xml , ipaddress , json .
xlrd - excel parsing.
xml - parsing XML.
pysnmp - pulling data via SNMP from equipment.
Interaction via SNMP is easier than via SSH, at least because in practice, the hardware responds more quickly to SNMP than it does to an SSH connection, parsing SNMP responses is almost unnecessary, although the CLI of different vendors often differs greatly from one another the teams may differ even in different models of the same vendor.
The main OIDs used are:
iso.3.6.1.2.1.4.20.1.1 - addresses of all interfaces of the router
iso.3.6.1.2.1.4.20.1.3 - subnet masks of all interfaces of the router
iso.3.6.1.2.1.15.3.1.7 - all BGP peers of the router
iso.3.6.1.2.1.15.3.1.9 - AS of all BGP peers of the iso.3.6.1.2.1.47.1.1.1.1.1.13.1 router
- model
iso.3.6.1.2.1.47.1.1.1.1.10.1 - short version of software
iso.3.6.1.2.1.47.1.1.1.1.12.1 - vendor
iso.3.6.1.2.1.1.1.0 - detailed version of software
iso.3.6 .1.2.1.47.1.1.1.1.7.1 - model, chassis type
Dashboard had to be added a little to separate problems on trading networks and not to disturb them in a heap. Also add several fields, for example ip, the name of the provider and the address, so that in the event of a mass accident it was enough to copy-paste from the browser into the letter all the objects with the problem, immediately with all the necessary data for the provider.
Separately, a “Workview” was written in which we can find all the collected information, plus graphs that are collected for this object.