11 tips to save time while debugging programs
- Transfer
Programming is not only when you write code, run it and observe with satisfaction its flawless performance, because often it does not work at all the way we expect! There is a need for effective debugging of applications, and this, it turns out, is a whole art! In this article, I provide my own list of tips that I hope will help you in debugging native code.
The original article was written by Bartlomiej Filipek and published on his blog .
Every programmer needs to know how to start the debugger, set breakpoints, resume code execution, enter and exit functions (using the keyboard!). Here are some simple tips to ease the debugging process based on basic tricks.
Regardless of your skill level, you probably still use one of the main debugging methods: you track certain values using functions and macros printf , TRACE , outputDebugString , etc. and check the debugger report. In Visual Studio, you can do one interesting trick that allows you to quickly jump from the output window to a specific line of code.
To do this, you just need to set the following output format:
However, remember that the values of file and line must be taken according to their actual position in the source file, and not in the register function, so you probably need a macro like this:
Note that __LINE__ and __FILE__ are standard ANSI-compatible predefined preprocessor macros that can be recognized by the compiler. See Predefined Macros, MSDN .
Also, remember to use the OutputDebugString function to display the message in the output window, not in the console.
Now, when a message appears in the VS output window, you can double-click on it to go to the specified file and line. In the same way, you can work with warnings or error messages at compile time. Once I received an error message, but could not determine its exact location in the code, which is why I lost a lot of time. At that time I had to find a string, and this is a long and laborious process. The described double-click transition to the code allows you to do this in a matter of milliseconds.
By the way, if you have another IDE (not Visual Studio), is there such an opportunity in it? Unsubscribe in the comments, I would be interested to know.
And here is a simple code example where you can try out the described technique: github.com/fenbf/DebuggingTipsSamples .
Update: as jgalowicz pointed out in his comment, if you want the file names to be displayed in abbreviated form, make the __SHORT_FILE__ macro : see the blog post for implementation details . However, in Visual Studio , the / FC compiler option is disabled by default, so usually abbreviated file names (related only to the solution directory) are usually issued.
The function Edit And Continue in Visual studio is a very powerful tool, but you can get by with its simplified, “manual” version. She is not so elegant, but she fulfills her task. You just need to get a static variable with which you will control one or another option of the program. To do this, you can use the usual Boolean flag or an integer variable. During debugging, the value of this variable can be changed, which allows you to examine the operation of the option without restarting or rebuilding the program.
How to change value during debugging? Go to the Watch window, or simply move the cursor over the variable - an edit box should appear in which you can set the desired value.
And don't forgetdisable / remove this terrible variable in final builds and commits!
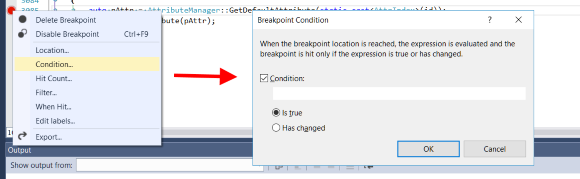
I hope you already use conditional control points, but I still want to briefly talk about the main ways to use them. As the name implies, the work of the debugger at these points is suspended when a certain condition (quite simple) is met.
One small piece of advice: write your own breakpoint if you need to investigate how a piece of code works in more detail.
See the list of expressions used in the conditions: msdn: Expressions in the Debugger
But that is not all.
As you must have noticed in the screenshot, there is another useful condition for the breakpoint: “Hit count”. With it, you can set the number of events after which the checkpoint will be activated. This option is very useful when you need to track some kind of dynamic event or many objects.
How many times have you been forced to enter the string type constructor in order to quickly exit it? Or in many small / library functions before you could get to the right method? In most cases, this is a waste of time.
Take a look at this example:
Now try entering the call to the MyFunc () function by pressing Ctrl + F11 . Where will the debugger go? Here's what happens to me:
Moreover, if you exit this constructor and again go into it ... then you will get into the constructor of the second parameter. Now imagine what will happen if there are several such parameters. Go crazy until you get to the right method!
As a rule, it is better to filter out such unwanted methods: it is unlikely that the problem lies in the constructor of std :: string :)
How to filter out these basic functions? Starting from version 2012, in VS it is enough to edit the default.natstepfilter file .
See how to filter functions in earlier versions of VS here: How to Not Step Into Functions using the Visual C ++ Debugger . There you have to tinker with registry values.
As an additional incentive, I’ll inform you that Visual Assist has the same option and it’s much easier to work with it. In debug mode, the VA Step Filter window is displayed : just check or uncheck the box next to the desired method from the list of found methods. These settings can be applied both globally and locally for a given project. The filtering settings in VA are user-defined and cannot be added to the default.natstepfilter file .
The more data, the better! Unwanted messages can always be filtered out, but you cannot get data from nothing. Depending on your specific goals, it may be useful to create several auxiliary variables in the objects: during debugging, these variables can provide very valuable information or simply facilitate the work process.
For example, when working with tree structures, you probably often need to check the pNext and pPrev elements . These pointers are usually placed in some base class like TreeNode , and if you are interested in MyTreeNode , which is three levels lower in the class hierarchy, checking pNext every time can be quite tedious. But what if you updateMyTreeNode adding data from pNext to it ? Then it will not be necessary to go through all the levels of the hierarchy each time to check this element. The described method, however, has one drawback: you need to somehow fix this updated state. The pNext value can easily change, so additional logic will have to be implemented to synchronize these changes. However, although this is true in most cases, a less elegant and effective solution will work for debugging tasks.
I will give an example.
I often have to work with tree structures representing text objects. A text object contains strings, and strings contain characters. Checking every time which line I am currently in (that is, what text it contains) was very tiring, because I had to return the first character of the line and then look at the value using the pNext pointer to find out the second character and based on these two characters to see what kind of string. How to simplify this process? I just started the strLine variable and added it to Lineand periodically update it. Although this is also an imperfect source of information (data is lost if a character is added or deleted in one frame, but they still appear in the next frame), but at least I can quickly find out which line I'm currently in. So simple! And you can save a lot of time.
This is an extensive topic, which I will only briefly introduce here:
If you do not like how objects are displayed in the debugger, try writing your own visualizers.
Debug Visualizers in Visual C ++ 2015
In VS2015, a new built-in template has even appeared, which can be found in the file Project → Add New Item → Visual C ++ → Utility → Debugger visualization file (.natvis) .
Based on basic debugging techniques, you can build more complex ones.
If some code is called for many objects, it is very problematic to go through all these objects and check them line by line. But what if you use the unique value of a field as a hint about where to look for an error? To do this, you can create a conditional control point at which this value will be compared with a certain range. The smaller this range, the better.
Example: I often had to debug code sorting through all the characters in a document. There was a problem with one (special) character. It is impossible to debug all characters individually, but I knew that this particular character differed from the others in the size of the bounding box, so I set a conditional control point at which the value of width was checkedthanks to which I was able to access this symbol (condition width> usual_char_width ). Only two or three elements met this condition, so I quickly figured out the error.
Generally speaking, the narrower such ranges, the better: do not have to check dozens or hundreds of places.
Debugging mouse events is especially difficult because most of these events disappear when the debugger stops!
Debugging mouse clicks is usually straightforward. For example, if you need to check what code was called up with a mouse click on some object, you just need to create a control point at the entrance to the OnClick / onMouseDown method .
What about dragging and dropping objects? When the debugger stops, the drag state is lost. In such situations, you can try the following tricks:
This tip suggests further development of the technique with the creation of simple auxiliary variables. If you work with complex objects, it’s good to have tools that could more effectively track data. A basic set of such tools can be found in Visual Studio and any other IDE or debugger, but since all projects are different, it is better to develop your own solutions.
This situation, it seems to me, is typical of games. You can, for example, create an additional layer of the interface and turn it on during the game to see game statistics, information about performance and memory consumption. The amount of information displayed is limited only by your needs. So I highly recommend taking the time to create such tools.
Release builds are faster because almost all code optimizations are already included. However, nothing prevents debugging in this case either. How exactly can this be implemented? You need to do the following (for VS 2013 or VS 2015):
In this article I have given 11 tips to help you speed up the process of debugging programs. Which ones are most valuable? Perhaps these are points about conditional control points, debugging a lot of objects and accelerating the debugging version. However, the remaining tips are also important, so I find it difficult to arrange them in any particular order. In addition, depending on specific tasks, it is often necessary to give preference to different techniques.
Moreover, this list is clearly not complete - there are many other tricks and practices. Perhaps you also have something to add?
The original article was written by Bartlomiej Filipek and published on his blog .
Aids
Every programmer needs to know how to start the debugger, set breakpoints, resume code execution, enter and exit functions (using the keyboard!). Here are some simple tips to ease the debugging process based on basic tricks.
1. Add error location information to the debugger report (LinePos)
Regardless of your skill level, you probably still use one of the main debugging methods: you track certain values using functions and macros printf , TRACE , outputDebugString , etc. and check the debugger report. In Visual Studio, you can do one interesting trick that allows you to quickly jump from the output window to a specific line of code.
To do this, you just need to set the following output format:
"%s(%d): %s", file, line, messageHowever, remember that the values of file and line must be taken according to their actual position in the source file, and not in the register function, so you probably need a macro like this:
#define MY_TRACE(msg, ...)
        MyTrace(__LINE__, __FILE__, msg, __VA_ARGS__)
// usage:
MY_TRACE("hello world %d", 5);
Note that __LINE__ and __FILE__ are standard ANSI-compatible predefined preprocessor macros that can be recognized by the compiler. See Predefined Macros, MSDN .
Also, remember to use the OutputDebugString function to display the message in the output window, not in the console.
Now, when a message appears in the VS output window, you can double-click on it to go to the specified file and line. In the same way, you can work with warnings or error messages at compile time. Once I received an error message, but could not determine its exact location in the code, which is why I lost a lot of time. At that time I had to find a string, and this is a long and laborious process. The described double-click transition to the code allows you to do this in a matter of milliseconds.
By the way, if you have another IDE (not Visual Studio), is there such an opportunity in it? Unsubscribe in the comments, I would be interested to know.
And here is a simple code example where you can try out the described technique: github.com/fenbf/DebuggingTipsSamples .
Update: as jgalowicz pointed out in his comment, if you want the file names to be displayed in abbreviated form, make the __SHORT_FILE__ macro : see the blog post for implementation details . However, in Visual Studio , the / FC compiler option is disabled by default, so usually abbreviated file names (related only to the solution directory) are usually issued.
2. Create a simple static variable to control this or that option
// change while debugging if needed
static bool bEnableMyNewFeature = true;
The function Edit And Continue in Visual studio is a very powerful tool, but you can get by with its simplified, “manual” version. She is not so elegant, but she fulfills her task. You just need to get a static variable with which you will control one or another option of the program. To do this, you can use the usual Boolean flag or an integer variable. During debugging, the value of this variable can be changed, which allows you to examine the operation of the option without restarting or rebuilding the program.
How to change value during debugging? Go to the Watch window, or simply move the cursor over the variable - an edit box should appear in which you can set the desired value.
And don't forgetdisable / remove this terrible variable in final builds and commits!
3. Conditional breakpoints
I hope you already use conditional control points, but I still want to briefly talk about the main ways to use them. As the name implies, the work of the debugger at these points is suspended when a certain condition (quite simple) is met.
One small piece of advice: write your own breakpoint if you need to investigate how a piece of code works in more detail.
See the list of expressions used in the conditions: msdn: Expressions in the Debugger
But that is not all.
As you must have noticed in the screenshot, there is another useful condition for the breakpoint: “Hit count”. With it, you can set the number of events after which the checkpoint will be activated. This option is very useful when you need to track some kind of dynamic event or many objects.
4. Do not enter functions that you do not want to perform
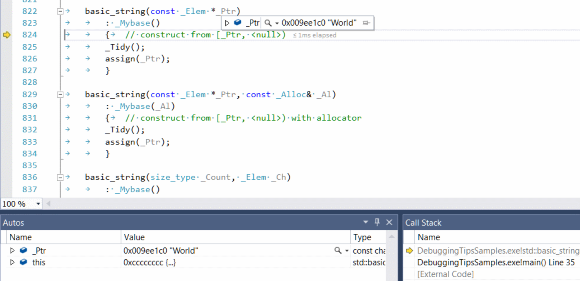
How many times have you been forced to enter the string type constructor in order to quickly exit it? Or in many small / library functions before you could get to the right method? In most cases, this is a waste of time.
Take a look at this example:
void MyFunc(const string &one, const string &two)
{
  auto res = one + two;
  std::cout << res << "\n";
}
....
MyFunc("Hello ", "World");
Now try entering the call to the MyFunc () function by pressing Ctrl + F11 . Where will the debugger go? Here's what happens to me:
Moreover, if you exit this constructor and again go into it ... then you will get into the constructor of the second parameter. Now imagine what will happen if there are several such parameters. Go crazy until you get to the right method!
As a rule, it is better to filter out such unwanted methods: it is unlikely that the problem lies in the constructor of std :: string :)
How to filter out these basic functions? Starting from version 2012, in VS it is enough to edit the default.natstepfilter file .
See how to filter functions in earlier versions of VS here: How to Not Step Into Functions using the Visual C ++ Debugger . There you have to tinker with registry values.
As an additional incentive, I’ll inform you that Visual Assist has the same option and it’s much easier to work with it. In debug mode, the VA Step Filter window is displayed : just check or uncheck the box next to the desired method from the list of found methods. These settings can be applied both globally and locally for a given project. The filtering settings in VA are user-defined and cannot be added to the default.natstepfilter file .
5. Add helper variables for objects in debug mode
The more data, the better! Unwanted messages can always be filtered out, but you cannot get data from nothing. Depending on your specific goals, it may be useful to create several auxiliary variables in the objects: during debugging, these variables can provide very valuable information or simply facilitate the work process.
For example, when working with tree structures, you probably often need to check the pNext and pPrev elements . These pointers are usually placed in some base class like TreeNode , and if you are interested in MyTreeNode , which is three levels lower in the class hierarchy, checking pNext every time can be quite tedious. But what if you updateMyTreeNode adding data from pNext to it ? Then it will not be necessary to go through all the levels of the hierarchy each time to check this element. The described method, however, has one drawback: you need to somehow fix this updated state. The pNext value can easily change, so additional logic will have to be implemented to synchronize these changes. However, although this is true in most cases, a less elegant and effective solution will work for debugging tasks.
I will give an example.
I often have to work with tree structures representing text objects. A text object contains strings, and strings contain characters. Checking every time which line I am currently in (that is, what text it contains) was very tiring, because I had to return the first character of the line and then look at the value using the pNext pointer to find out the second character and based on these two characters to see what kind of string. How to simplify this process? I just started the strLine variable and added it to Lineand periodically update it. Although this is also an imperfect source of information (data is lost if a character is added or deleted in one frame, but they still appear in the next frame), but at least I can quickly find out which line I'm currently in. So simple! And you can save a lot of time.
6. Write your own debugging visualizers
This is an extensive topic, which I will only briefly introduce here:
If you do not like how objects are displayed in the debugger, try writing your own visualizers.
Debug Visualizers in Visual C ++ 2015
In VS2015, a new built-in template has even appeared, which can be found in the file Project → Add New Item → Visual C ++ → Utility → Debugger visualization file (.natvis) .
Debugging Techniques
Based on basic debugging techniques, you can build more complex ones.
7. Have to check a lot of objects?
If some code is called for many objects, it is very problematic to go through all these objects and check them line by line. But what if you use the unique value of a field as a hint about where to look for an error? To do this, you can create a conditional control point at which this value will be compared with a certain range. The smaller this range, the better.
Example: I often had to debug code sorting through all the characters in a document. There was a problem with one (special) character. It is impossible to debug all characters individually, but I knew that this particular character differed from the others in the size of the bounding box, so I set a conditional control point at which the value of width was checkedthanks to which I was able to access this symbol (condition width> usual_char_width ). Only two or three elements met this condition, so I quickly figured out the error.
Generally speaking, the narrower such ranges, the better: do not have to check dozens or hundreds of places.
8. Mouse events
Debugging mouse events is especially difficult because most of these events disappear when the debugger stops!
Debugging mouse clicks is usually straightforward. For example, if you need to check what code was called up with a mouse click on some object, you just need to create a control point at the entrance to the OnClick / onMouseDown method .
What about dragging and dropping objects? When the debugger stops, the drag state is lost. In such situations, you can try the following tricks:
- Use the good old trace / printf . When dragging and dropping a lot of messages that will help to understand what is happening without having to interrupt the execution of the code. This method is suitable for short-term drag and drop operations, because otherwise the output will be too much data. With this information, you can localize the problem and return to it later.
- Establish conditional control points in those places that require verification. For example, when you rotate an object, it may suddenly change position, and you need to figure out why this happens. To do this, you create control points at the entrance to the members responsible for the position of the object, which gives you the opportunity to study them. When the debugger stops, the rotation state is lost, but before this happens, you can determine the potential location of the problem in the code. Another way is to use the obj_rot> some_meaningful_value condition.
- Dragging and dropping objects often occurs while they are being copied. In this case, upon completion of the copy operation, the original objects are assigned the corresponding status. What if you set a checkpoint at which only original objects would be scanned? Or implement a special state that signals a drag operation ? In this case, the debugger will stop when this operation is completed.
9. Create debugging visualizers and other tools
This tip suggests further development of the technique with the creation of simple auxiliary variables. If you work with complex objects, it’s good to have tools that could more effectively track data. A basic set of such tools can be found in Visual Studio and any other IDE or debugger, but since all projects are different, it is better to develop your own solutions.
This situation, it seems to me, is typical of games. You can, for example, create an additional layer of the interface and turn it on during the game to see game statistics, information about performance and memory consumption. The amount of information displayed is limited only by your needs. So I highly recommend taking the time to create such tools.
Other
10. Debugging in Release mode
Release builds are faster because almost all code optimizations are already included. However, nothing prevents debugging in this case either. How exactly can this be implemented? You need to do the following (for VS 2013 or VS 2015):
- Set the Debug Information Format option to / Z7 (C7 compatibility format) or / Zi (program database format).
- Set Enable Incremental Linking to No
- Set Generate Debug Info option to yes
- Set the References option to / OPT: REF , and Enable COMDAT Folding to / OPT: ICF
11. Speeding up debugging assembly!
- If the debugger is slow, check the option Tools → Options → Debugging → General → “Require source files to exactly match the original version” . I found out about her here .
- Disable debugging heap ( Debug Heap ) - relevant for versions earlier than VS 2015. You can read about what it is in one of my previous articles: Visual Studio slow debugging and _NO_DEBUG_HEAP . Fortunately, in VS2015, the debug heap is disabled by default, so you should not have problems with this.
- Limit the download of debug symbol files. This technique reduces the number of downloaded symbol files, which will speed up the launch of the program. See here for details: Understanding symbol files and Visual Studio's symbol settings
Conclusion
In this article I have given 11 tips to help you speed up the process of debugging programs. Which ones are most valuable? Perhaps these are points about conditional control points, debugging a lot of objects and accelerating the debugging version. However, the remaining tips are also important, so I find it difficult to arrange them in any particular order. In addition, depending on specific tasks, it is often necessary to give preference to different techniques.
Moreover, this list is clearly not complete - there are many other tricks and practices. Perhaps you also have something to add?
- Do you use any special tricks when debugging applications?
- Do you resort to using custom tools?
Additional Resources
- Debugging: The 9 Indispensable Rules for Finding Even the Most Elusive Software and Hardware Problems
- Advanced Windows Debugging
- Debug It !: Find, Repair, and Prevent Bugs in Your Code
- Using Breakpoints, MSDN
- Navigating through Code with the Debugger, MSDN
- 10 More Visual Studio Debugging Tips for Native Development,
Marius Bancila, CodeProject - VA Step Filter, Visual Assist
- VC Team Blog: The Expression Evaluator
- VC Team Blog: Make Debugging Faster with Visual Studio