Python OLAP Organization
Good afternoon, dear readers.
Today I will tell you about how you can build a simple Python data analysis system. The framework cubes and the cubesviewer package will help me with this .
Cubes is a framework for working with multidimensional data using Python. In addition, it includes an OLAP HTTP server for simplified reporting application development and general data viewing.
Cubesviewer is a web-based interface for working with the above server.
First you need to install the libraries necessary for the package to work:
Next, install the cubes package itself :
As practice has shown, it is better to use the version (1.0alpha2) from the current repository .
If you plan to work under Windows, you need to replace the 40 line in the {PYTHON_DIR} \ Lib \ site-packages \ dateutil \ tz.py file:
on the
Then, regardless of the platform on which you are working, you need to add the following fix for the json parser to work correctly. It must be entered in {PYTHON_DIR} \ Lib \ site-packages \ cubes-1.0alpha-py2.7.egg \ cubes \ metadata.py starting from line 90:
For example, take the OLAP cube that comes with cubes . It is located in the examples / hello_world folder (you can get it from the repository).
The most interesting for us are 2 files:
Let us dwell on them in more detail. Let's start with the slicer.ini file , which may include the following sections:
So, we will analyze from our test file that the server will be located on the local machine and will work on the 5000 port. A local SQLite database called data.sqlite will be used as storage.
You can read more about server configuration in the documentation.
It can also be seen from the file that the description of the model of our cube can be found in the model.json file , a description of the structure of which we will now take up.
The model description file is a json file that includes the following logical sections:
The cubes and dimensions sections are of interest to us , because all others are optional.
The dimensions list item contains the following metadata:
The cubes list item contains the following metadata:
Based on the above, we can understand that we will have 2 dimensions in our model in ( item, year ). The item has 3 measurement levels:
As a measure in our cube, the “amount” field will act , for which the functions of sum and counting the number of rows are performed.
You can read more about marking a cube model in the documentation.
After we figured out the settings, we need to create our test database. In order to do this, you must run the prepare_data.py script :
Now all that remains is to start our test server with a cube called slicer :
After that, you can check the performance of our cube. To do this, in the browser line, you can enter:
localhost : 5000 / cube / irbd_balance / aggregate? Drilldown = year
In response, we get a json-object with the result of the aggregation of our data. Read more about the server response format here .
When we set up our cube, we can proceed with the installation of subviewviewer . To do this, copy the repository to your disk:
And then just move the contents of the / src folder to the desired location.
It should be noted that cubesviewer is a Django application, therefore, it requires Django (not higher than version 1.4) , as well as the requests and django-piston packages . Because Since this version of Django is already outdated, above I gave a link where you can get subviewviewer for version Django 1.6.
Installing it is slightly different from the original in that you need to add a line to the server configuration file
. By indicating to him the database settings, the OLAP server address (variable
remains to make a small fix in dajno-piston.
Now we can synchronize our application with the database. To do this, from {CUBESVIEWER_DIR} / web / cvapp you need to do:
It remains to start the local Django server
Now it remains to go to the specified
To illustrate the work, I took the simplest example. It should be noted that for production projects cubes can be deployed for example on apache or uswgi . Well, connecting cubesviewer to it using this article is not difficult.
If the topic is of interest to the community, I will disclose it in one of the future articles.
Today I will tell you about how you can build a simple Python data analysis system. The framework cubes and the cubesviewer package will help me with this .
Cubes is a framework for working with multidimensional data using Python. In addition, it includes an OLAP HTTP server for simplified reporting application development and general data viewing.
Cubesviewer is a web-based interface for working with the above server.
Install and configure cubes
First you need to install the libraries necessary for the package to work:
pip install pytz python-dateutil jsonschema
pip install sqlalchemy flask
Next, install the cubes package itself :
pip install cubes
As practice has shown, it is better to use the version (1.0alpha2) from the current repository .
Advanced settings for windows
If you plan to work under Windows, you need to replace the 40 line in the {PYTHON_DIR} \ Lib \ site-packages \ dateutil \ tz.py file:
return myfunc(*args, **kwargs).encode()
on the
return myfunc(*args, **kwargs)Then, regardless of the platform on which you are working, you need to add the following fix for the json parser to work correctly. It must be entered in {PYTHON_DIR} \ Lib \ site-packages \ cubes-1.0alpha-py2.7.egg \ cubes \ metadata.py starting from line 90:
elif len(parts.scheme) == 1 and os.path.isdir(source):
     # TODO: same hack as in _json_from_url
     return read_model_metadata_bundle(source)
Description of the cube setup and the process of its deployment
For example, take the OLAP cube that comes with cubes . It is located in the examples / hello_world folder (you can get it from the repository).
The most interesting for us are 2 files:
- slicer.ini - http server settings file for our cube
- model.json - file with a description of the cube model
Let us dwell on them in more detail. Let's start with the slicer.ini file , which may include the following sections:
[workspace]- workplace configuration[server]- server parameters (address, port, etc.)[models]- list of models to download[datastore] или [store]- data warehouse settings[translations]- localization settings for the model.
So, we will analyze from our test file that the server will be located on the local machine and will work on the 5000 port. A local SQLite database called data.sqlite will be used as storage.
You can read more about server configuration in the documentation.
It can also be seen from the file that the description of the model of our cube can be found in the model.json file , a description of the structure of which we will now take up.
The model description file is a json file that includes the following logical sections:
name- model namelabel- labeldescription- model descriptionlocale- locale for the model (if localization is specified)cubes- cube metadata listdimensions- dimension metadata listpublic_dimensions- list of available measurements. By default, all measurements are available.
The cubes and dimensions sections are of interest to us , because all others are optional.
The dimensions list item contains the following metadata:
| Key | Description |
|---|---|
| name | dimension identifier |
| label | Dimension name visible to user |
| description | measurement description for users |
| levels | List of measurement levels |
| hierarchies | List of hierarchies |
| default_hierarchy_name | Hierarchy id |
The cubes list item contains the following metadata:
| Key | Description |
|---|---|
| name | dimension identifier |
| label | Dimension name visible to user |
| description | measurement description for users |
| dimensions | list of measurement names given above |
| measures | list of measures |
| aggregates | list of aggregation functions |
| mappings | markup of logical and physical attributes |
Based on the above, we can understand that we will have 2 dimensions in our model in ( item, year ). The item has 3 measurement levels:
- category . Display name “Category”, fields “category”, “category_label”
- subcategory . Display name "Sub-category", fields "subcategory", "subcategory_label"
- line_item . Display name “Line Item”, field “line_item”
As a measure in our cube, the “amount” field will act , for which the functions of sum and counting the number of rows are performed.
You can read more about marking a cube model in the documentation.
After we figured out the settings, we need to create our test database. In order to do this, you must run the prepare_data.py script :
python prepare_data.py
Now all that remains is to start our test server with a cube called slicer :
slicer serve slicer.ini
After that, you can check the performance of our cube. To do this, in the browser line, you can enter:
localhost : 5000 / cube / irbd_balance / aggregate? Drilldown = year
In response, we get a json-object with the result of the aggregation of our data. Read more about the server response format here .
Install cubesviewer
When we set up our cube, we can proceed with the installation of subviewviewer . To do this, copy the repository to your disk:
git clone https://github.com/nonsleepr/cubesviewer.git
And then just move the contents of the / src folder to the desired location.
It should be noted that cubesviewer is a Django application, therefore, it requires Django (not higher than version 1.4) , as well as the requests and django-piston packages . Because Since this version of Django is already outdated, above I gave a link where you can get subviewviewer for version Django 1.6.
Installing it is slightly different from the original in that you need to add a line to the server configuration file
slicer.iniin the section.
After that, you need to configure the application in the file {CUBESVIEWER_DIR} /web/cvapp/settings.py[server]allow_cors_origin: localhost:8000. By indicating to him the database settings, the OLAP server address (variable
CUBESVIEWER_CUBES_URL) and the address of the viewer ( CUBESVIEWER_BACKEND_URL) It remains to make a small fix in dajno-piston.
Now we can synchronize our application with the database. To do this, from {CUBESVIEWER_DIR} / web / cvapp you need to do:
python manage.py syncdbIt remains to start the local Django server
python manage.py runserverNow it remains to go to the specified
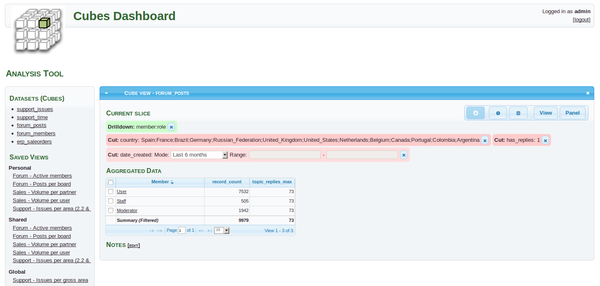
CUBESVIEWER_BACKEND_URLaddress through the browser. And enjoy the finished result.Conclusion
To illustrate the work, I took the simplest example. It should be noted that for production projects cubes can be deployed for example on apache or uswgi . Well, connecting cubesviewer to it using this article is not difficult.
If the topic is of interest to the community, I will disclose it in one of the future articles.