Amateur Radio Measurements: I2C Bus Signal Analysis

As I have repeatedly mentioned in my publications, amateur projects are funded from the family budget, and a radio amateur usually cannot afford to buy expensive measuring equipment. We have to be content with what we have. Or the fact that it is possible to take advantage of the use "for a while." And sometimes, out of despair, the radio amateur has to “drill with a saw and cut with a gimlet.”
Recently, I experienced the need to find out what is actually transmitted in the device I am developing on the I2C bus. It was that happy moment when one could afford to “saw with a saw”.
How data is exchanged between devices using the I2C protocol can be found here . To analyze the signals on the I2C bus, you can use both a digital dual-channel oscilloscope with memory and a logic analyzer.
Digital dual channel oscilloscope with memory
When working with electronic equipment, the oscilloscope is the most versatile tool. Modern digital oscilloscopes have a number of useful properties that allow, among other things, the analysis of I2C bus signals.
In this case, I got "for a while" a digital dual-channel oscilloscope with Rigol DS1102 memory (price on the manufacturer's website is $ 461). This device has two measurement channels with a bandwidth of up to 100 MHz and a signal sampling rate of 1 GSa / s.
CH1 was connected to the SCL signal. CH2 was connected to the SDA signal. Both channels had a scale of 1.00 V / div. Scanning scale - 10 us / cases. For clarity, the beam of the first channel is shifted to the upper half of the screen, and the beam of the second channel is shifted to the lower.
In the Trigger menu, the oscilloscope was set to measure once with the launch of a 1.00 V front channel CH1 level:
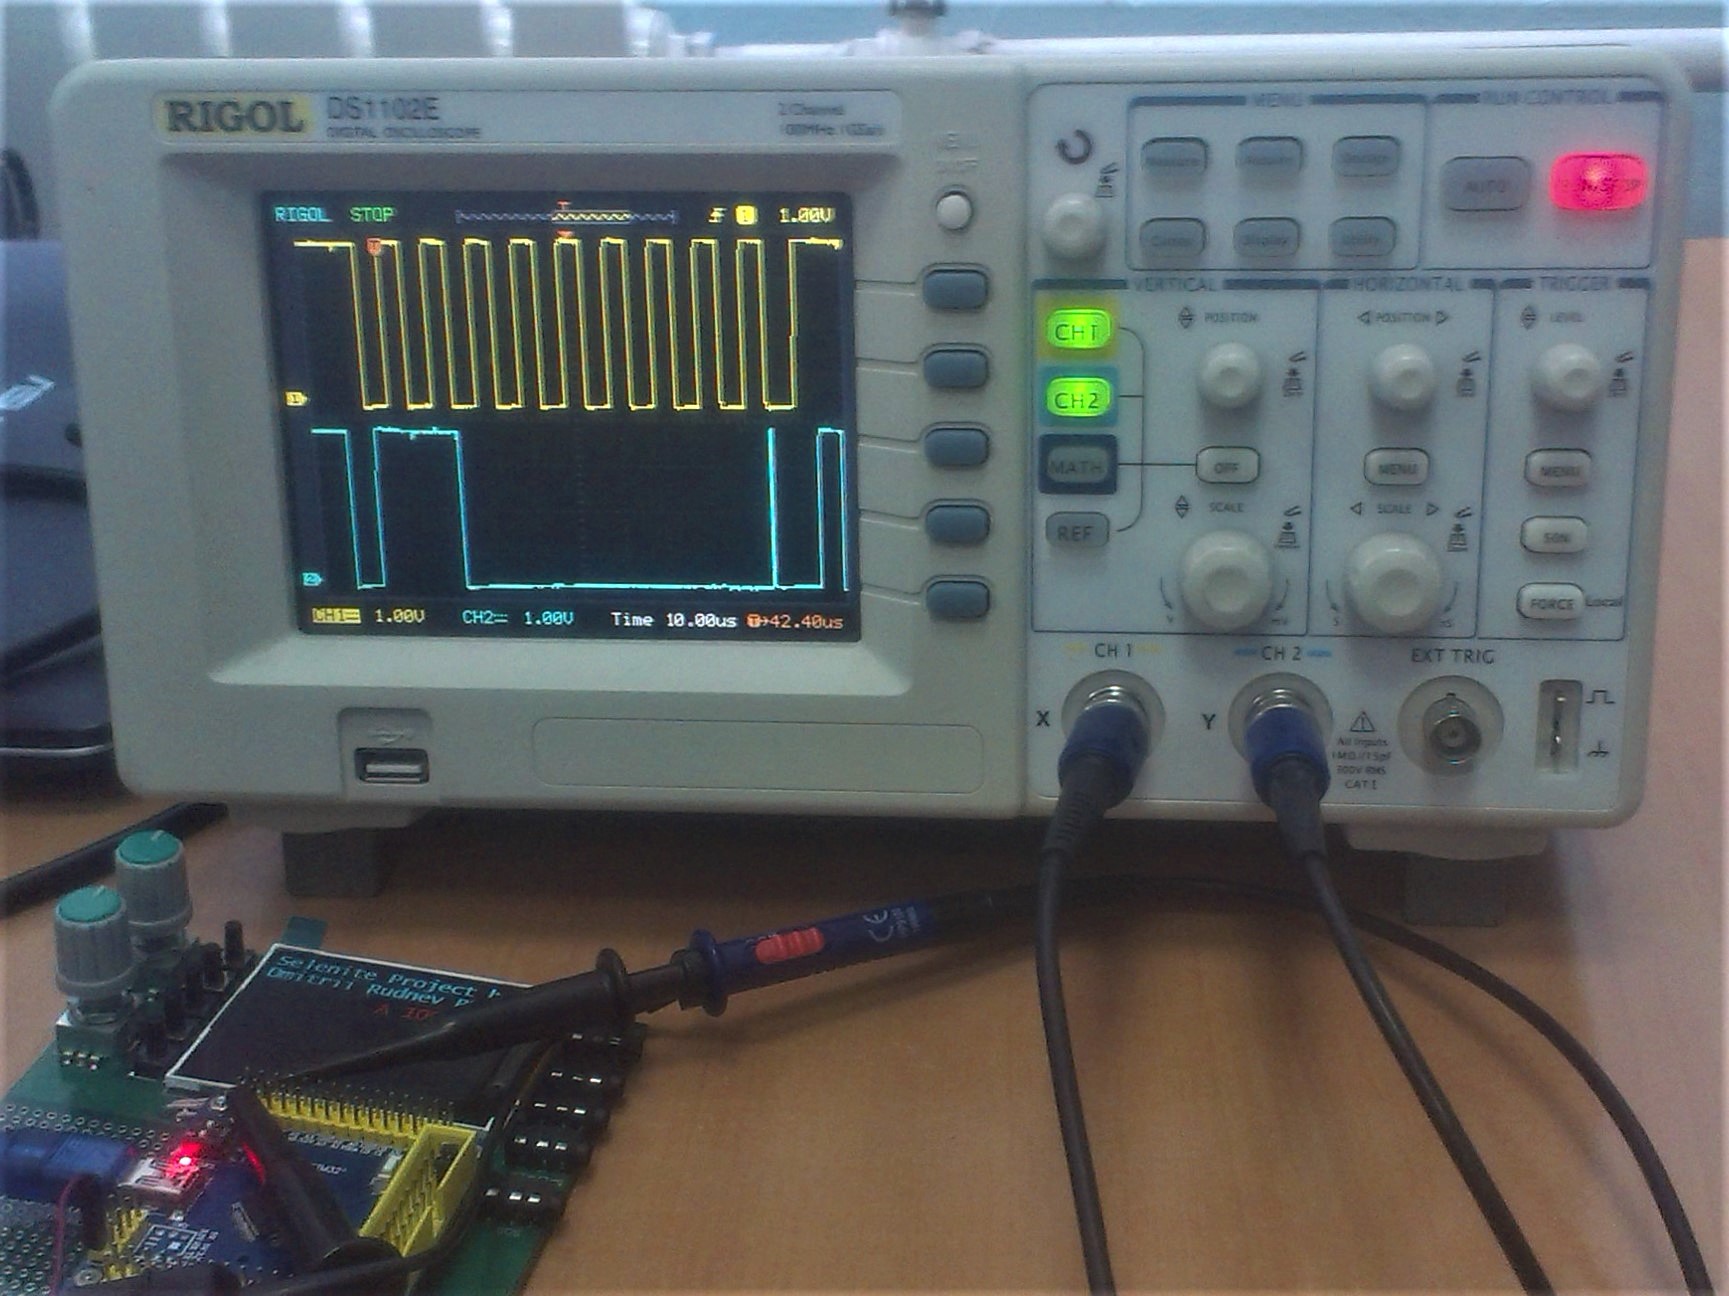
After turning on the equipment under test, the big red Run / Stop button was pressed. The oscilloscope went into standby mode, then it started. After a few seconds, the recording was stopped manually.
The resulting waveform was recorded on external media on-screen: Let
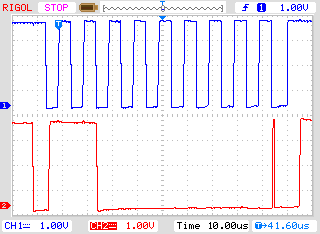
's analyze the recorded signals. On the first screen, we see the display of the instrument settings and the oscillogram of the SCL signals (upper part) and SDA (lower part of the screen), on which we read from left to right:
- START signal : the master device sets the low level first on the SDA bus and then on the SCL bus;
- 7-bit address : read 0x60 (1100000) on the SDA bus on the front edges of SCL;
- Record mode flag : read SDA bus low on the next leading edge of SCL;
- ACK signal : the master device switches to SDA bus after the transfer of a byte, the SDA is set to high level, the slave device on the falling edge of the SCL sets the SDA to a low level (the ACK signal itself), which the master reads on the leading edge of SCL;
- STOP signal : the master device sets the high level first on the SCL bus and then on the SDA bus
Similarly, slowly but surely, you can manually decrypt the rest of the recording.
Digital Signal Analyzer
Protocol decryption can be done more easily using a logic analyzer and appropriate software.
For use as a logic analyzer, I was kindly provided by colleagues at Saleae Logic 8 (price on the manufacturer’s website is $ 399). The demo version of Saleae Logic 1.2.18, taken from the official site, was used as software . By installing this software, I have accepted the license agreement with the condition, including not to use this software with third-party equipment.
The program included the protocol analyzer I2C. For the SCL signal, the channel CH0 was assigned, and for the SDA signal - channel CH1. The sampling rate of the signal is 24 MSa / s.
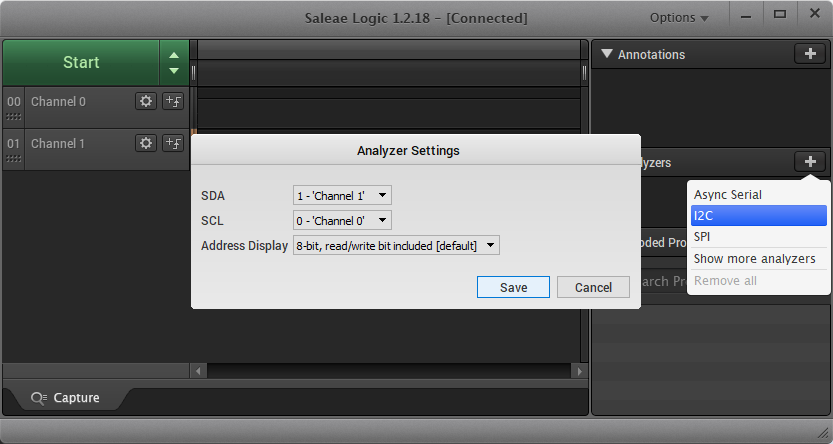
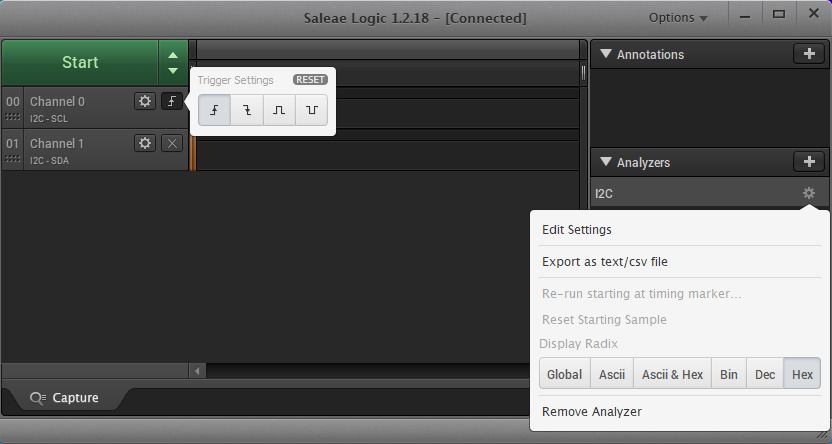
The launch was set up on the “fore” front of CH0. To display the data was selected in hexadecimal format.
After turning on the tested equipment, the big green Start button was pressed, and after a few seconds a diagram appeared on the screen:
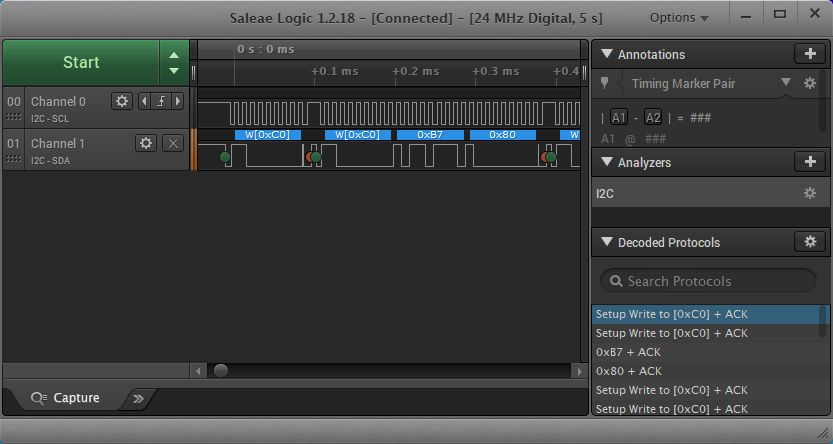
I see the maximum benefit in using the logic analyzer in that the program itself decrypts the data. The decryption results are entered line by line into the Decoded Protocols window. When you select a row of data in the window, the program shows the location of this data in the chart.
Digital oscilloscope vs logic analyzer
To compare the options, I “glued” four screen captures of the oscilloscope and a fragment of the logic analyzer diagram in the graphical editor:

Start is marked with a green circle, Stop - with a red circle. The diagram first checks for the presence on the bus of the device with the address 0x60, and then writes the value 0x80 to the 0xB7 register of this device.
If we compare the variants with “predilection”, we can see that on the logic analyzer diagram (sampling rate 24 MSa / s) there is “jitter” of the SCL signal, which is not present on the oscillogram with sampling frequency 1 GSa / s. The rest of the picture is the same, and the logical analyzer also performs the correct data decoding in automatic mode.
When choosing "or-or" in the "dry residue" we have, in the case of an oscilloscope, an expensive universal device, which is not so convenient for bus analysis as a logic analyzer, but for money comparable to it. Under these conditions, I personally, as an engineer of the “old school”, would have acquired a digital oscilloscope.
However, if there were software with a license agreement allowing the use of inexpensive clones of popular logic analyzers, such as Saleae Logic 8 or DSLogic Plus ...
And such software exists
Inexpensive clones of popular logic analyzers, and not only them, are supported by the open source software of the sigrok project .
The workplace was assembled:
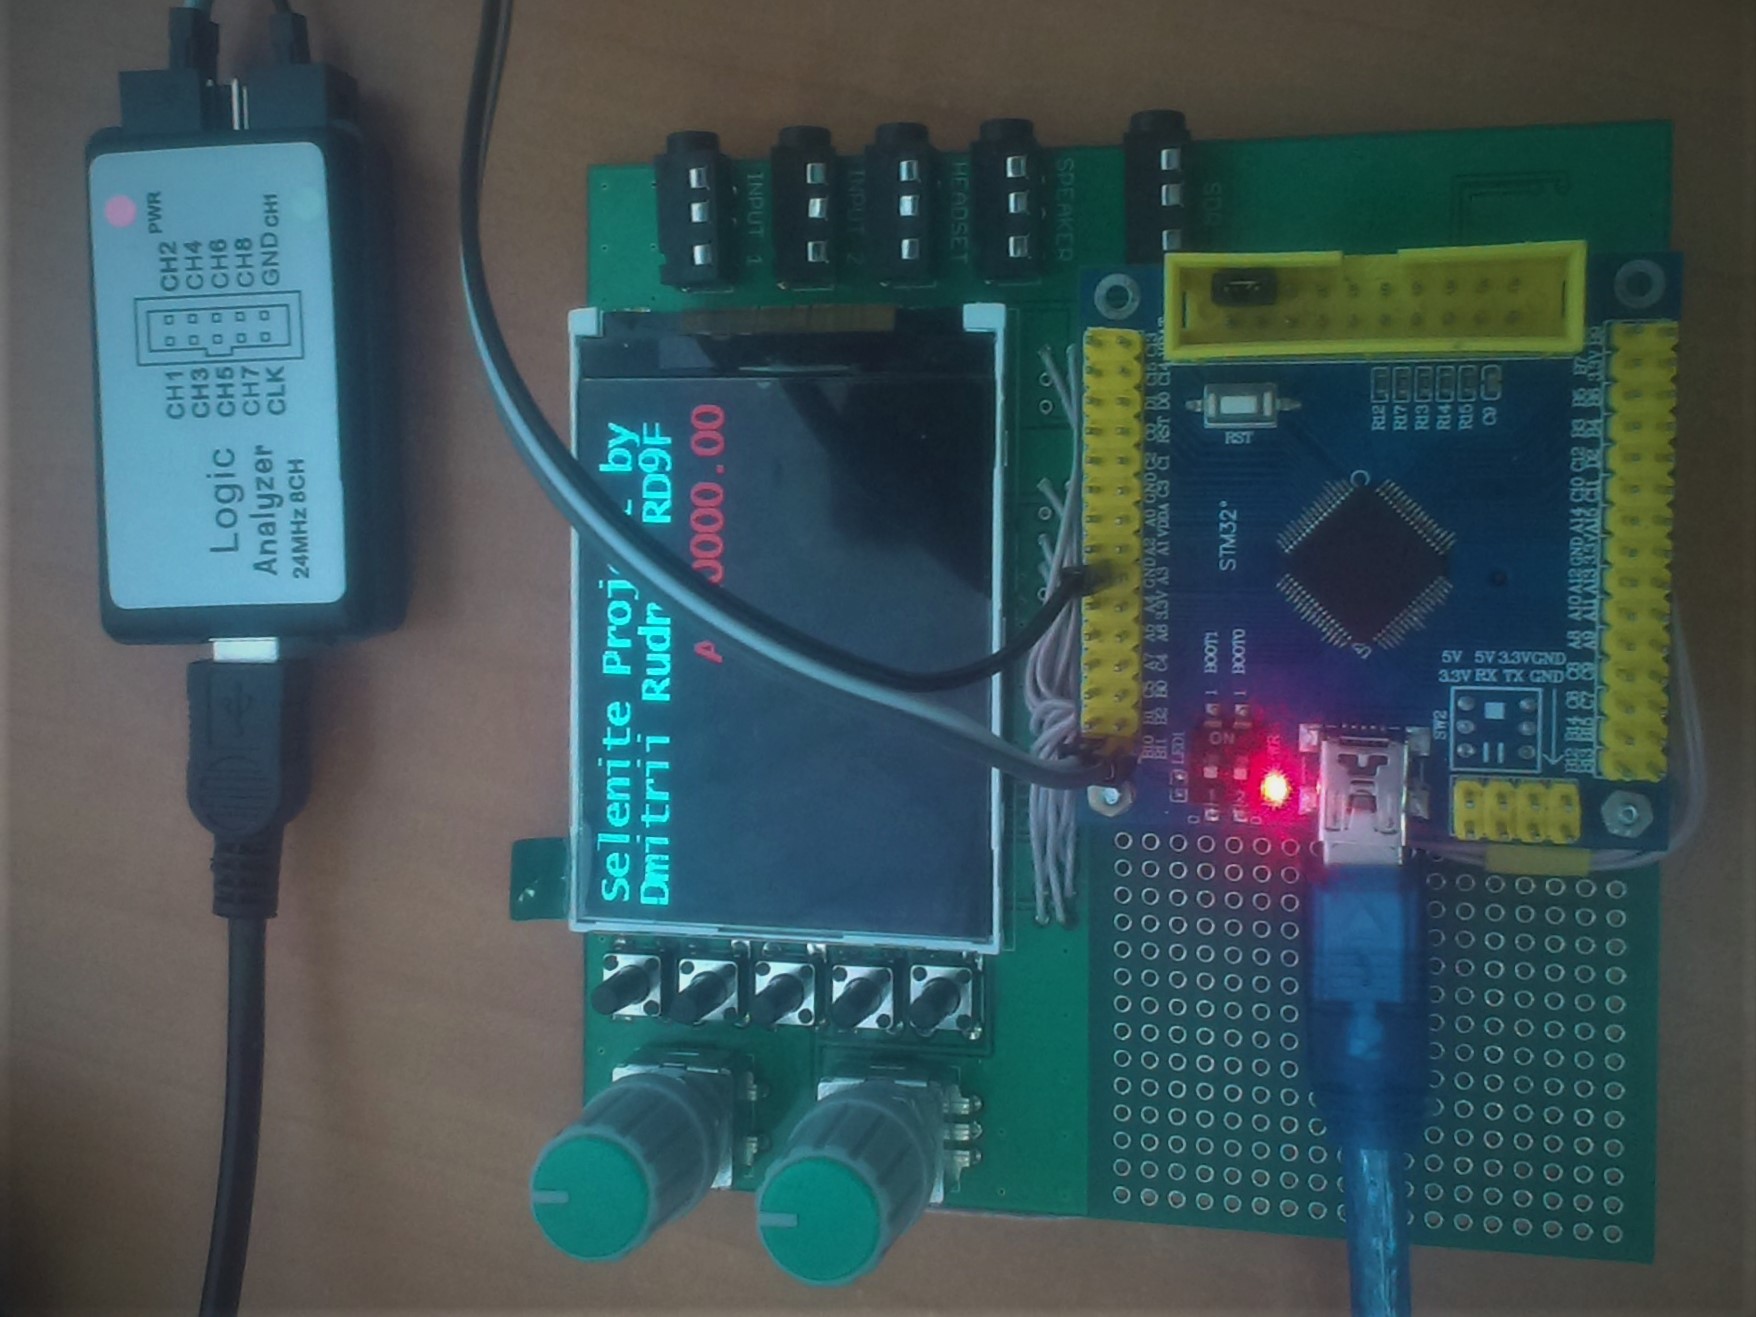
After that, “dances with a tambourine” began. On Windows 10, only the 32-bit version of PulseView was launched. The presence of inexpensive Chinese clone Saleae Logic in the system (price on the seller’s website is $ 7) was not determined.
After that, the WinUSB drivers were installed for the Logic device in Zadig , and after re-scanning it was defined in Zadig as a fx2latw device :
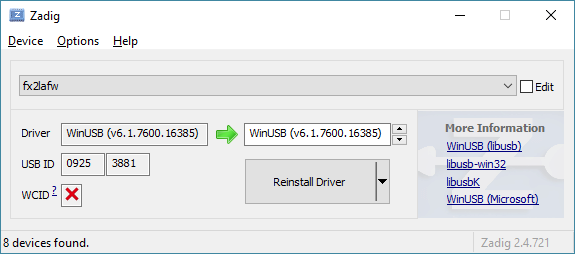
After that, for the fx2latw deviceWinUSB drivers were installed again in Zadig, and only after that PulseView saw the “Saleae Logic” device in the list. The device has been connected.
After connecting the device, the following program settings were made (from left to right in the toolbar, starting with the inscription “Saleae Logic”):
- Pre-trigger capture ratio = 2% is set by pressing a button with a key and a screwdriver;
- extra inputs are disabled at the touch of a button with a red probe;
- set the recording volume to 100 K samples;
- sampling frequency 24 MHz is set;
- I2C protocol analyzer is enabled by pressing a button with a yellow-green icon.
Further in the panel to the left of the channels:
- Channels are assigned text labels corresponding to signals;
- trigger condition assigned to the falling edge of the SDA signal;
- I2C signals are assigned to the appropriate channels.
After switching on the tested equipment, the Run button was pressed. The result is already familiar:
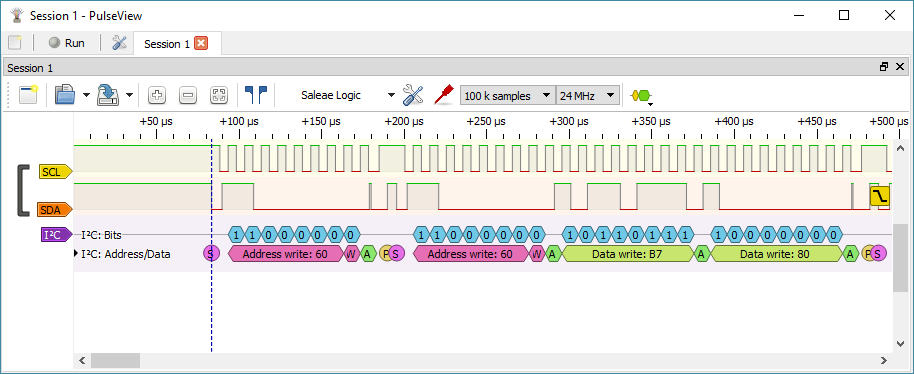
It seems that “dancing with a tambourine” was worth it!
UPD : After manual installation of the libusb-win32 driver in the Device Manager for the USB Logic device, the PulseView program began to stably detect the presence in the Saleae Logic system without any manipulations with Zadig.
Brief conclusions:
The article described the method of analyzing I2C bus signals using a digital oscilloscope with memory and logic analyzers with application software packages.
A universal method of analyzing signals, but not cheap and slow, is the use of a digital oscilloscope with memory.
A quick and cost-effective method of analyzing signals, but with the non-trivial task of connecting equipment, is the use of an inexpensive logic analyzer clone in conjunction with PulseView.
I would be glad if my publication helped save readers time and money.
In the next publication I will tell you how I measured the frequency at which the quartz resonator started in the frequency synthesizer, without a frequency meter. But that's another story…
