Monitoring RabbitMQ in Zabbix and the hidden features of Zabbix key
Introduction
Faced with the task of monitoring a large number of metrics in the RabbitMQ cluster, there was a desire to create a universal parser for JSON data. The task was complicated by the fact that metrics appear and disappear dynamically during cluster operation, plus developers constantly want to collect / count something new. Unfortunately, in Zabbix there is no way to collect data in this form from the box. But there is such a convenient feature as zabbix_trapper, which allows you to do flexible customization. This article will discuss the non-standard way of using the zabbix_trapper items. I didn’t want every time the developers ask me to add new metrics, change the script that collects data and sends it to the zabbix. From here came the idea of using the zabbix key itself as an instruction for collecting a new metric. The bottom line is, we use zabbix key as a command, with a predefined syntax. That is, the zabbix key in this case will serve as an instruction similar to keys of the zabbix_agent type.
According to official Zabbix documentation, item key has some restrictions on valid characters. Having played a little with creating keys of the zabbix type, trapper found that, for example, a key of the form:
some.thing.here [one: two: three] [foo = x, bar = y]
are created in the zabbix without errors. That is, the restrictions only work on the fact that outside the [] brackets, there must also be at least one [az] [AZ] character in front of the brackets. Having the ability to create such keys, we can come up with our own key syntax and program quite flexible logic in it. Then it remains only to write a handler for the invented syntax that will do all the main work. And finally, by writing a dock on this handler and putting the code in the public, the whole Zabbix community will have the opportunity to exchange such “like” plug-ins.
In general, the article turned out to be a little difficult to understand, so in order to better understand the concept, I would advise you to first familiarize yourself with the RabbitMQ API, at least just look at how the data looks and what the API provides (see off site).
Links to the code are provided at the end of the article.
How it works
First, we create in Zabbix front-end items of type zabbix_trapper according to the syntax developed (the syntax will be described below). Next, run the handler (rmq_data_collect.pl - hereinafter collector) in the crown with the frequency of information collection, say 1 minute. Now the collector communicates with Zabbix Server and RabbitMQ server as indicated in the diagram:
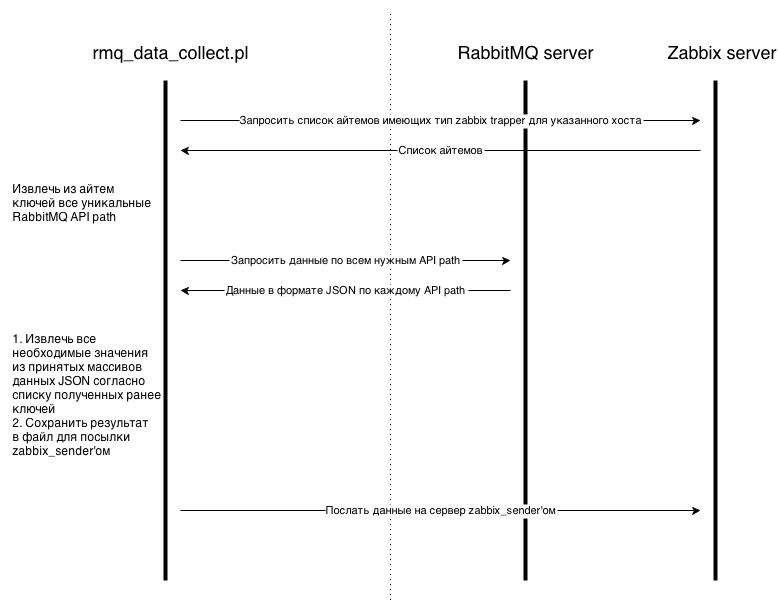
Ie the script takes 3 main steps:
1) Requests a list of items from the Zabbix server to be collected.
2) It takes all the necessary data from RabbitMQ according to the list of items above.
3) Sends all the collected data to the Zabbix server / proxy to the corresponding items.
At the first communication, the handler can interact both through the Zabbix API and directly with the database. In my implementation, the interaction occurs with the Zabbix proxy base. This approach is more convenient when using distributed monitoring with a certain number of Zabbix proxy servers. In this case, the script must be installed on the zabbix proxy server, and the data for connecting to the database of the same proxy must be registered in the script configuration.
In addition to the handler, we will also consider another discoverer, which is used for low level discovery. Next, we will talk about the current monitoring implementation for RabbitMQ, theory and configuration examples.
What is implemented
The documentation on the RabbitMQ API describes 9 API urls + there is also federation-links, which is set as a separate rebbit plugin. Perhaps there is something else. In the current implementation of my scripts, the following API
paths can be monitored: -nodes
-connections
-queues
-bindings
-federation-links
For my tasks this was enough, if you need some more API paths, you need to add them to map_rmq_elements (see code comments).
Install and configure scripts
To monitor RabbitMQ, you will need to install and configure 2 scripts (Collector and Discoverer) + ZabbixProxyDB.pm. Scripts can be installed both on a Zabbix server and on a proxy, depending on your Zabbix configuration.
Collector
rmq_data_collect.pl - Used to process zabbiks keys and collect data from rabbitmq.
Usage
It has one input parameter
$ 1 - the full name of the RabbitMQ host in Zabbix, if RabbitMQ is not running as a cluster. If rebbit works as a cluster, $ 1 is the common part of the hostname in the cluster, i.e. hostnames in the cluster must be specified by a specific rule. For example, the hostnames in the cluster:
- rmq-host1
- rmq-host2
- rmq-host3
In this case, $ 1 should be “rmq-host". The script will ask Zabbix server / proxy for a list of all hosts with names containing “rmq-host”, after which it will go through this list, requesting the necessary data to the RabbitMQ API. After the first successful response data from any of the hosts will be collected and written to a file for sending by zabbix_sender. At the time of writing, there is a flaw in the code, if more than one host from the RabbitMQ cluster does not respond, then nothing will happen. the SQL query to the database until the only way.
The collective p must be registered in crontab with a frequency equal to the frequency of data collection from rebbit.A list of necessary modules can be found in the script itself.
Discoverer
rmq_data_discover.pl - Used for low-level discovery in Zabbix (low level discovery or LLD).
Usage
It has 3 required input parameters:
$ 1 - full name of the RabbitMQ host in Zabbix, if RabbitMQ is not running as a cluster. For a cluster, the principle is the same as for a collector. After the first successful response, the list will stop and compilation of the message for low level discovery will begin.
$ 2 - regexp by which metrics will be selected at the moment the script runs. Not to be confused with the regexp filter on the Zabbix side in the LLD settings. Such a separation is convenient in some cases.
$ 3 - RabbitMQ API path, any of the list of supported ones (see p. What is implemented).
The script must be installed in the externalscripts folder specified in the Zabbix proxy / server configuration. Examples of setting LLD rules are given at the end of the article.
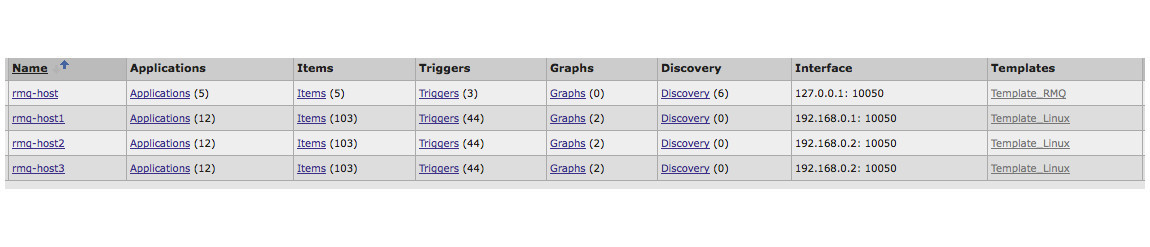
Example Host Configuration in Zabbix
There is a rabbitmq cluster consisting of three hosts. Hosts themselves are individually monitored by zabbix agents, Template_Linux template, which contains standard metrics for CPU, memory, etc. A separate host ”rmq-host” has been created for cluster metrics. The host name for the entire cluster is the common part of the host names in the cluster. This is a prerequisite in the current implementation, otherwise the selection from the database will not work correctly.
Key Syntax
Now let's talk about the syntax I developed for rebbit. As mentioned above, in Zabbix, items must be of type zabbix trapper.
To monitor rebits, there are two types of items, simple and aggregated; their syntax is slightly different. Simple items are used to fetch individual parameter values. Aggregated items are used to select an array of values according to a given condition and to aggregate them. In both cases, the conditions may not be specified (optional).
Simple Values
Syntax :
$ type - it can be the name VHOST or “general”, in the case of VHOST, the values will be searched for by the specified VHOST, “general” is the keyword needed for values that are not specific to VHOSTs.
$ api_path - RabbitMQ API path, any of the supported ones (see p. What is implemented).
$ element_name is the unique identifier of the array element in the specified $ api_path, for federation-links it is exchange, for bindings it is destination, for the rest name.
Aggregated Values
General syntax:
aggregated - is a keyword after which the collector (rmq_data_collect.pl) understands that the key syntax should be parsed as for a value of type aggregated.
$ api_path - the path to the API, any of the supported ones (see p. What is implemented).
$ func - 2 functions are implemented, sum and count.
$ conditions - an optional parameter, if specified, then only those elements in the data array that fit the condition will be taken into account during aggregation. The syntax of the conditions is as follows: [condition1 = “cond1”, condition2 = “cond2”, condition3 = “cond3”, etc]. Quotation marks are required. The condition itself is a Perl regexp.
Sum function
Syntax:
The sum function sums the values at the specified path
function
Syntax: rmq [aggregated: $ api_path: count] [$ conditions]
The count function counts the number of elements in the array obtained by $ api_path that match the condition.
rmq - is a required word, but is not used in any way (there can be absolutely any set of letters). This is due to Zabbix restrictions on an item key of type “zabbix_trapper” - an item cannot start with a square bracket.
Examples
Aggregated values
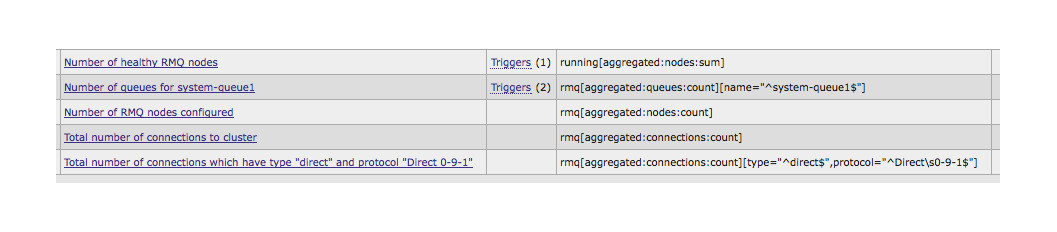
1) Counts the sum of the running elements in the nodes array. Note: If rabbitmq the node is working, running returns 1, respectively, at the output we get the number of working nodes.
2) Counts the number of elements in the queues array, where name = ^ system-queue1 $. Because the value of the condition is always considered as regexp; it is necessary to set the beginning and end of the line (^ $) in order to avoid an error if something else falls under regexp. At the output, we get the number of queues with the name system-queues1
3) Counts the total number of elements in the nodes array. Those. number of configured nodes in the claseter.
4) Counts the total number of elements in the connections array. Those. number of connections to the cluster at the moment.
5) Counts the number of elements in the connections array for which type = “^ direct $” and protocol = ”^ Direct \ s0-9-1 $”.
Examples for simple values are provided later in LLD. Because setting them statically is not convenient; most queues constantly appear and disappear.
Low level discovery
In the case of a large rabbitmq cluster configuration, it would be wise to use low-level Zabbix discovery. Using rmq_data_discover.pl is described above. Here I will give examples and values returned by the script.
The value returned by the script and which can be used in LLD:
Connections
"{#VHOST}" => $ vhost,
"{#NAME}" => $ name,
"{#NODE}" => $ node,
Nodes
"{#NODENAME } "=> $ name,
Bindings
" {#SOURCE} "=> $ queueSource,
" {#VHOST} "=> $ vhost,
" {#DESTINATION} "=> $ queueDest,
" {#THRESHOLD} "=> $ threshold,
Note: all elements with an empty source are ignored.
Federations
“{#VHOST”} => $ vhost,
“{#EXCHANGE} => $ name
LLD Examples
Examples of running rules for each path API:

Examples of prototype items
In the path queues API, we can collect statistics on processed messages without worrying about the number of queues.
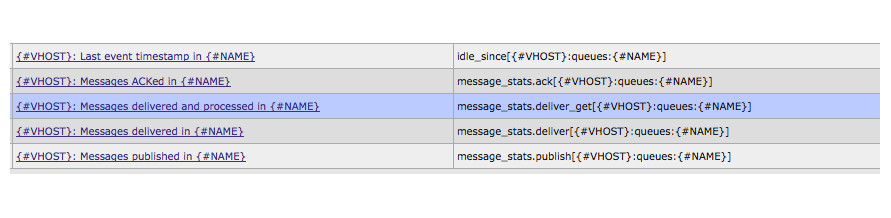
1) The value of the idle_since field. The only field that has processing inside rmq_data_collector.pl. As a result, we get a timestamp from which the queue is inactive.
2) The ack value inside the message_stats element.
3) The remaining values work with message_stats as well as item 2
Example for connections

The item counts the number of elements in the connections array with the given type, protocol for each {#VHOST}.
Example for nodes

1) Counts the number of connections to each node.
2) Returns the value of the running field for each element of the nodes array. The output is the health status of each node.
Summarize
I hope it turned out not too confusing. If something is not clear, I will answer all questions in the comments.
The advantage of the described approach in creating custom keys specialized for a particular software is obvious. There is no need to change the code of Zabbix itself. Already now we can create such plugins, write documentation on them and exchange ready-made solutions on the Internet. If we further develop the idea of creating customized keys in Zabbix, then ideally I would like to see this, possibly in the form of a new feature. Having a similar plugin now, when you need to add some new RabbitMQ metric, you just need to create the appropriate item, as is done for zabbix_agent.
Script code here: github.com/mfocuz/zabbix_plugins