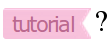
Portrait of Habra-tutorial
In our age, only useless things are necessary for man. Oscar Wilde, Portrait of Dorian Gray ( source )
Have you ever wondered how a regular post on the Habré (regular TM powder ) differs from tutorial? And how can this “differ” be measured at all? Are there any patterns here and is it possible to predict the label:
In this article we will discuss the so-called exploratory data analysis or briefly EDA ( research data analysis ) in relation to Habrahabr articles, and in particular, we will pay special attention to tutorial. First of all, EDA is aimed at a detailed study of data, and is necessary to understand what we are actually working with. An important part is the collection and cleaning of data and the choice of which data to collect. A feature of the method is the visualization and search for important characteristics and trends.
Exploratory data analysis is the first step in the study and understanding of data, without it we can drive ourselves into the many traps described earlier by the author in the article: " How to Lie Using Statistics ".
What does a regular habr-tutorial look like
As a simple demonstration, we consider the simplest picture of three parameters: views, favorites (favorites) and rating (the number of pluses), for three classes: all articles together, regular post (non-tutorial) and tutorial.

Even in such a simplified picture, the difference between the classes is noticeable. Our intuition and common sense tells us that on average tutorials are often added to favorites, but intuition does not say how often, and that they gain fewer pluses and views. We will consider these and many other interesting questions later in the article.
Article structure
- What does a regular habr-tutorial look like
- Collecting data
- Habra data
- Exploring tutorials
- We analyze interesting examples
- Predict tutorial label
- How to make a data set better
- Conclusion
- Further reading
Collecting data
One of the most important properties of research and experiment is its reproducibility and transparency. Therefore, it is incredibly important to provide all the source materials that come with the work - data, an algorithm for their collection, a counting algorithm, implementation, visualization, and output characteristics. All code, data and scripts for analysis and visualization are attached to this article - they are available through github . Separate links are given for graphs and scripts, the most important and interesting parts of the code are also available in the article in the form of a drop-down text (“spoilers”).
This allows you to check the authenticity of the data, visualization and the correctness of the calculations. For example, the original image histogram in the beginning of the article is made with a script histograms_into.Ron the all.csv dataset (a description is given below).
Let's start with a high-level description of the algorithm for collecting data on Haber-articles.

We simply go through each link and parsing a page sequentially.
One of the possible implementations of enumerating articles by id (as well as collecting articles from the best) is given here, the whole algorithm consists of three components: enumeration of pages of articles (shown above as a pseudo-code), parsing of a page (
processPage) and recording (class) of Habr article ( habra-article ).Python enumeration implementation
from __future__ import print_function
import time
from habraPageParser import HabraPageParser
from article import HabraArticle
class HabraPageGenerator:
  @staticmethod
  def generatePages(rooturl):
    articles = []
    suffix = "page"
    for i in range(1,101):
      if i > 1:
        url = rooturl+suffix+str(i)
      else:
        url = rooturl
      print(url)
      pageArticles = HabraPageParser.parse(url)
      if pageArticles is not None:
        articles = articles + pageArticles
      else:
        break
    return articles
  @staticmethod
  def generateTops():
    WEEK_URL    = 'http://habrahabr.ru/posts/top/weekly/'
    MONTH_URL   = 'http://habrahabr.ru/posts/top/monthly/'
    ALLTIME_URL = 'http://habrahabr.ru/posts/top/alltime/'
    articles = []
    articles = articles + HabraPageGenerator.generatePages(ALLTIME_URL)
    articles = articles + HabraPageGenerator.generatePages(MONTH_URL)
    articles = articles + HabraPageGenerator.generatePages(WEEK_URL)
    return articles
  @staticmethod
  def generateDataset(dataset_name):
    FIRST_TUTORIAL = 152563
    LAST_INDEX     = 219000
    BASE_URL       = 'http://habrahabr.ru/post/'
    logname  = "log-test-alive.txt"
    logfile  = open(logname, "w")
    datafile = HabraArticle.init_file(dataset_name)
    print("generate all pages", file=logfile)
    print(time.strftime("%H:%M:%S"), file=logfile)
    logfile.flush()
    for postIndex in range(FIRST_TUTORIAL, LAST_INDEX):
      url = BASE_URL + str(postIndex)
      print("test: "+url, file=logfile)
      try:
        article = HabraPageParser.parse(url)
        if article:
          print("alive: "+url, file=logfile)
          assert(len(article) == 1)
          article[0].write_to_file(datafile)
      except:
        continue
      logfile.flush()
    logfile.close()
    datafile.close()
Code habra-article :
Habra article class implementation
from __future__ import print_function
class HabraArticle:
  def __init__(self,post_id,title,author,score,views,favors,isTutorial):
    self.post_id = post_id
    self.title   = title
    self.author  = author
    self.score   = score
    self.views   = views
    self.favors  = favors
    if isTutorial:
      self.isTutorial = 1
    else:
      self.isTutorial = 0
  def printall(self):
    print("id: ",         self.post_id )
    print("title: ",      self.title)
    print("author: ",     self.author  )
    print("score: ",      self.score   )
    print("views: ",      self.views   )
    print("favors: ",     self.favors  )
    print("isTutorial: ", self.isTutorial)
  def get_csv_line(self):
    return self.post_id+","+self.title+","+self.author+","+ self.score+","+self.views+","+self.favors+","+str(self.isTutorial) +"\n"
  @staticmethod
  def printCSVHeader():
    return "id, title, author, score, views, favors, isTutorial"
  @staticmethod
  def init_file(filename):
    datafile = open(filename, 'w')
    datafile.close()
    datafile = open(filename, 'a')
    print(HabraArticle.printCSVHeader(), file=datafile)
    return datafile
  def write_to_file(self,datafile):
    csv_line = self.get_csv_line()
    datafile.write(csv_line.encode('utf-8'))
    datafile.flush()
Code (beautifulsoup) functions
processPage::processPage
import urllib2
from bs4 import BeautifulSoup
import re
from article import HabraArticle
class HabraPageParser:
  @staticmethod
  def parse(url):
    try:
      response = urllib2.urlopen(url)
    except urllib2.HTTPError, err:
      if err.code == 404:
        return None
      else:
        raise
    html = response.read().decode("utf-8")
    soup = BeautifulSoup(html)
   #print(soup.decode('utf-8'))
    #if the post is closed, return None
    cyrillicPostIsClosed = '\xd0\xa5\xd0\xb0\xd0\xb1\xd1\x80\xd0\xb0\xd1\x85\xd0\xb0\xd0\xb1\xd1\x80 \xe2\x80\x94 \xd0\x94\xd0\xbe\xd1\x81\xd1\x82\xd1\x83\xd0\xbf \xd0\xba \xd1\x81\xd1\x82\xd1\x80\xd0\xb0\xd0\xbd\xd0\xb8\xd1\x86\xd0\xb5 \xd0\xbe\xd0\xb3\xd1\x80\xd0\xb0\xd0\xbd\xd0\xb8\xd1\x87\xd0\xb5\xd0\xbd'
    if soup.title.text == cyrillicPostIsClosed.decode('utf-8'):
      return None
    articles = soup.find_all(class_="post shortcuts_item")
    habraArticles = []
    for article in articles:
      isScoreShown = article.find(class_="mark positive ")
      #if the score is published already, then article is in, otherwise we go on to next one
      if not isScoreShown:
        continue
      post_id  = article["id"]
      author   = article.find(class_="author")
      if author:
        author = author.a.text
      title    = article.find(class_="post_title").text
      score    = article.find(class_="score"     ).text
      views    = article.find(class_="pageviews" ).text
      favors   = article.find(class_="favs_count").text
      tutorial = article.find(class_="flag flag_tutorial")
      #we need to escape the symbols in the title, it might contain commas
      title    = re.sub(r',', " comma ", title)
      #if something went wrong skip this article
      if not post_id or not author or not title:
        return None
      habraArticle = HabraArticle(post_id,title,author,score,views,favors,tutorial)
      habraArticles.append(habraArticle)
    return habraArticles

(obtained by using the script scale_id.R on the first 6.5k points of the alive_test_id.csv dataset )
You need to read the graph as follows: take 250 consecutive id values and write them on the line, if the page is live, we mark it in red, otherwise blue. Take the next 250 values and write them on the next line, etc.
The actual density of live links since the publication of the first tutorial (September 27, 2012) is 23%. If we assume that id is issued sequentially for each draft, three fourth of the habr-articles are either hidden or have not been added.
But (!) Most likely the real density is underestimated in measurements. This is due to a lack of a method for collecting articles: problems with linking, parsing of pages or short-term inaccessibility of a habrahab. A manual check of the data showed (on all.csv) that in a small number of cases <= 5-10%, real-life pages were not processed. Given this error, it is rational to assume that the actual density lies in the range of 30 + -5%. We will work on reducing the error in the next series.
Additional data
In addition to enumerating all articles by id (for the specified period), the following data was also collected:
- Best of all time
- Best of the month
- Best of the week
For the collection, the algorithm described above was actually used, which bypassed the links:
habrahabr.ru/posts/top/alltime/page $ i
habrahabr.ru/posts/top/monthly/page $ i
habrahabr.ru/posts/top/weekly/page $ i
for $ i from 1 to 100
Habra data
The collected data is stored in csv ( comma separated values ) format and has the following form:
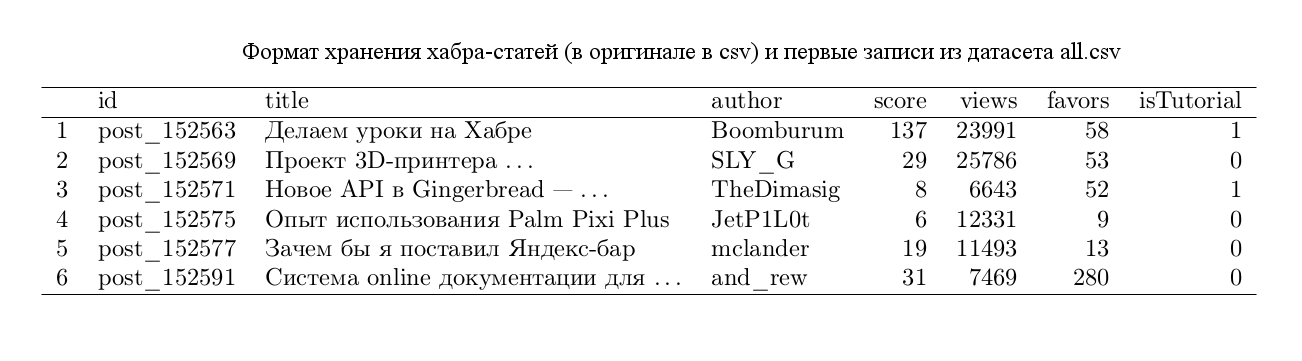
In total, datasets are available along with the article (downloaded April 7, 2014):
- All articles: all.csv
- Best of all time: dataset_top_all_time.csv
- Best of the month: habra_dataset_monthly.csv
- Best of the week: habra_dataset_weekly.csv
- Live pages log by id: alive_test_id.csv
All graphs and results presented in the article are based on the above data. Mostly we will work with the all.csv file.
Exploring tutorials
Consider the distribution of articles by the main collected parameters separately for two classes: tutorial and regular post (non-tutorial). On the Y axis, the proportion of articles that have values for the corresponding parameter on the X axis. We have three main parameters: views, favorites and the number of entries in favorites.

(obtained using the histograms_tutorial_vs_normal.R script on all.csv )
If you always waited for a convenient moment to read about Zipf’s Law , then it has arrived. On the right, we see something well reminiscent of this distribution (and I think we will see it more than once in the future).
In general, we see that the distribution of votes (pluses) and views in the tutorial is shifted to the left - relative to the distributions of ordinary posts and also resembles Zipf's law, although it is noticeable that the correspondence here is not so obvious. So on average, regular posts gain more pluses and views. And the distribution of favorites is already significantly shifted to the right of the tutorial and does not at all resemble Zipf's law. On average, we see that readers are more actively adding tutorial to their favorites. In almost the entire distribution, tutorial dominates over ordinary posts twice, we present a short table of quantiles of two distributions:

The table is read as follows: if the 20% -quantile of a regular post is 16, this means that 20% of all posts of regular posts collect no more than 16 entries to favorites. The median is a 50% quantile, for tutorial it is 109, and for regular posts 49.
It is also worth considering the distribution of parameters together. From the graphs above, we see that favorites play a special role for educational material and therefore we will pay special attention to them in the article.

(Obtained using the script joint_favours_score_view.R on all.csv )
From the graph above you can see the general trend in the data among tutorials, on one plus there are on average several favorites, the median ratio for tutorials is 2.6 times higher than a regular post, and on one view there are on average (median) 2.7 times more favorites than at a regular post.
This allows us to outline the area of interest to us, where most of the training material without labels is most likely to be located - blue dots in the upper border of the red area. We can generate queries to our data and verify this conjecture. And it’s possible to derive some rules that will allow us to automatically “correct” or remind authors of this label.
(The tails of the distributions are cut off on the graphs; a very small number of points fall outside the specified boundaries. But the inclusion of these points would increase the scale and make the remaining points virtually indistinguishable and unreadable.)
We analyze interesting examples
In this part, we will talk about some typical examples that are found in the data and which will help us better understand the existing potential patterns in the articles and their properties.
Many favorites - few pluses
Inquiry:

R language query
query1 <- subset(data, favors > 1000 & score < 50 & isTutorial == FALSE)
Result:

As we can see, the first article is pure, untagged training material, and the second can also claim to be teaching material. We can notice the following trend from the graphs above: all distributions show that on average a tutorial is gaining fewer pluses and much more favorites than a regular article. Together with the fact that a large number of tutorials for some reason do not have a tag, we assume that an article with a small number of pluses and a large number of favorite entries, according to general data trends, has good chances of being a training material.
Favorites are 10 times more than pluses (and at least 25 pluses)
Inquiry:

R language query
query2 <- subset(data, favors > 10*score & score > 25)
Result:

A slightly complicated version of the previous query, we are looking for articles where the favorites are ten times more than the pluses and the number of pluses is at least 25. In such conditions, we find articles that have saved a large number of people, which can serve as some indicator of that the article will be useful in the future, which means it is a good candidate for training material.
The minus of this request is that half of the tutorial is gaining 18 or less pluses, which means that this rule cuts off a large number of potential tutorial articles.
Script with queries.R queries , dataset all.csv .
Predict tutorial label
The tutorial label in the article corresponds to the binary attribute isTutorial. So we can formulate the task of defining a tutorial label by score , view, and favorites parameters , like searching for some predicate (a function that returns 1 or 0) f such that for the entire data set it is true that

(the author admits that he now simplifies everything significantly and generally actively waves his hands - but this should give the general reader what needs to be done)
In fact, classical machine learning methods (such as SVM, Random Forest, Recursive Trees, etc) will not show qualitative results on the collected data for the following reasons:
- Incredibly poor feature space i.e. there are only three parameters that do not distinguish tutorial well from a regular post - this is described below
- A significant number of articles are not marked as tutorial, but in fact they are - see the first request and article: “Configuring Nginx + LAMP server at home” is a classic tutorial, but it is marked as a regular post!
- The subjectivity of the label itself, the presence and / or its absence is largely determined solely by the author’s opinion
What can we do in this situation? Based on existing data, we can try to derive some sufficient conditions and see their feasibility on existing data. If the rules match the data, then by induction we can create some rule that would allow us to find and mark up the tutorial without a label. Simple, interpretable and tasteful.
For example, the following rule is in good agreement with the data and allows you to revise some labels (given solely for the sake of example):

and the first entries in the response:

R language query
query3 <- subset(data, favors >= 10*score, favors >= views/100)
As you can see, despite the fact that most entries do not have a tutorial label, the articles are actually them (despite the small score values in the first 6 entries; although more than half of the tutorial have less than 18 pluses). Thus, we can conduct the so-called co-training , that is, for a small amount of data with labels, derive rules that allow us to mark up the remaining data and create conditions for the application of classical machine learning methods.
But no matter how smart training algorithms we apply, the most important problem in the classification of tutorial is the proper construction of the attribute space, i.e. mapping an article into a certain vector of numerical or nominative (having a series of finite values, for example, the color may be blue, red or green) variables.
How to make a data set better
The collected data set is far from ideal, so it’s best to start criticizing it yourself before others have done it. Of course, by only one parameters, views, rating, favorites cannot be unambiguously predicted whether this article is a tutorial or not. However, we need to get a rule, or rather a classifier, that would work quite accurately. To do this, consider a few more typical features of articles that may come in handy.
Consider the first example:

What catches the eye is that in many tutorial, there are images, often in large quantities - yes, they can also be found in regular posts, but this can be a valuable attribute in combination with other parameters. Also, do not neglect the fact that many hubs are thematically much better suited for educational material than others - perhaps this is also worth considering.
Consider the second example:

Here, the most important is the presence of code and structure, it is natural to assume that these factors can well discriminate between classes and that means, in principle, they can be taken into account in the model. We can also introduce such a parameter as the availability of training materials among similar posts.
Hypothetically, this would give us a new dataset (and a new parameter space for classification) that could better distinguish between article classes.

The space of features for classification can actually be huge: the number of comments, the presence of video, keywords in the title and many others. The choice of space is key to building a successful classifier.
Why you should use the current slice of articles
Why not use all available articles from Habr for assessment? Wouldn't that increase the accuracy of the classifier? Why do we take only the current slice? The width of the window, in fact, should also be selected reasonably and this may require additional analysis.
But you cannot take a sample of all the articles in general for the entire period of the resource’s existence for the following reason: the resource is constantly evolving and the characteristics of the articles change accordingly: if we consider the very first articles eg 171 , 2120 , 18709- we will see that their characteristics change significantly and they should no longer be included in a representative sample of modern articles, because on average we do not expect such parameters for new articles. Largely because the audience has changed, the articles themselves have changed and the distribution channels of articles on the Internet have changed.
Conclusion
We examined and analyzed the most basic parameters of the article's Habr. The idea that the “tutorial” label can be automatically predicted has led us to understand how to expand data sets and in which direction it is worth looking. We also looked at the main differences between regular posts and training material in terms of views, favorites, and rating. They revealed that the main difference is the presence of substantially large entries in the favorites and set numerical estimates of this difference.
Only 2.8% in the top have the label “teaching material”, with a total share of 9.1% for the entire time since its introduction (September 27, 2012), this is possibly due to the fact that a sufficient amount of material came to the top before the label or the use of the “tutorial” label has not yet come into use immediately after its introduction. In favor of this hypothesis, he says that the total share of tutorial in the best for the week and month is practically no different from the share among all posts (8.1% per month and 7.8% per week; relativeFractionOfTutorials.R ).
Perhaps using an extended dataset, we can predict quite effectively (using various machine learning methods) and tell the author: “You may have forgotten the tutorial label.” This task will be primarily interesting because it will allow you to compile a complete list with a selection of interesting training material that you can sort or evaluate by parameters other than pluses, for example, the number of people who add this article to your favorites.
Further reading
If the topic of data analysis seemed interesting, then below is a list of useful material
- Udacity - Exploratory Data Analysis and Data Science
- Caltech - Learning from Data
- Coursera - Data Science Track (just started!)
- If you live in St. Petersburg, then you can take courses at DMLabs
- If you live in Moscow, then you probably already heard about SHAD