Debugging Asynchronous JavaScript Using Chrome DevTools
- Transfer
Introduction
The ability to work asynchronously using callback functions (hereinafter simply returned functions) is a distinctive feature of JavaScript. Using asynchronous return functions allows you to write event-oriented code, but it also adds a lot of problems, because the code stops running in a linear sequence.
Fortunately, now in Chrome Canary DevTools you can track the entire stack of asynchronous function calls in JavaScript!

A small presentation of the stack of asynchronous calls.
Once you enable support for the asynchronous function call stack in DevTools, you can get detailed information about the status of your web application at any time. Walk around the full execution stack of your event handlers, setInterval, setTimeout, XMLHttpRequest, promises, requestAnimationFrame, MutationObservers and so on.
Besides the fact that you can view the call stack, you can also analyze the values of any variables at any time during the execution of functions. It is like a time machine for observing expressions.
Let's turn on support for this functionality and go over several scenarios.
Enabling Asynchronous Code Debugging Support in Chrome Canary
Try the new functionality by enabling its support in Chrome Canary (build 35 and higher). Open the Sources page in Chrome Canary DevTools.
The Async checkbox is located on the panel next to the Call Stack panel on the right side. Depending on the position of this checkbox, the ability to debug asynchronous functions will be turned on or off (although once you turn it on, most likely you will never want to turn it off).

Interception of pending events and XHR responses
You may have already seen this before in Gmail:

If an error occurs in sending the request (there are problems on the server side or problems with the connection from the client side), Gmail will try to forward the message to a small amount of time.
To demonstrate how a stack of asynchronous calls can help us analyze pending events and XHR responses, I recreated the situation described above with an example of a Gmail stub . All JavaScript example code can be found at the link above. The algorithm of his work is as follows:

In the diagram above, the methods highlighted in blue are the main places to apply the new features of DevTools, since these methods are executed asynchronously.
Looking only at the Call Stack panel in previous versions of DevTools, the breakpoint in the postOnFail () function will give you just a little information about where the postOnFail () function was called. Now let's take a look at the difference with the case when we are working with the debugging feature of asynchronous calls turned on:
| Before | After |
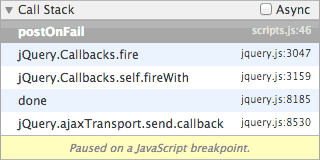 | 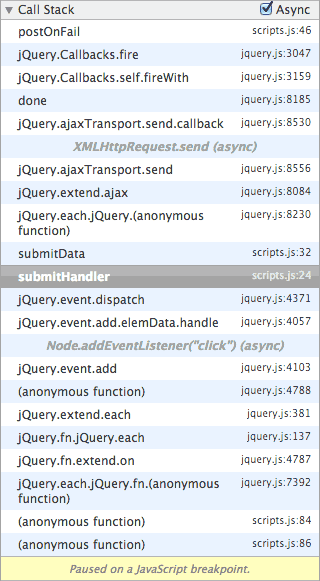 |
| The call stack panel without supporting asynchronous requests. Here you can see that the call to the postOnFail () function came from the returned AJAX function, but nothing more. | Call Stack Panel with Asynchronous Request Support Here you can see that XHR was called from submitHandler (), which was called by the click event handler declared in scripts.js. Cool! |
By using the asynchronous call stack, we can easily view all call chains. For example, we can determine if the call to submitHandler () was initiated as described above, or through retrySubmit () as described below:
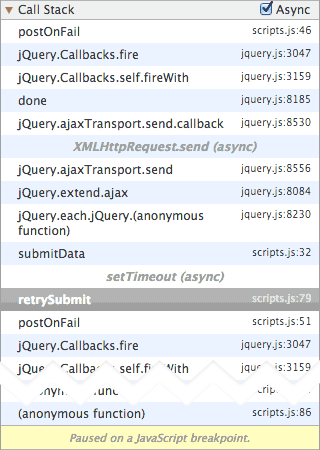
Using the call stack panel, you can also tell whether a UI event (for example, a click), a setTimeout () delay, or an asynchronous return function worked, caused a breakpoint.
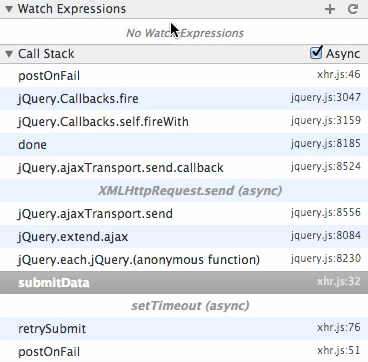
Watch expressions asynchronously
When you view your call stack, your expressions added to the tracking will be updated to reflect the state they were in at a given point in time!
Execute code from previous states
In addition to simply observing expressions, you can also interact with your code from previous states directly in the DevTools JavaScript console.
Imagine that you are Dr. Who, and you need a little help comparing the hours you had before in Tardis and now. From the DevTools console, you can easily execute, save and perform calculations on values from different execution points.

Use the JavaScript console to debug the asynchronous call stack of your code.
The above example can be found here.
Remaining in DevTools to manipulate your expressions, you save time, which would take you to return to the previous code states, make changes, and refresh the browser page.
On the way: Debugging promise chains (promise)
If in the last Gmail example it was hard for you to unravel the stack of asynchronous calls without the new DevTools feature, then you can probably imagine how much harder it will be to do with more complex asynchronous queues, for example, with a promise chain? Let's go over the last example from Jake Archibald ’s Promises Training in JavaScript .

JavaScript promise flowchart
Here's a little animation of working with the call stack in Jake's best asynchronous example :
Before:

The call stack panel without supporting asynchronous debugging
Notice how little information the call stack panel provides when we debug promises.
After:

Call stack panel with support for asynchronous debugging
Wow, what promises! A huge number of returned functions.
Note:
Promise support for the call stack will be ready very soon, as soon as the implementation of the promises has evolved from the Blink version to the final version in V8.
In the spirit of going back in time, if you want to look at asynchronous call stacks for promises today, you can use versions of Chrome 33 or Chrome 34 . Go to chrome: // flags / # enable-devtools-experiments and enable support for experimental DevTools. After rebooting Canary, go to DevTools settings, there will be an opportunity to enable support for asynchronous call stacks .
Diving deeper into web animation
Let's go deeper into the HTML5Rocks archives. Remember Paula Lewis's article “More compact, productive, and faster animations with requestAnimationFrame”?
Open the requestAnimationFrame demo and add a breakpoint at the beginning of the update () method (this is somewhere in line 874) of the post.html file. With an asynchronous call stack, we can plunge deeper into requestAnimationFrame. And, just as in the example with the Gmail stub, we have the opportunity to go back to the start event (this is the scroll event).
| Before | After |
 |  |
Tracking DOM Changes Using MutationObserver
MutationObserver allows us to observe events in the DOM. Consider a simple example: when you click on a button, a new DOM element is added to the block.
Add a new breakpoint in the nodeAdded () function (line 31) in the demo.html file. Using the asynchronous call stack, you can go through the call history back through the addNode () method to the initial click event.
| Before | After |
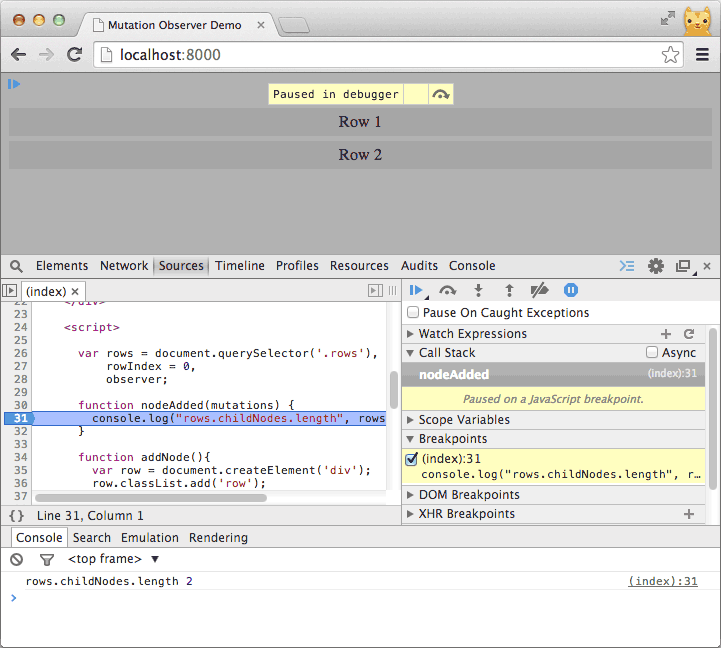 |  |
Notes on debugging JavaScript code using an asynchronous call stack
Name your functions
If you are used to adding all your return functions as anonymous functions, then perhaps you should now reconsider your decision and start giving the functions names that will help you make debugging using the asynchronous call stack even easier.
For example, take an anonymous function:
window.addEventListener('load', function(){
  // do something
});
And give her a name. Let's say windowLoaded ():
window.addEventListener('load', function windowLoaded(){
  // do something
});
When a document loading event occurs, this will be reflected when the stack is displayed using DevTools, where instead of the mystical name "(anonymous function)", the full name of the function will be displayed. This will greatly simplify the readability of the call history, and in most cases will allow you to understand at a glance what is happening there.
| Before | After |
 |  |
What's next
Summarizing all of the above, all of these asynchronous return functions will display a full call stack:
- Timers : Go back until setTimeout () or setInterval () is initialized
- XHRs : Go back to the point where xhr.send () was called
- Animations : Go back until the requestAnimationFrame is called
- Event Handlers : Go back until the handler is installed using addEventListener ()
- Change Observers : Go back to where change events were triggered
Also, the full stack of changes will be available in the near future for the following JavaScript APIs:
- Promises : Go back to the moment where the promise was fulfilled.
- Object.observe : Go back until the return function is attached
The ability to view the entire stack of your return functions should be standing on end your hair. This feature in DevTools will be especially useful when several asynchronous events happen depending on each other, or when an uncaught error message occurs in one of your asynchronous return functions.
Give them a chance in Chrome Canary. If you have something to tell us about this, write to our Chrome DevTools group or send us bugs to our Chrome DevTools bug tracker.