Improving visual quality for document photos
 Recently, users are increasingly receiving images of documents using cameras or mobile devices, resorting to the scanner from time to time, in special cases. At the same time, the following disadvantages are characteristic of images obtained by cameras: geometric distortions (we talked about them in the article about automatic document selection ), uneven lighting (you can often see shadows or highlights when using the flash), a drop in contrast, defocus, blur Digital noise in low light. We will try to get rid of these shortcomings by applying some transformations to the original image in order to bring its view closer to the scanned one.
First of all, we note that a simple increase in contrast relative to the average signal level in most cases does not work, as can be seen in the figure: On the left is the original image, on the right is the result of increasing contrast. It is seen that a more complex algorithm is needed that takes into account the unevenness of lighting. Let's try to make an adaptive increase in contrast relative to the local average value. The local average value is calculated for each pixel within a square neighborhood, the center of which it is. The size of the neighborhood should be selected based on the expected size of the letters and the thickness of the stroke. There are algorithms for quickly calculating local averages, for example, an integrated matrix ( summed area table


) If before increasing the contrast from the local average, subtract the constant corresponding to the estimate of the noise level in the image, then for simple documents the result can be quite satisfactory: On the left is a map of the “thresholds” (brightness levels), relative to which the contrast increases. On the right is the result of the application. You can also increase the contrast relative to the average between the local minimum and maximum. Things get even worse if the document contains flat sections vyvorotki or inverted text, the letters may be different in size several times, and next to the text can be in the photo. This is how the result looks on a complex layout: On the left is the original image, on the right is the result of increasing the contrast.


It can be seen that in photographs a significant part of the images is lost, inverted sections of text, inverts do not look the same as in the original document, large letters have an outline representation without filling. All this creates additional difficulties for the subsequent analysis and recognition of such documents.
The task is to somehow build such a map of “thresholds” with respect to which an increase in contrast would lead to an increase in visual quality, and which would take into account the features of documents with a complex layout. Such a threshold map will also be useful for obtaining a binarized (black and white) image of a document. The binarization process can be considered as a special case when the increase in contrasts in the image tends to infinity.
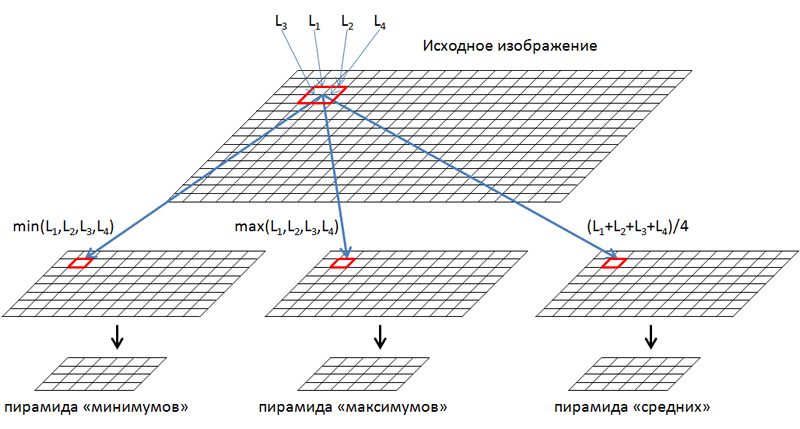
The proposed algorithm allows you to build an acceptable threshold map for complex documents. To take into account objects of different sizes in the image, pyramidal decomposition of the image is used. Schematically, this process is shown in the figure:

Decomposition begins with the scale of the original image. It is divided into disjoint squares 2x2 pixels in size, in each of which we get the minimum, maximum and average of the 4 pixels that make up it. Next, from these values we form three images: minima, maxima and average, which are reduced by 2 times horizontally and vertically relative to the original. We repeat the procedure and lay out the resulting images in pyramids to a level at which the size is still at least 2 pixels horizontally and vertically.
Using the pyramidal decomposition, we obtain the values of minima, maxima, and average values for the initial parts of the image corresponding to different scales of its representation. Typical document images contain 9-12 levels of decomposition.
The algorithm for constructing a threshold map based on a pyramidal decomposition is as follows:
- At the lower level of the pyramidal decomposition, where the image consists of only a few pixels, we initialize the threshold map using either of two hypotheses:
- local average value of this part of the image (i.e. brightness of a pixel from the pyramid of means)
- the average between the local minimum and maximum (brightness average of 2 pixels taken from the pyramids of minima and maxima).
- We proceed to the next level of decomposition, increasing the threshold map 2 times horizontally and vertically using interpolation with convolutions [1 3], [3 1].
- In each pixel at a new level of pyramidal decomposition, we calculate the difference between the pixel value from the pyramid of maxima and the value from the pyramid of minima. If this difference does not exceed the noise threshold, we consider that there is no useful signal in this part of the image, both at this and at subsequent levels of the pyramidal decomposition. Therefore, the threshold value obtained at the previous decomposition level can be left unchanged. Otherwise, we calculate a new, adjusted threshold value based on a mixture of two hypotheses, 1a and 1b.
- We repeat steps 2 and 3 until we reach a level of decomposition at which the image sections corresponding to the pixels in the pyramid still have a size exceeding the smallest letters distinguishable in the image. Typically, such letters have a size of about 6-10 pixels, this corresponds to the 3rd or 4th level of the pyramid.
As a result, we obtain a threshold map, relative to which an increase in contrast does not lead to loss of objects of various sizes, in addition, flat, homogeneous areas in the image do not contain noise: on the left is a threshold map, on the right is the result of an increase in contrast relative to it. It remains to be decided how to deal with color images, since an increase in contrast often leads to color loss. You can increase the contrast for the brightness component (gray image), taking into account areas with saturated color, reducing the coefficient of increase in contrast. We use our own color space, similar to HSL , but instead of the brightness L, we will work with the Y component in the YCbCr color space .


For a gray image, the contrast increases as follows:
Y '= k (Y - T) + T, where T is the brightness value for the same pixel from the threshold map, Y and Y' is the initial and obtained pixel brightness value, k is the contrast increase coefficient, usually its value lies in the range from 3 to 6.
For pixels for which the saturation S is high, we will often get the wrong color, since the range of acceptable values for color components is limited. Therefore, for a color image, the coefficient k in this formula must be made inversely proportional to the color saturation. Additional normalization coefficients are easy to select empirically.
For areas with low saturation, you can, on the contrary, reduce color saturation down to 0, suppressing color noise in the image. This is easy to do by mixing values from color channels with brightness in various proportions. It is also useful to increase the contrast of the white balance in the image by histograms of the R, G, B channels. On the left is the original image, on the right is the result of the increase in contrast, taking into account color saturation.


