But you say Ceph ... is it really good?

I love Ceph. I have been working with him for 4 years already (0.80.x -12.2.612.2.5). Sometimes I am so fascinated by him that I spend evenings and nights in his company, and not with my girlfriend. I encountered various problems in this product, and I still live with some of them to this day. Sometimes I was happy about easy decisions, and sometimes I dreamed of meeting with developers to express my indignation. But Ceph is still used in our project and it is possible that it will be used in new tasks, at least by me. In this story, I will share our experience in operating Ceph, in a certain way I will speak on what I do not like about this decision and maybe help those who are just eyeing it. I was pushed into writing this article by events that started about a year ago, when Dell EMC ScaleIO, now known as Dell EMC VxFlex OS, was delivered to our project.
This is by no means an advertisement for Dell EMC or their product! Personally, I'm not very good at big corporations, and black boxes like the VxFlex OS. But as you know, everything in the world is relative and using the example of VxFlex OS it is very convenient to show what Ceph is in terms of operation, and I will try to do it.
Options. It's about 4-digit numbers!
Ceph services such as MON, OSD, etc. have different parameters to configure all subsystems. Parameters are set in a configuration file, demons read them at the time of launch. Some values can be conveniently changed on the fly with the help of the "injection" mechanism, about which just below. Everything is almost super, if you omit the moment that there are hundreds of parameters:
Hammer:
> ceph daemon mon.a config show | wc -l
863
Luminous:
> ceph daemon mon.a config show | wc -l
1401
It turns out ~ 500 new parameters in two years. In general, parametrization is cool, it’s not cool that there are difficulties in understanding 80% of this list. The documentation described in my estimation ~ 20% and sometimes ambiguous. Understanding the meaning of most of the parameters has to be found in the github project or in the mailing lists, but this does not always help.
Here is an example of several parameters that were interesting to me just recently, I found them in the blog of one Ceph-gadfly:
throttler_perf_counter = false  // enable/disable throttler perf counter
osd_enable_op_tracker = false   // enable/disable OSD op tracking
Comments in the code in the spirit of best practices. As if, I understand the words and even about what they are, but what it will give me is not.
Or here: osd_op_threads in Luminous is gone and only the source helped to find a new name: osd_peering_wq threads
I also like the fact that there are especially holivar parameters. Here the dude shows that an increase in rgw_num _rados_handles is good :
and the other dude thinks that> 1 is impossible and even dangerous .
And my most favorite is when beginners give examples of the config in their blog posts, where all parameters are thoughtlessly (I think so) copied from another similar blog, and so a lot of parameters that no one knows except the author of the code roams from config to config.
I’m also burning wildly with what they did in Luminous. There is a super cool feature - changing parameters on the fly, without restarting processes. You can, for example, change the parameter of a specific OSD:
> ceph tell osd.12 injectargs '--filestore_fd_cache_size=512'or put '*' instead of 12 and the value will be changed on all OSD. This is very cool, really. But, like much in Ceph, this is done with the left foot. Bai design not all parameter values can be changed on the fly. More precisely, they can be meshed up and they will appear in the output modified, but in fact, only some of them are re-read and re-applied. For example, you cannot change the size of the thread pool without restarting the process. So that the performer of the team understood that it is useless to change the parameter in this way - they decided to print a message. Is healthy
For example:
> ceph tell mon.* injectargs '--mon_allow_pool_delete=true'
mon.c: injectargs:mon_allow_pool_delete = 'true' (not observed, change may require restart)
mon.a: injectargs:mon_allow_pool_delete = 'true' (not observed, change may require restart)
mon.b: injectargs:mon_allow_pool_delete = 'true' (not observed, change may require restart)
Ambiguous. In fact, the removal of pools becomes possible after injection. That is, this warning is not relevant for this parameter. Ok, but there are still hundreds of parameters, including very useful ones, which also have a warning and there is no possibility to check their actual applicability. At the moment, I can not understand even by code, which parameters are applied after the injection, and which are not. For reliability, you have to restart services and this, you know, infuriates. Enrages because I know that there is an injection mechanism.
How is this with VxFlex OS? Similar processes like MON (in VxFlex are MDM), OSD (SDS in VxFlex) also have configuration files in which there are about a dozen of parameters. True, their names also do not speak about anything, but it is good that we have never resorted to them to burn like with Ceph.
Technical duty
When you begin your acquaintance with Ceph with the most current version for today, everything seems fine, and I want to write a positive article. But when you live with him in the prode from version 0.80, then everything does not look so rosy.
Before Jewel, Ceph processes ran as root. In Jewel, it was decided that they should work from the user 'ceph' and this required a change of ownership of all the directories that are used by Ceph services. It would seem that this? Imagine an OSD that serves a 2 TB magnetic SATA disk with 70% capacity. So, chown such a disk in parallel (to various subdirectories) with full disk utilization takes 3-4 hours. Imagine that you have, for example, 3 hundreds of such disks. Even if you update the nodes (chown'it 8-12 disks at once), you get a rather long update, in which the cluster will have OSD of different versions and less data for one replica at the time of the server output for updating. In general, we thought it was absurd, rebuilt Ceph packages and left OSD to work as root. Decided that as OSD is introduced or replaced we will transfer them to a new user. Now we are changing 2-3 disks per month and adding 1-2, I think we can handle it by 2022).
CRUSH Tunables
CRUSH is the heart of Ceph, everything revolves around it. This is an algorithm by which, in a pseudo-random manner, the location of the data is selected and thanks to which clients working with the RADOS cluster will know on which OSD the data (objects) they need is stored. The key CRUSH feature is that there is no need for any metadata servers, such as Luster or IBM GPFS (now Spectrum Scale). CRUSH allows clients and OSD to interact with each other directly. Although, of course, it is difficult to compare the primitive object storage of RADOS and file systems, which I cited as an example, but I think the idea is clear.
In turn, CRUSH tunables is a set of parameters / flags that affect the operation of CRUSH, making it more efficient, at least in theory.
So, when upgrading from Hammer to Jewel (test naturally), a warning appeared, that the profile tunables has parameters that are not optimal for the current version (Jewel) and it is recommended to switch the profile to optimal. In general, everything is clear. The dock says that this is very important and this is the right way, but it also says that after switching the data there will be a rebelance of 10% of the data. 10% - it does not sound scary, but we decided to test. For a cluster, about 10 times less than what was sold, with the same number of PGs per OSD filled with test data, we received a rebelance of 60%! Imagine, for example, with 100TB of data, 60TB begin to move between OSDs and this with a constantly going client load demanding latency! If I haven’t said yet, we provide s3 and even at night the load on rgw is not particularly reduced, which are now 8 and 4 more under static sites (static websites). In general, we decided that this was not our way, all the more so to make such a rebelance on the new version, which we hadn’t been working with, was at least too optimistic. In addition, we had large bucket indices, which are very badly experiencing rebelance, and this was also the reason for the delay in switching the profile. About indexes will be separately slightly lower. In the end, we just removed the warning and decided to return to this later.
And when switching the profile in testing, we fell off cephfs-clients that are in CentOS 7.2 cores, since they could not work with the newer hashing algorithm that came with the new profile. We do not use cephfs in the sale, but if used, this would be another reason not to switch the profile.
By the way, the dock says that if what does not happen during rebelance does not suit you, then you can roll back the profile. In fact, after a clean installation of the Hammer version and an update to Jewel, the profile looks like this:
> ceph osd crush show-tunables
{
    ...
    "straw_calc_version": 1,
    "allowed_bucket_algs": 22,
    "profile": "unknown",
    "optimal_tunables": 0,
    ...
}
It is important that it is "unknown" and if you try to stop the rebelance by switching it to "legacy" (as stated in the dock) or even to "hammer", the rebelance will not stop, it will simply continue in accordance with other tunables, and not " optimal. " In general, everything needs to be thoroughly checked and rechecked, ceph no confidence.
CRUSH trade-of
As you know, everything in this world is balanced and there are disadvantages attached to all the advantages. The disadvantage of CRUSH is that PGs are spread over different OSD unevenly, even with the same weight of the latter. Plus, nothing prevents different PGs from growing at different speeds, it’s like a hash function. Specifically, we have an OSD utilization range of 48-84%, despite the fact that they have the same size and, accordingly, weight. Even we try to make servers equal in weight, but this is so, just our perfectionism, no more. And the fig with the fact that IO is distributed unevenly across disks, the worst thing is that when full (95%) reaches at least one OSD in a cluster, the entire recording stops and the cluster goes into readonly. The whole cluster! And it does not matter that the cluster is still full of space. Everything, final, we leave! This is an architectural feature of CRUSH. Imagine you are on vacation, some kind of OSD has broken the 85% mark (the first warning is the default), and you have 10% in stock to prevent the recording from stopping. And 10% with an active recording is not so much / long. Ideally, with this design, Ceph needs a person on duty who is able to execute the prepared instruction in such cases.
So, we decided to unbalance the data in the cluster, because several OSD were close to the nearfull-mark (85%).
There are several ways:
- Add discs
The easiest, slightly wasteful and not very effective, because the data itself may not move from a crowded OSD or the movement will be insignificant.
- Change permanent weight OSD (WEIGHT)
This leads to a change in the weight of all higher-level buckets (CRUSH terminology) in the hierarchy, OSD server, data center, etc. and, as a result, to the movement of data, including not from those OSD from which it is necessary.
We tried, reduced the weight of one OSD, after the rebelance of the data was filled with another, lowered it, then the third, and we realized that we would be playing this way for a long time.
- Change non-permanent weight OSD (REWEIGHT)
This is what is done when calling 'ceph osd reweight-by-utilization'. This leads to a change in the so-called adjustment weight OSD and at the same time the weight of the higher-level buckets does not change. As a result, the data balances between different OSD of the same server, as it were, without going beyond the CRUSH. We really liked this approach, we saw in the dry-run what the changes would be and performed on the sale. Everything was fine until the rebelance process had a stake around the middle. Again, googling, reading mailings, experimenting with different options, and in the end it turns out that the stop is caused by the lack of some tunables in the profile mentioned above. Again we caught up with technical debt. As a result, we took the path of adding disks and the most inefficient rebelance. Fortunately, we still had to do it because
Yes, we know about the balancer (Luminous and above) included in mgr, which is designed to solve the problem of uneven distribution of data by moving the PG between OSD, for example, at night. But I have not heard yet positive reviews about his work, even in the current Mimic.
You will probably say that technical debt is a purely our problem and I, perhaps, will agree. But for four years with Ceph, we had only one downtime s3 recorded in the prode, which lasted a whole 1 hour. And then, the problem was not in RADOS, but in the RGW, which typed their default 100 threads hung tight and most users did not execute queries. It was still on the Hammer. In my opinion, this is a good indicator and it is achieved due to the fact that we do not make sudden movements and are rather skeptical about everything in Ceph.
Wild gc
As you know, deleting data directly from the disk is a fairly resource-intensive task and in advanced systems deletion is done pending or not done at all. Ceph is also an advanced system and in the case of the RGW, when deleting an s3 object, the corresponding RADOS objects are not immediately removed from the disk. RGW marks s3-objects as deleted, and a separate gc-stream is engaged in deleting objects directly from RADOS pools and, respectively, from disks is postponed. After updating to Luminous, the gc behavior changed noticeably, it began to work more aggressively, although the gc parameters remained the same. By the word, noticeably, I mean that we began to see the work of gc on external monitoring of the service on jumping latency. This was accompanied by a high IO in the rgw.gc. pool. But the problem we faced was much more epic than just an IO.
0 <cls> /builddir/build/BUILD/ceph-12.2.5/src/cls/rgw/cls_rgw.cc:3284: gc_iterate_entries end_key=1_01530264199.726582828Where 0 at the beginning is the logging level at which this message is printed. However, logging is nowhere below zero. As a result, ~ 1 GB of logs was generated by one OSD in a couple of hours, and everything would be fine if the ceph nodes were not diskless ... We load the PXE OS directly into memory and do not use a local disk or NFS, NBD for the system partition (/). Stateless-servers turn out. After a reboot, the entire state is rolled by automation. How it works, I will somehow describe in a separate article, now it’s important that under "/" 6 GB of memory is allocated, of which usually ~ 4 is free. We send all logs to Graylog and use a rather aggressive log rotation policy and usually do not experience any problems with disk / RAM overflow. But for this we were not ready, with 12 OSD on the server "/" it was filled very quickly, The duty officers did not react in time to the trigger in Zabbix and OSD just started to stop due to the inability to write the log. As a result, we lowered the intensity of gc, the ticket did not start because it already was, and added a script to cron, in which we do a forced truncate of OSD logs when a certain volume is exceeded without waiting for a logrotate. By the way, logging levelraised .
Placement Groups and vaunted scalability
In my opinion, PG is the most difficult abstraction to understand. PG is needed to make CRUSH more efficient. The main purpose of PG is to group objects to reduce resource consumption, improve performance and scalability. Addressing objects directly, individually, without combining them in PG would be very expensive.
The main problem of PG is the determination of their number for a new pool. From the Ceph blog:
"This is a bit of a black night art nightmare."
It is always very specific to a particular installation and requires lengthy reflection and calculation.
Key recommendations:
- Too many PGs on the OSD are bad, there will be overspending on their maintenance and brakes during rebalance / recovery.
- Few PGs on the OSD are bad, performance will suffer, and the OSD will be filled unevenly.
- The PG number must be a multiple of degree 2. This will help get the "power of CRUSH".
And here I burned. PGs are not limited in size or number of objects. How many resources (in real numbers) do you need to maintain one PG? Does it depend on its size? Does it depend on the number of replicas of this PG? Should I bathe if I have enough memory, fast CPUs and a good network?
And still need to think about the future growth of the cluster. The number of PG can not be reduced - only increase. At the same time, it is not recommended to do this, since this will, in fact, lead to the split of the PG part to new and wild rebelance.
"It is one of the most impactful cases for production clusters, if possible."
Therefore, we need to think about the future immediately, if possible.
Real example.
A cluster of 3 servers with 14x2 TB OSD in each, total 42 OSD. Replica 3, useful space ~ 28 TB. Will be used under S3, you need to calculate the number of PG for the data pool and index pool. RGW uses more pools, but these two are basic.
We go into the PG calculator (there is such a calculator), we consider with the recommended 100 PG on the OSD, we get only 1312 PG. But not everything is so simple: we have an introductory one - the cluster will definitely grow three times over the course of a year, but iron will be purchased a little later. Increase the "Target PGs per OSD" three times, to 300 and we get 4480 PG.
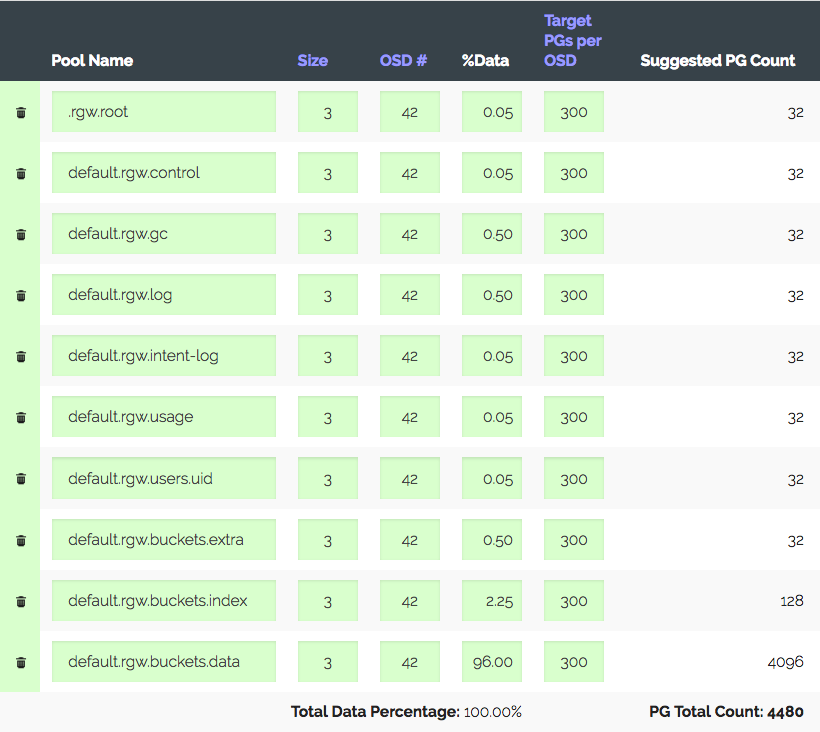
Set the number of PGs for the corresponding pools - we get the warning: too many PG Per OSD ... arrived. Received ~ 300 PG on OSD with a limit of 200 (Luminous). It used to be 300, by the way. And the most interesting is that all unnecessary PGs are not allowed to be peering, that is, it is not just a warning. As a result, we believe that we are doing everything correctly, increasing the limits, turning off the warning and moving on.
Another real-life example is more interesting.
S3, 152 TB of usable volume, 252 OSD at 1.81 TB, ~ 105 PG per OSD. The cluster grew gradually, everything was fine until with the new laws in our country there was no need for growth up to 1 PB, that is + ~ 850 TB, and at the same time it is necessary to preserve the performance, which is now quite good for S3. Suppose we take disks of 6 (5.7 really) TB and taking into account replica 3 we get + 447 OSD. Taking into account the current, 699 OSDs of 37 PG each will be obtained, and if we take into account different weights, then it turns out that the old OSD will have only ten PGs. And you tell me, how far will it work? The performance of a cluster with different numbers of PG is quite difficult to measure synthetically, but the tests that I conducted show that for optimal performance you need from 50 PG to 2 TB OSD. And further growth? Without increasing the number of PGs, you can reach the PG mapping for OSD 1: 1.
Yes, you can create a new pool for the RGW with the desired number of PGs and apply a separate S3 region to it. Or even build a new cluster nearby. But agree that all this crutches. And it turns out that Ceph seems to be well-scalable because of its concept. PG scales with reservations. You will either have to live with disabled vornings in preparation for growth, or at some point rebel all the data in the cluster, or score on performance and live with what you get. Or go through it all.
I am glad that the developers of Ceph understand that PG is a complicated and superfluous abstraction for the user and he shouldn’t know about it.
If you’re in the luminous world, you’re taking it in think about ".
In vxFlex there is no concept of PG or any analogs. You just add the disks to the pool and that's it. And so to 16 PB. Imagine, nothing needs to be counted, there are no heaps of statuses of these PGs, disks are utilized evenly throughout the growth. Because disks are given to vxFlex as a whole (there is no file system on top of them) there is no way to estimate the fullness and there is no such problem at all. I don't even know how to convey to you how nice it is.
"Need to wait for SP1"
Another "success" story. As you know, RADOS is the most primitive repository of key-value. S3, implemented on top of RADOS, is also primitive, but still a bit more functional. For example, in S3, you can get a list of objects by prefix. In order for this to work, the RGW maintains its own index for each batch. This index is one RADOS object that will actually be served by a single OSD. With the growing number of objects in the bucket, the index object grows. According to our observations, starting from several million objects in the bucket, noticeable brakes start when writing to this bucket. The OSD index service object eats a lot of memory and may periodically go down. Brakes are caused by the fact that the index is blocked for every change in order to preserve consistency. In addition, with scrub 'operations Inga or rebelance index object is also blocked for the entire operation. All this periodically leads to the fact that customers get timeouts and 503, the performance of large buckets suffers in principle.
Bucket Index resharding is a mechanism that allows the index to be divided into several parts (RADOS-objects) and, accordingly, decomposed into different OSD, thereby achieving scalability and reducing the impact of service operations.
By the way, it is worth noting that the possibility of manual resarding appeared only in Jewel and was backported to one of the last bug fixes! Hammer assemblies, which shows its high importance because This is not a bug fix. How did big buckets work before?
In Hammer, we had several buckets with 20+ million objects, and we regularly experienced problems with them, we knew the numbers of the cherished OSDs and, according to messages from Graylog, understood what was happening to them. Manual resharing did not suit us, because required an io stop for a particular bake. We needed Luminous, because in it, resharing became automatic and transparent to customers. We updated to Luminous, but didn’t include scoring, tested. Everything looked fine, and we included it in the sale. IO expectedly grew up in the index-pool, the buckets began to shard, I opened the beer bottle and finished the working day early. A day later, we found that IO stably maintained at a high level, with all the problem buckets are deshard. It turned out that the indices are shaded in a circle ... Soon there were tickets; one , two:
It was necessary to disconnect, the blessing problem indexes were already shardirovana. Another item in the treasury of technical debt, because buckets can grow further and the sharding will be needed again not tomorrow, so in a month.
By the way, the update Hammer-> Jewel was fun because of these fat indexes. The OSD holding index punched all timeouts on restart. We had to twist the timeouts of threads directly on the prode so that these cherished OSDs could rise and not kill themselves.
The history of autoresharing is not the only case when a new feature worked in such a way that it would be better if it didn’t work at all. In the Hammer version, there was an s3 feature such as object versioning. It brought us much more harm than good. For many buckets with versioning enabled, gradually, with an increase in the number of objects, objects began to appear with an invalid etag, with a zero body, errors occurred when deleting objects. At that time, we found several open reports with similar problems. We tried in vain to reproduce these problems, spent a lot of time without result. Suspend versioning did not solve the problem. As a result, the “solution” was the creation of new buckets without versioning and the transfer of objects into them. It hit our reputation quite badly and caused inconvenience to our customers, and we spent a lot of resources to help them.
Holivary on the number of replicas
As soon as conversations about the number of replicas come, then immediately replica 2 is idiocy, drug addiction, and in general such a configuration will soon face the fate of Cloudmouse. Yes, if you have Ceph, then maybe.
In vxFlex OS, the replication factor is 2 and this cannot be changed. The only thing you need to have a certain amount of space in reserve for data recovery in case of an accident. This volume must be equal to the disk volume, which can fail at the same time. If you have potentially all the rack can be turned off by power, then you need to reserve the volume of the fattest rack. You can argue about the effectiveness and reliability of such a scheme, but not knowing exactly how it works inside, you can only trust the engineers at Dell EMC.
Performance
Another holivarnaya topic. What is the performance of a distributed storage system, and yes even with network replication? Good question. It is clear that such systems have a large overhead. In my opinion, the performance level of systems like Ceph, vxFlex should be measured in terms of their performance to the performance of the equipment used. It is important to understand how much performance we lose because of the layer used. This metric is also economic, it depends on how much we need to buy disks and servers to achieve the desired absolute values.
A letter dated August 9 from ceph-devel mailings : In short, the guys get servers reclaimed by the CPU (two Xeons per server!) And funny IOPS on the All-NVMe cluster on Ceph 12.2.7 and bluestore.
There are a lot of articles, presentations and discussions in the mailing lists, but Ceph is still “flying” quite low. A few years ago (at the time of Hammer) we tested various solutions for block storage and Ceph was our favorite since we used it as s3 and hoped to use it as a block. Unfortunately, the then ScaleIO trampled on Ceph RBD with astounding results. The main problem we encountered with Ceph is the underused disk and the reused CPU. I remember well our squats with RDMA over InfiniBand, jemalloc and other optimizations. Yes, if you write with 10-20 clients, you can get quite pleasant summary iops, but in the absence of client io parallelism, Ceph is completely bad even on fast disks. vxFlex also manages to dispose of all disks well and demonstrates high performance. Resource consumption is fundamentally different - Ceph has a high system time, and scaleio has a io wait. Yes, then there was no bluestore, but judging by the reports in the ezine, it is not a silver bullet, and besides, even now by the number of bug reports, it seems he is the leader in the Ceph tracker. We chose the then ScaleIO no doubt. Given the metric that was mentioned at the beginning of the section, Ceph would not be economically viable, even taking into account the cost of the Dell EMC licenses.
By the way, if disks of different capacities are used in the cluster, then PG will be distributed depending on their weight. This is a fair distribution in terms of volume (type), but not fair in terms of IO. Due to the smaller number of PGs, small disks will have less IO than large ones, despite the fact that they usually have the same performance. It may be reasonable to overweight the smaller disks at the beginning and lower it when approaching nearfull. So cluster performance may be more balanced, but this is not certain.
In vxFlex there is no concept of a journal or of some kind of cache or tiring, the whole record goes straight to the discs. There is also no pre-disk tuning procedure (I look in the direction of ceph-volume), you just give it a block device for exclusive use, everything is very simple and convenient.
Scrub
Trite, I agree. Through it, probably, everyone who lives with Ceph has passed.
As soon as a lot of data appears in your cluster and its active use begins, it is quite difficult not to notice the effect of the scrub. "A lot of data" in my understanding is not a total amount in a cluster, but the fullness of the disks used. For example, if you have 2 TB disks and they are filled to> 50%, then you have a lot of data in Ceph, even if there are only two disks. We once suffered a lot from the scrub and have been looking for a solution for a long time. Our recipe that works well to this day.
The vxFlex OS also has such a mechanism and by default it is turned off, like almost everything that is not the main functionality. When enabled, you can set only one parameter - bandwidth in kilobytes. It changes on the fly and allows you to choose the optimal value for your cluster. We left the default value and so far so good, even changing the disks periodically after error messages.
By the way, interestingly, vxFlex resolves scrub-error situations itself. Ceph with the same replica 2 requires manual intervention.
Monitoring
Luminous is a landmark release in many ways. In this version, native monitoring tools have finally appeared. Using the built-in MGR-plugin and the official template for Zabbix, you can get basic monitoring with schedules and the most important alerts (3 pieces) in a few steps. There are also plugins for other systems. This is really cool, we use it, but we still need to write our own scripts and templates for monitoring IO in pools to understand when gc is prankish, for example. A separate topic is monitoring RGW instances.

Without him, I'm just like a blind kitten. He also needs to write himself.
And this is a fragment of external monitoring S3, then how clients "see" the service:
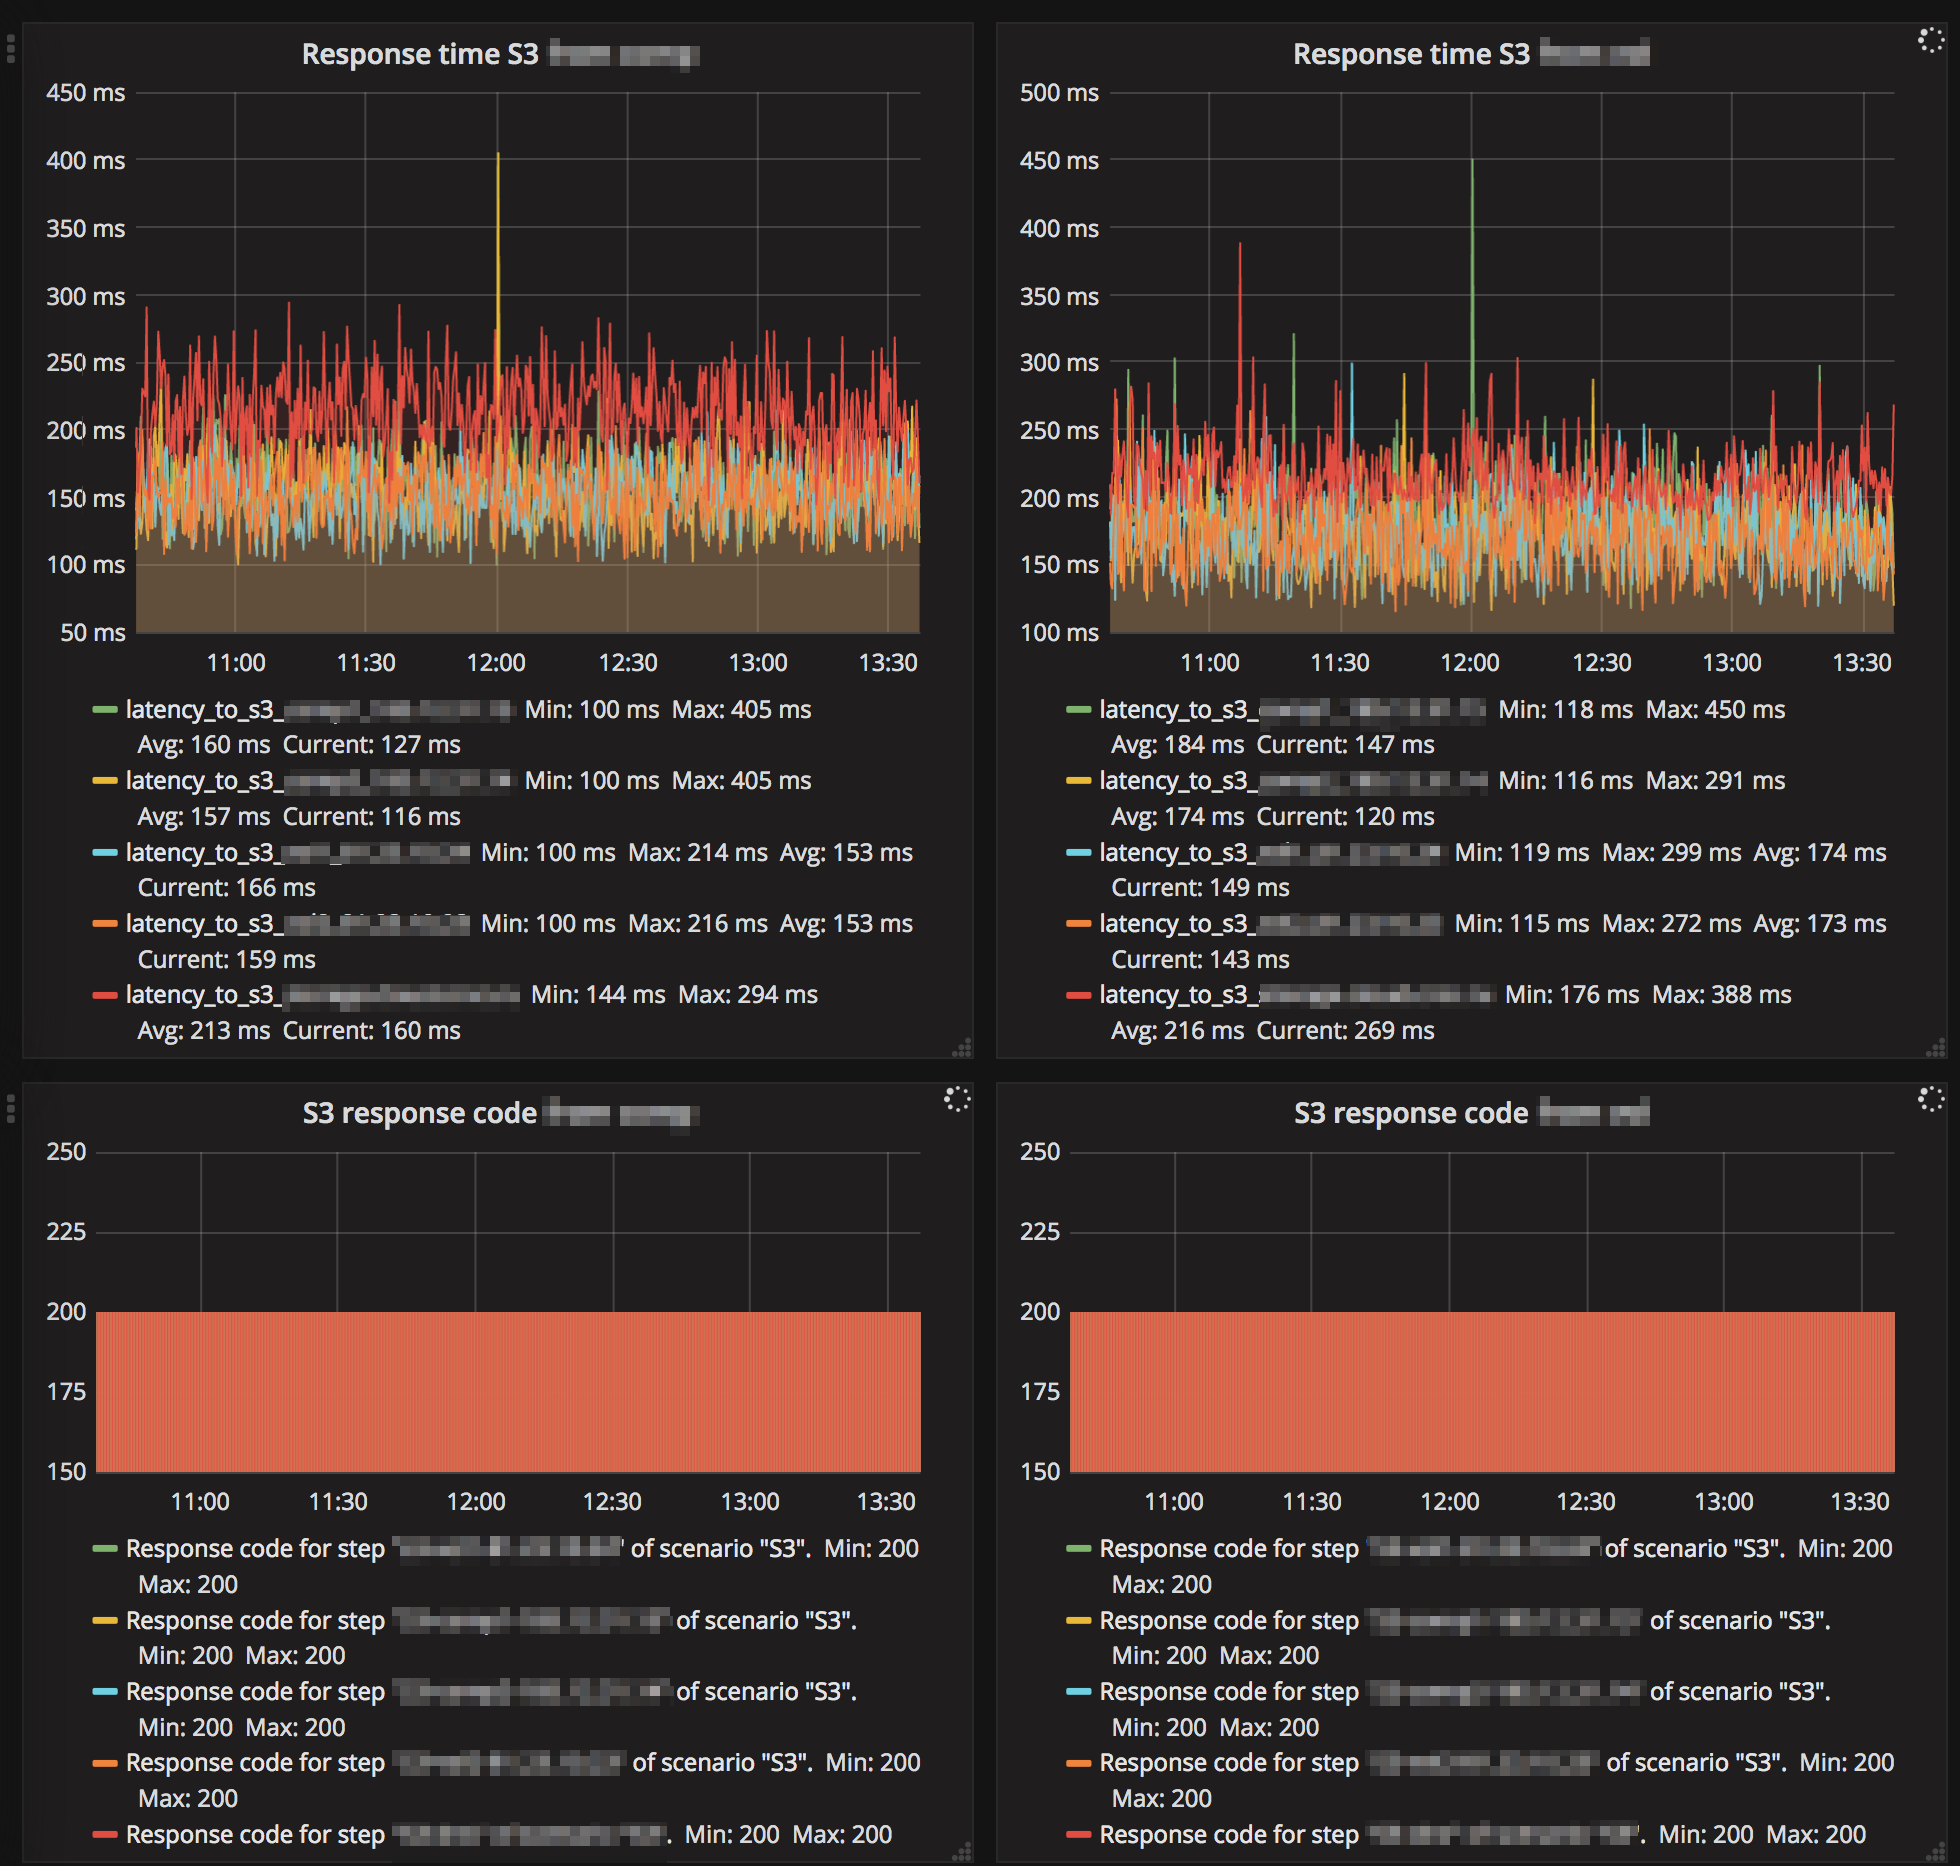
Of course, this monitoring is of no relevance to Ceph itself, but I highly recommend that you start it if it does not already exist.
It is pleasant to note that Ceph monitors can do Graylog using the GELF protocol and we use it. We get alerts, for example, when OSD is down, out, failed and others. When configured to parse messages, we can analyze logs for a period of time, for example, know the top OSD by switching to down for a month, or build a scrabbing intensity graph.
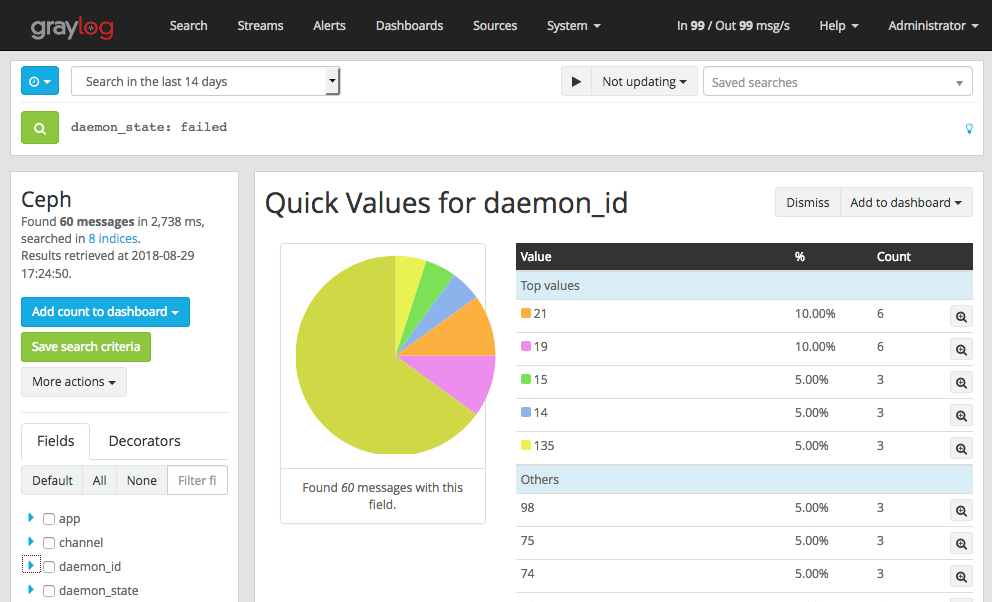
Somehow it was that our OSD hung up and did not have time to respond to heartbeat and their monitors marked as failed (see screen above). The reason was vm.zone_reclaim_mode=1on two-socket servers with NUMA.
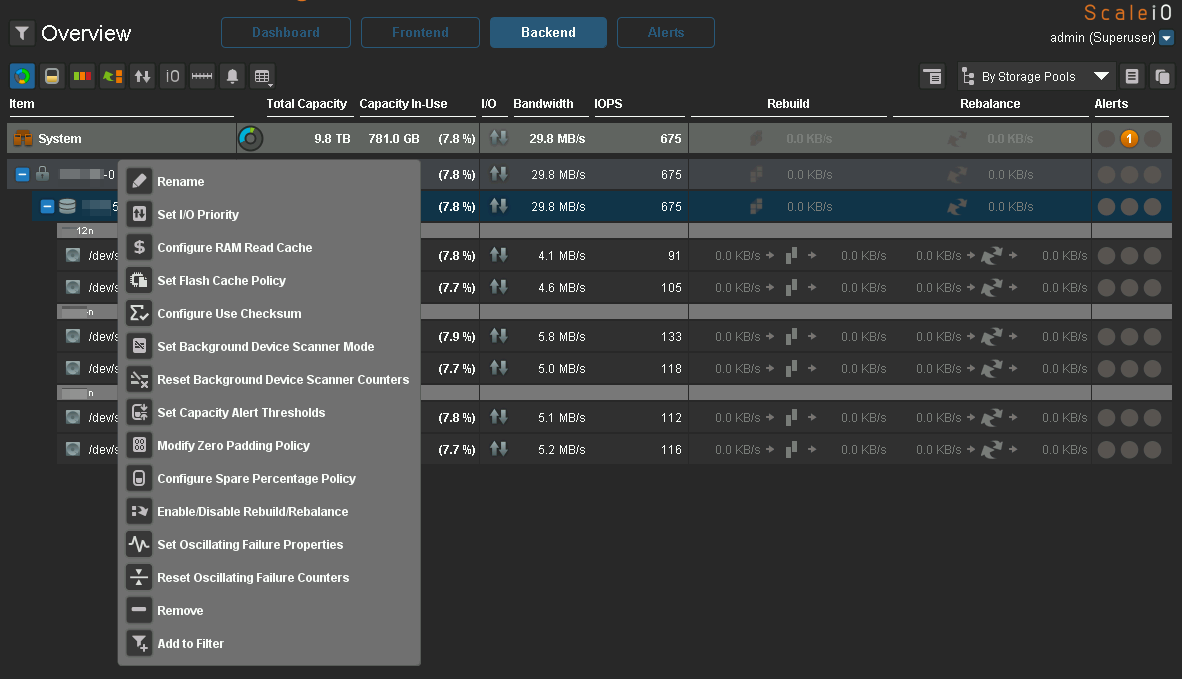
That kind of praise and Ceph. True c vxFlex is also possible. And he also has a very good cheap board:
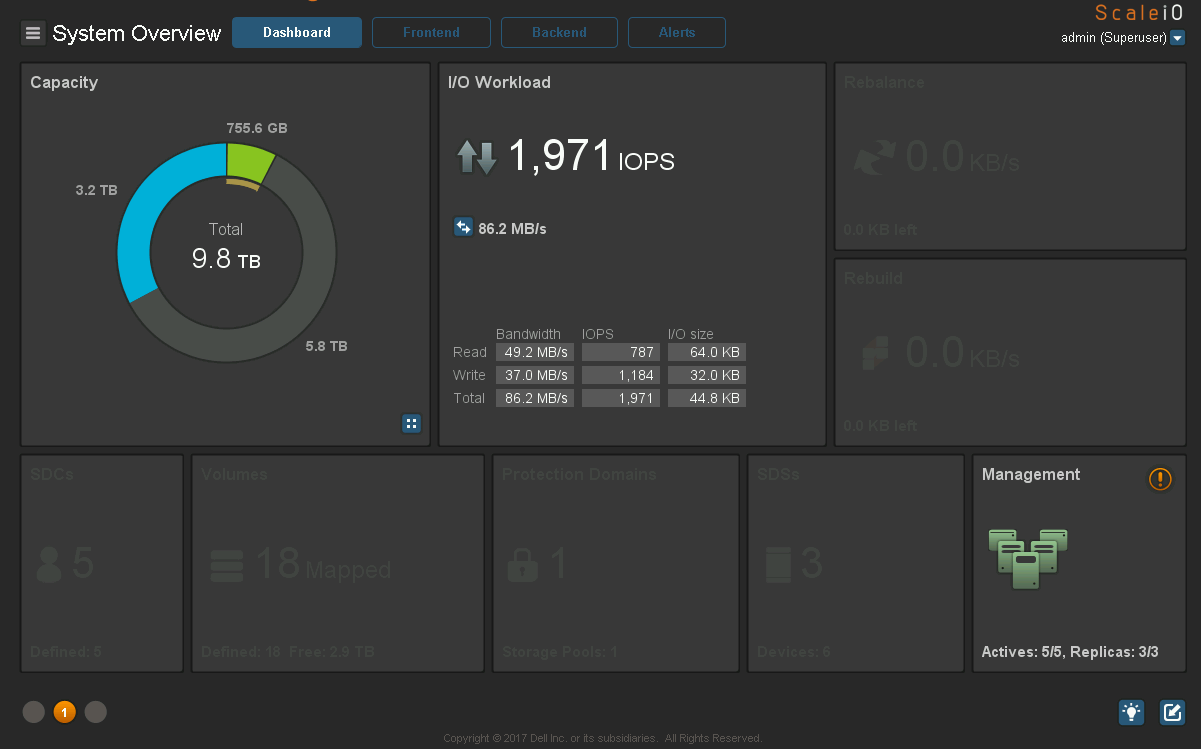
It is clear which client generates the load:

Detailing IO on nodes and disks:
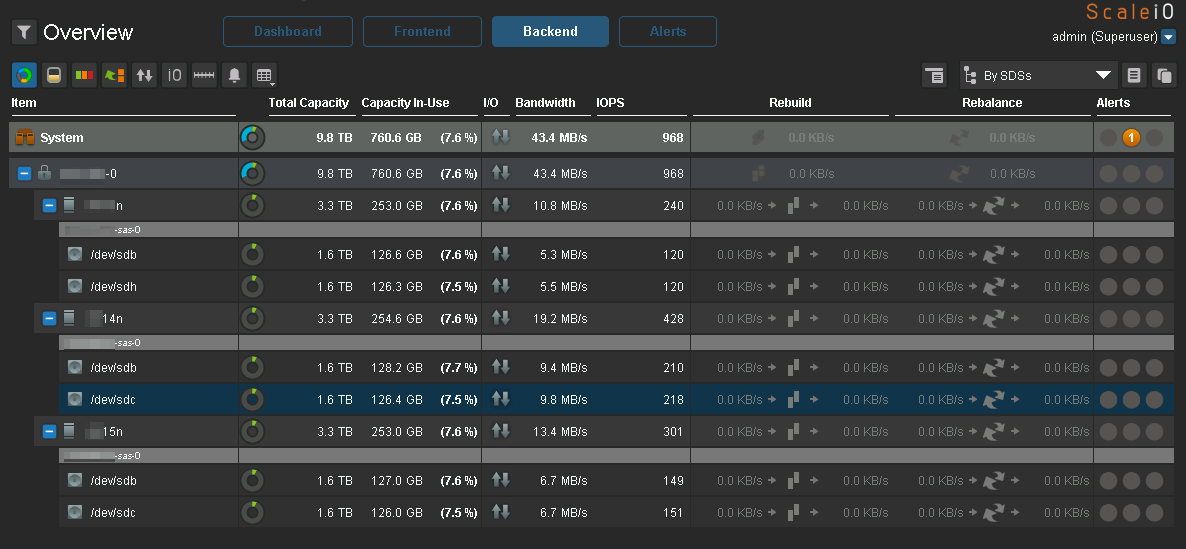
Notice how the disks are evenly filled and how almost evenly IO falls on them, which is what Ceph lacks.
All krutilki at hand:
I will not speak about Ceph, which was delivered to Luminous, on a lowboard. Perhaps in 2.0 that appeared in Mimic will be more interesting, but I have not watched it yet.
vxFlex is also not perfect
When a cluster goes into the Degraded state, for example, when a disk changes or the server restarts, new volum cannot be created.
The vxFlex client - kernel module and support for new kernels from RH appears with a delay. Official support 7.5 yet, for example. In Ceph, clients for RBD and cephfs are modules of the upstream kernel and are updated with the latest update.
vxFlex is poor in features versus Ceph. vxFlex is only a block stack that does not have, for example, a tiring.
You can only grow up to 16 PB, there is such a restriction. With Ceph, you would have enough nerves to 2 PB to grow ...
Conclusion
I often hear that Ceph is an academic project with a bunch of unsolved problems, that it is a framework without documentation, that its gratuity is compensated by its complexity, that building a normal stack on Ceph is a utopia. In general, I agree with everything.
Recently on Habré there was a publication about what Ceph is healthy and that it can be managed by a “regular admin”. After this article, my boss used to tease me, saying "as Sanya, the usual admin can, but you always have R & D, always some problems." I was a little hurt. I do not know what kind of "admins" the guys have there, but Ceph constantly needs the attention of a fairly qualified staff, he is like a living organism, which is sick every now and then.
If you ask me to use Ceph in 2k18 or not, I will answer the following. If your service should work 24/7 and a planned or unplanned stop is unacceptable (public S3, for example, or EBS), and degradation in the service will entail customer resentment and punishment with a ruble, then using Ceph is very, very dangerous. Most likely, you will suffer from time to time. And if productivity is also needed, then it may not be economically profitable. If you are building a repository for the internal needs of the project / company and there is an opportunity to do maintenance with stopping the service or unscrewing for maximum backfilling at the weekend, then you will get along with Ceph and maybe it will add some piquancy to your life.
Why do we continue to use Ceph in the first category? As the saying goes, "from hate to love is one step." So it’s with Ceph. I love because I know. Too much passed with him to take and drop these relationships and the accumulated expertise, especially now, when it seems that everything is under control ...
But you can not relax the rolls!
All HEALTH_OK!