Performance management of sales consultants. KPI Matrix

Most often, sellers' performance is evaluated only by sales volume. Therefore, the seller’s salary usually consists of a salary and a premium depending on revenue. Despite the widespread use of this scheme, it has a number of important disadvantages. The first and main drawback, it does not motivate sellers to use all available opportunities to increase sales. Second, it does not motivate sellers to increase customer loyalty and quality of service. Third - it practically does not motivate sellers to improve their professional level. In this article I will talk about a balanced scorecard (KPI), which allows not only to effectively manage sales, but also to achieve other important goals - to increase customer loyalty, provide training and staff development.
Ask what does this have to do with IT? The most immediate. The success of KPI management depends not only on what is being measured, but also on how it is done. Qualitative (not quantitative) KPIs, based on the subjective assessment of the leader and manual input of the results, “buried” more than one KPI implementation project. Simplicity and manufacturability of KPI measurements are absolutely necessary conditions for success, and they are provided only by the introduction of IT. Today, IT in retail is, as a rule, only cash and accounting systems. The only indicator (KPI) that they can automatically receive is revenue. Therefore, salesperson performance management most often comes down to uploading revenue information to MS Excel.
But you can do it differently, and it practically does not cost. Any IT company (IT service) in the arsenal has many systems that can be effectively used in retail. Service Desk products can be used to manage claims. Network management systems can be used to monitor KPI, etc. But in order to use such tools, you need to understand what business needs. This article is about this, so first a little theory.
KPI Management
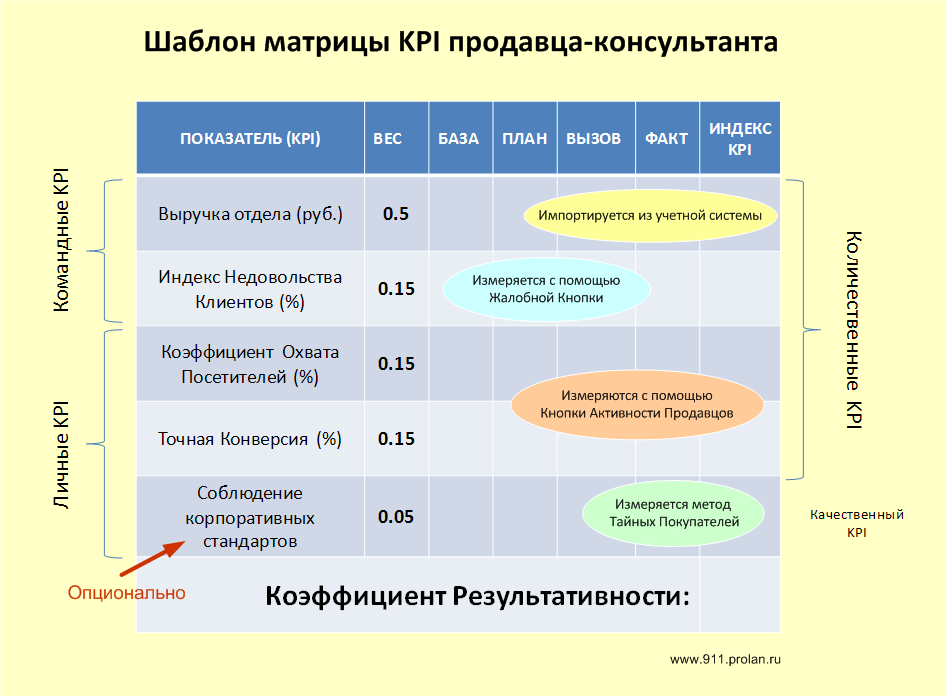
Figure 1. Seller KPI KPI matrix template The KPI
management begins with the creation of a KPI matrix (goal agreement). This is a table (see Figure 1), including personal and team, qualitative and quantitative indicators of performance. For each KPI, it is necessary to establish, firstly, the WEIGHT, depending on the current priorities of the company (the sum of the weights of all indicators should be equal to 1), and secondly, three threshold values characterizing the tasks of the employee for the coming period:
- BASE is the worst allowable KPI value. This is the “zero” point, starting from which the employee’s performance is counted. If the KPI value is below the BASE, then the seller does not correspond to the position.
- PLAN - this is what must be implemented in order for the company to achieve its goals.
- CALL is the highest possible KPI value. If the FACT value is higher than the CALL value, then when calculating the KPI Index, the CALL value is substituted instead of the FACT value. Otherwise, with an error in the installation of the PLAN, it may turn out that it is executed at 1000%
After the reporting period, for example, a month, you need to evaluate the effectiveness of each employee. To do this, for each indicator, you need to measure its actual value (FACT). Then, based on the values of FACT, BASIS, PLAN, CHALLENGE, according to the formulas below, the employee productivity coefficient is calculated.
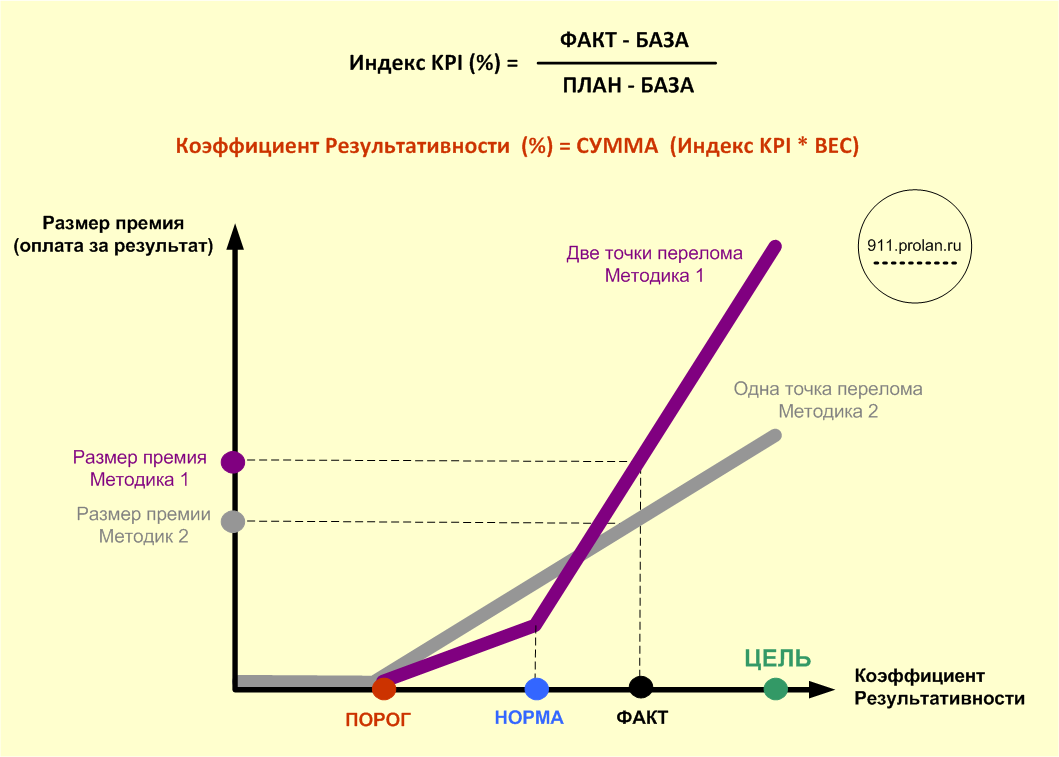
Figure 2. Calculation of the Performance Ratio and methods for calculating the premium.
The coefficient of effectiveness is used to determine the variable part of the remuneration (premium). For this, a methodology should be selected that determines the dependence of the premium on the Performance Ratio. This dependence can be linear or nonlinear, the dependence curve can have one or two break points. In this case, the rule is usually observed that the bonus is accrued only if the Performance Ratio exceeds a certain threshold value (THRESHOLD), for example, 85%.
Thus, KPI management gives the business at least four effective levers of personnel management, namely:
- Indicators Included in the Matrix (KPI);
- KPI weights;
- KPI Thresholds (DATABASE, PLAN, CALL)
- The methodology for calculating the premium depending on the values of the Performance Ratio and its threshold values: THRESHOLD, NORM, GOAL.
But for leverage to work, a number of conditions must be met. The set of indicators should be balanced. Measurement of indicators should be technologically advanced. A business must know how to determine threshold metrics. The reliability of the results should not be in doubt neither the business nor the employees. In retail, these requirements, in my opinion, correspond to the set of indicators shown in Table 1.
| Indicator | Tactical task | Strategic goal | |
|---|---|---|---|
| 1. | Department revenue (rub) | Motivation of sellers to increase the size of the check and the number of positions in the check | Increase market share |
| 2. | Exact Conversion (%) | Motivation of sellers to improve the quality of sales attempts (try to turn each visitor into a buyer) | |
| 3. | Visitor Coverage Rate (%) | Motivation of sellers to increase the number of sales attempts (approach each visitor to the point of sale) | |
| 4. | Customer Dissatisfaction Index (%) | Sales Motivation to Increase Customer Satisfaction | Increase customer loyalty |
| 5. | Compliance with corporate standards (optional) | Motivation of sellers to improve their professional level | Personnel training and development |
Department revenue
The revenue of the department is the value of revenue in monetary terms from the sale of goods, net of value added tax, excise taxes and other obligatory payments. I believe that the team indicator (total revenue of the department) should be included in the KPI matrix, because it improves the psychological climate in the team. Department revenue
measurement can be performed automatically. To do this, it is enough to develop a software module that imports (or uploads) the relevant data from the accounting or cash system into the KPI monitoring system. Usually, the development of such a module takes several hours of programmer's work. The weight of this indicator depends on the current priorities of the company. I think that for most companies the optimal value is 0.5. Department revenue
- this is the only indicator (of those considered in this article) that characterizes the result. All other indicators characterize the process. Stable achievement of the desired results is possible only with the correct organization of the Process. Therefore, the weight of the indicator characterizing the Result should be equal to the total weight of the indicators characterizing the Process.
Typically, the determination of the threshold values of the department’s revenue is based on the analysis of data obtained for the previous period. To do this, you need to analyze not only the previous revenue of the department , but also HOW it was received. To do this, you need to analyze the indicators characterizing the process. For example, if in the previous period the exact conversion and visitor coverage ratewere low, and therefore you developed new scripts and conducted staff training, then in the next period it is advisable to set higher thresholds for the department’s revenue .
Exact Conversion, Visitor Coverage Rate
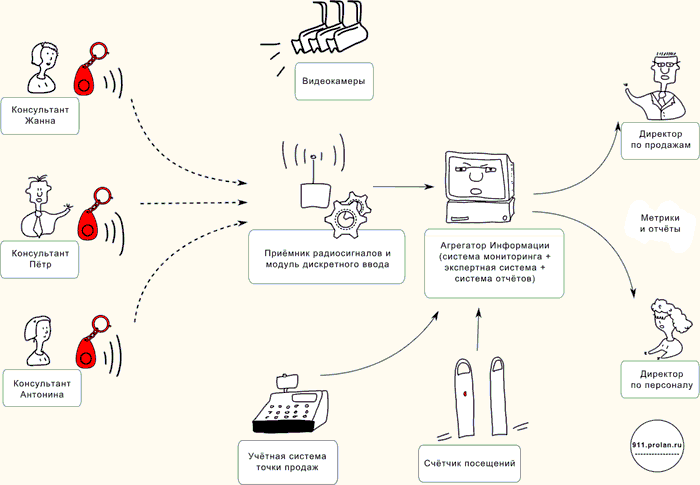
Figure 3. Measuring Accurate Conversion and Visitor Ratio.
Exact Conversion (TC) is the percentage of the number of sales compared to the number of sales attempts (the number of consultations, fittings, etc.) expressed as a percentage. This indicator characterizes, first of all, the professionalism of the seller.
Visitor Coverage Ratio (CPC) is the percentage of the number of sales attempts compared to the number of visitors to a department. This indicator characterizes the seller’s activity and, in part, his compliance with corporate standards. For example, in many companies there is a rule that the seller must contact the incoming buyer no later than one minute after the appearance in the department.
TC and CPC are complementary indicators whose weights should be the same (explanation below). Moreover, the sum of their weights should exceed the weight of any other indicator characterizing the process. This is explained by the importance of tactical tasks for the solution of which they are used. I think a weight of 0.15 is optimal for each of them. Both of these indicators are categorized as personal quantitative KPIs. The calculation of these indicators is performed automatically by the KPI monitoring system. The metrics used to calculate the TC and CPC can be obtained as follows:
- The number of sales (as well as the revenue of the department) is automatically imported from the accounting or cash system.
- The number of visitors is measured using a visitor counter, which is usually installed at the entrance to the point of sale. The obtained values are automatically recorded in the database of the KPI monitoring system using a special software module. The main thing is that the used counter allows you to connect it to the computer. Therefore, when choosing a counter model, you should choose models that allow this to be done.
- The number of sales attempts is measured using the Seller Activity Button solution. Briefly, the essence of this decision is that each seller receives a wireless keychain (Seller’s Button), which he must press whenever he makes an attempt to sell (for example, advises the buyer). Information about the number of clicks (sales attempts) is automatically recorded in the database of the KPI monitoring system.
The question is often asked, how to determine the proportion of visitors to each department, if the point of sale uses only one visitor counter, which is installed at the entrance to the store? The problem is solved by conducting a simple study. For each department for the duration of the study, a specialist-standardizer is attached, which, using the Seller’s Button, fixes each buyer who entered the department. Information on the number of clicks of the Seller’s Buttons and information on the number of visitors measured by the visitors counter are automatically imported into a single database of the KPI monitoring system. At the end of the measurement, the ratio of the number of visitors to each department to the total number of visitors to the store is taken; the resulting value is multiplied by 100%. Thus, the "popularity" is determined as a percentage of each department of the store. Such measurements should be carried out ~ 1-2 times a year or after significant changes at the point of sale. The duration of each measurement should be determined depending on the number of visitors, and should be such that the total number of measurements is at least 100. I will give an example. Suppose that during the measurement 100 people entered the store, which consists of two departments (the minimum required number of measurements). At the same time, 85 people approached the first section, and 90 people approached the second. This will mean that the popularity of the first section is 85%, the second - 90%. Thus, if 200 people enter the store on some day (this will be measured by the visitors' counter), we will assume that 170 people (200 * 0.85) approached the first department and 180 people (200 * 0.9) approached the second department . If there are several sellers in each department, then the number of visitors per seller is determined in proportion to the time worked by each seller. Agree that it is interesting to determine the “popularity” of each department even without implementing KPI.
It is also often asked how to make sure that sellers do not make false clicks of the Seller’s Button or, conversely, do not underestimate the number of clicks? You can control the accuracy of the number of clicks using the technology of Expert Monitoring based on video surveillance. But in most cases, you can do without the use of Expert Monitoring. The number of sales attempts is used when calculating both TC and CPC. Moreover, in the TC calculation formula, the number of sales attempts is in the denominator, and in the calculation of CPC - in the numerator. If the weights of these indicators are the same, then the seller does not make any sense to overestimate or underestimate the number of attempts to sell. Improving one indicator, it will automatically degrade another.
Determining the threshold CPC values is usually not difficult. With an adequate number of sellers, all threshold values should not vary greatly and should be close to 100%. If you are not sure if the number of sellers is enough, analyze the actual values of the CPC. If you see that at certain time periods CPC is significantly lower than 100%, then it makes sense to think about increasing the number of sellers.
Determining the threshold value of the TC is a more complex, but also solvable problem. To do this, you need to analyze historical data or find out the average value of TC in your segment and region. If the TC in your company (or a specific point of sale) is lower than that of competitors, use the services of Mystery Shoppers.
Customer Dissatisfaction Index
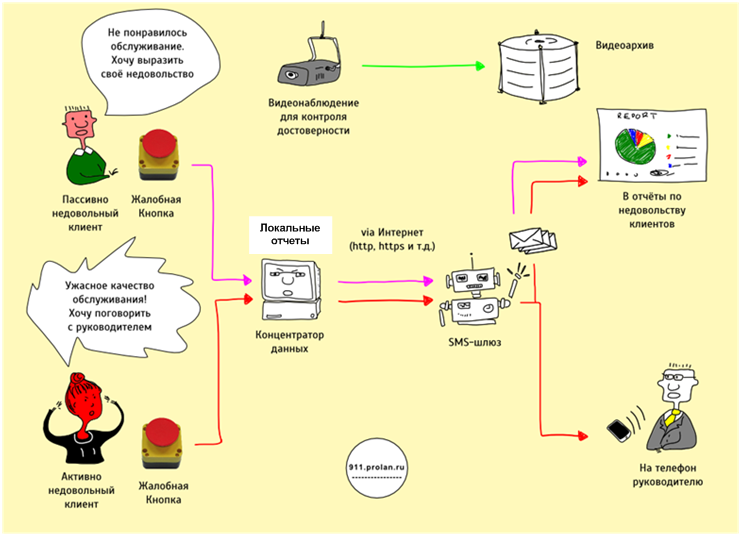
Figure 4. Measurement of the Customer Satisfaction Index.
Customer Satisfaction Index (INC) is a quantitative team indicator that characterizes customer satisfaction with the quality of service. The lower the INC, the higher the customer satisfaction.
INC is the percentage ratio of the number of customers who expressed their dissatisfaction with the quality of service to the total number of visitors to the department. The number of visitors is measured using the counter of the number of visitors and the methodology described above. To measure the number of customers dissatisfied with the quality of service, the complaint button solution is used. Briefly, the idea of the Complain Button is as follows.
In each department of the point of sale, a large red button and a plate with approximately the following contents are installed:
Dear customer!
Thank you for choosing our store. We strive to constantly improve the quality of service, so with great gratitude we will listen to any of your comments and suggestions.
If the quality of service does not meet your expectations, please click this button once.
If you want to inform your store manager about your comments personally, please press the call button and hold it for about 3 seconds.
Each button press is automatically recorded and recorded in the database of the KPI monitoring system. If the buyer not only pressed the red button, but also held it for ~ 3 seconds, then the administrator or claim manager will also receive an SMS message with information when and in which department the button was pressed. A video camera is installed next to the button, which records the image and voice in the archive.
Each click of the red button by the buyer should be checked for justice. For this, a special console of the KPI monitoring system is used. When calculating the actual value of INC, one should use only verified pressures qualified as fair.
The KPI monitoring system supports two types of taps - short and long. This is done to distinguish between passive and active customer dissatisfaction. For example, if the buyer was not paid attention, and leaving the department, he pressed the red button, then this is passive dissatisfaction. If the seller was rude to the buyer or tried to deceive him and the buyer wants to inform the store director about this, then this is already an active discontent. Obviously, the weight of active discontent should be higher. But in order not to introduce an additional line in the KPI matrix, we offer active dissatisfaction with a rising coefficient to be counted as passive dissatisfaction. For example, each case of active dissatisfaction in calculating INC can be equated to five or ten cases of passive dissatisfaction.
To determine the threshold values of INC, it is enough to collect and statistically process historical data. The number of customers who are always dissatisfied, regardless of the quality of service, for each region, as a rule, is constant.
Compliance with corporate standards
Verification of sellers' compliance with corporate standards is a mandatory element of systemic management of customer service quality. Such verification is usually performed by the Mystery Shopper method. Most often, these are specially trained people who, under the guise of ordinary buyers, come to the point of sale and, according to a certain program (check list), check the sellers' work. Obtained in this way, the results are important for the diagnosis of low efficiency sellers. But as to whether or not to include the results of Mystery Shoppers in the KPI matrix, I have no clear answer.
Reasons for inclusion in the KPI matrix:
- Compliance with corporate standards by sellers is one of the criteria for their professionalism, and I do not know of any other effective way to check, besides using Mystery Shoppers.
- The results obtained by the Mystery Shoppers method are used not only to evaluate the performance of sellers, but also to solve other problems. Therefore, many companies do it anyway. If so, then why not use the information received to evaluate the performance of sellers.
Arguments against inclusion in the KPI matrix:
- Most companies invite Mystery Shoppers no more than once a quarter, and it is advisable to do a monthly assessment of sellers' performance.
- This is the only qualitative indicator that requires manual data entry and is characterized by low reliability of the sample and uncertain reliability of the results. In addition, each arrival of Mystery Shoppers is a stress for sellers, which can negatively affect the psychological climate in the team. See " Mystery Shoppers. Need a rebuild? "
Given the above arguments, I propose the following solution. If the company regularly uses the services of Mystery Shoppers, then this indicator with a weight of 0.05 is included in the KPI matrix. If the company does not use the services of Mystery Shoppers or does it irregularly, then this indicator should not be included in the KPI matrix. In the second case, the vacant weight of 0.05 should be added to the weight of the Customer Dissent Index .
Vasya, Masha, KPI and Information Technology
In the figure at the beginning of the article, Vasya and Masha demonstrate two approaches to organizing sales. Vasya is a proponent of the market approach - selling at any cost; the end justifies the means. Masha prefers work according to the rules - in order to achieve the desired Result, you need to properly organize the Process. This is KPI management. Both the first and second approaches have advantages and disadvantages. Obviously, the first approach is simpler and cheaper to implement. But he has an important and not universally understood flaw. For it to work effectively, it is desirable that the sellers are stars . People who can and want to be starsUnfortunately, not very much. A mature business has long understood this, and therefore is implementing KPI management. Ultimately, it’s more profitable, because allows you to achieve the desired result without stars . They are replaced by technology.
However, KPI management technology has not only supporters, but also opponents. KPI control can be compared to drilling holes in concrete. If you have at your disposal only a hand drill, then drilling holes is a headache. It is easier to prove that holes are not needed at all, or even harmful. If you have a powerful hammer drill, then drilling holes not only does not cause problems, but also gives pleasure. As you probably guessed, Information Technologies are such a “puncher”.
Russia's economy has gone from stagnation to recession. Therefore, in order to "survive", the IT service, not in words but in practice, must become a profit center. I want to believe that this article will tell someone how to do this.