Mathematical time alignment
In the comments to the previous article, “ What the Gantt chart is silent about or why projects are always late ”, they threw links to videos and slidecasts that describe other reasons that cause errors when using Gantt charts. The greatest discussion and misunderstanding was caused by the straightening of deadlines due to the asymmetric distribution of the deadline for solving the problem. Under the cut is an example of the influence on the project completion date of this very asymmetric distribution.
Before starting, I remind you that within the framework of the given examples, the used values of the time for solving the problem are taken from some previous experience and are objective. The given examples are intended to demonstrate that, relying on the mathematical expectation of the completion time of a single task when constructing a Gantt chart, we will fall into a hole.
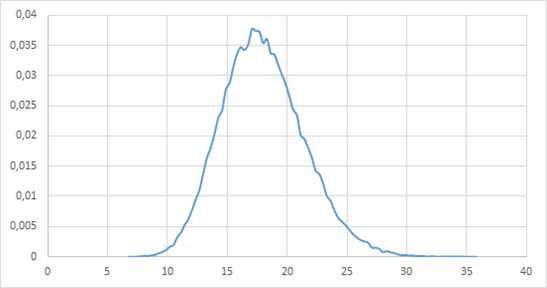
Consider an example in which the most likely time to solve the problem is 3 hours. It is quite clear that there is some time faster than which we cannot solve the problem. We need to read the task, see related tasks, discuss some issues with the analyst or architect, open the IDE, download the project, make changes to the code, build, run, check that everything works as expected, etc. Let's say we can’t solve the problem in less than 30 minutes. But, on the other hand, if there are problems with the computer (it is unlikely, but still), if a passing bug is detected, if there is no employee in the place with whom you need to agree on a solution to the problem, the period may increase up to 6, or even 9 hours. As a result, we obtain the probability distribution density of the form (the abscissa axis takes the time to solve the problem):

And this is not a normal distribution. I, for this article, took the gamma distribution , there are also others, for example, the Maxwell distribution , the beta distribution , etc.
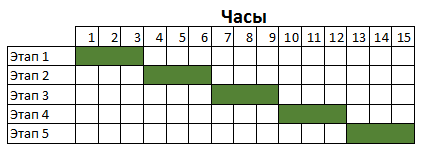
Well, as I said, the mathematical expectation of the time to solve the problem is three hours. The Gantt chart for five sequentially performed tasks will look like this:
Now let's go back to the gamma distribution and carry out a calculation or (as I did, I really love programming) modeling the probability of completing all stages at a given hour.
The first news is joyful, the probability distribution density has taken the form of a normal distribution, but here is the rest ... In order to understand the rest, we build the probability of completion by a given hour:
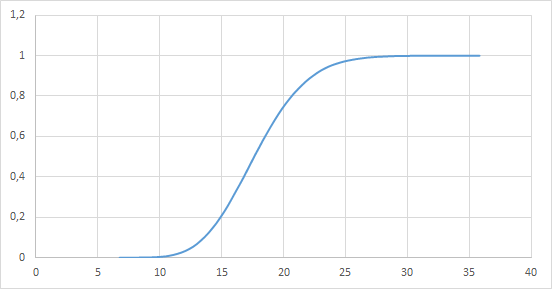
The probability of completion by the planned 15 hours is only 20%. To achieve a 90% probability, it is necessary to shift the completion time by 7 hours (which is 50% of the initial time). And then, in the case of the remaining 10%, we will not fit, and with a probability of 5% we will complete these five tasks in 9 hours.
Another sad news is that even the recent application of the three-valuation methodology doesn’t correct the situation much.
If you don’t remember, the main idea of the three-valuation method is to take a pessimistic forecast, an optimistic forecast, and mathematical expectation. In this case, the deadline for completing the task is determined by the formula:

For our case, if we take the probability of 30% for one task as an optimistic forecast, 95% for the pessimistic forecast, and 50% for the most expected one, then, based on the probability graph, complete one task by the given hour:
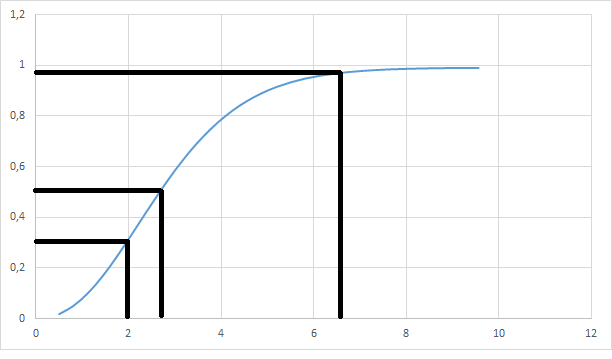
We get that:
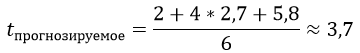
Multiplies 3, 7 hours, in 5 stages and we get 18.5 hours. This is already much better, we will fit in this period with a probability of 75%. And in a quarter of cases, we will continue to break the deadlines.
Links to materials from comments on the previous article:
1. Poisson burning of deadlines
2. Human and mathematical straightening of deadlines
Ps. Thanks for reading and article advice, many thanks to Andrei Potapov, CrazyViper and Cartmendum (the last for swearing at my ignorance of probability theory).
Before starting, I remind you that within the framework of the given examples, the used values of the time for solving the problem are taken from some previous experience and are objective. The given examples are intended to demonstrate that, relying on the mathematical expectation of the completion time of a single task when constructing a Gantt chart, we will fall into a hole.
Consider an example in which the most likely time to solve the problem is 3 hours. It is quite clear that there is some time faster than which we cannot solve the problem. We need to read the task, see related tasks, discuss some issues with the analyst or architect, open the IDE, download the project, make changes to the code, build, run, check that everything works as expected, etc. Let's say we can’t solve the problem in less than 30 minutes. But, on the other hand, if there are problems with the computer (it is unlikely, but still), if a passing bug is detected, if there is no employee in the place with whom you need to agree on a solution to the problem, the period may increase up to 6, or even 9 hours. As a result, we obtain the probability distribution density of the form (the abscissa axis takes the time to solve the problem):
And this is not a normal distribution. I, for this article, took the gamma distribution , there are also others, for example, the Maxwell distribution , the beta distribution , etc.
Well, as I said, the mathematical expectation of the time to solve the problem is three hours. The Gantt chart for five sequentially performed tasks will look like this:
Now let's go back to the gamma distribution and carry out a calculation or (as I did, I really love programming) modeling the probability of completing all stages at a given hour.
The first news is joyful, the probability distribution density has taken the form of a normal distribution, but here is the rest ... In order to understand the rest, we build the probability of completion by a given hour:
The probability of completion by the planned 15 hours is only 20%. To achieve a 90% probability, it is necessary to shift the completion time by 7 hours (which is 50% of the initial time). And then, in the case of the remaining 10%, we will not fit, and with a probability of 5% we will complete these five tasks in 9 hours.
Another sad news is that even the recent application of the three-valuation methodology doesn’t correct the situation much.
If you don’t remember, the main idea of the three-valuation method is to take a pessimistic forecast, an optimistic forecast, and mathematical expectation. In this case, the deadline for completing the task is determined by the formula:
For our case, if we take the probability of 30% for one task as an optimistic forecast, 95% for the pessimistic forecast, and 50% for the most expected one, then, based on the probability graph, complete one task by the given hour:
We get that:
Multiplies 3, 7 hours, in 5 stages and we get 18.5 hours. This is already much better, we will fit in this period with a probability of 75%. And in a quarter of cases, we will continue to break the deadlines.
Links to materials from comments on the previous article:
1. Poisson burning of deadlines
2. Human and mathematical straightening of deadlines
Ps. Thanks for reading and article advice, many thanks to Andrei Potapov, CrazyViper and Cartmendum (the last for swearing at my ignorance of probability theory).