Why do you need Splunk? Monitoring IT infrastructure performance

- How did the shutdown of a single server affect the overall health of the infrastructure?
- Is it possible to predict the deterioration of the infrastructure?
- What impact do critical services have on the system?
In this article we will talk about how Splunk can help in finding answers to these questions.
Today we will continue to talk about the capabilities of Splunk , which specializes in collecting real-time log data, processing and executing complex searches, real-time data analysis, and creating dynamic dashboards and alerts.
In previous articles, we have already written about how Splunk can be used for analytics of application performance , security event analytics , as well as industrial data and the Internet of things .
As for monitoring the IT infrastructure, it is useful in cases where your goal is not to focus on what is working at the moment, but to know what is broken or in critical mode, whether there are performance losses in some services .
Many problems in the future can lead to a decrease in customer satisfaction and loss of customers, loss of staff time and organization money due to equipment downtime. Therefore, it is important to learn to anticipate and identify problems before they occur.
Tasks that can be solved using IT infrastructure monitoring can be divided into 4 areas:
- Situational awareness is the definition of what works well and what needs to be corrected.
- Capacity and capacity planning - evaluating the values of performance indicators over time and their dependence on other indicators, on the basis of which you can get forecasts of performance and capacity.
- Investigation of incidents - an analysis of logs, which can restore the full picture of the incident.
- Reporting - creating graphs and reports that are updated in real time.
Let's take a closer look at what Splunk can offer us to monitor the infrastructure:
Full integration
With the help of Splunk, you can make full integration of all systems, applications and add-ons, uniting at first glance unrelated data. Installing hosts and getting the first logs and metrics often takes very little time.

Constant monitoring and correlation
Constant monitoring in real time and correlated indicators based on data from all devices allow you to see a complete picture of the system's performance, identify anomalies and root causes of problems, determine areas of impact.
Forecasting
Based on historical data and complex KPIs, it is possible to predict the level of infrastructure health, which will prevent system failures before they occur.
Filtering events and reducing the time of investigation
The use of machine learning algorithms allows you to automatically reduce the number of events to those that require increased attention. A comprehensive visibility of events and forecasting will reduce the time to investigate incidents and reduce the total number of incidents and failures.
Customizable visualizations and alerts
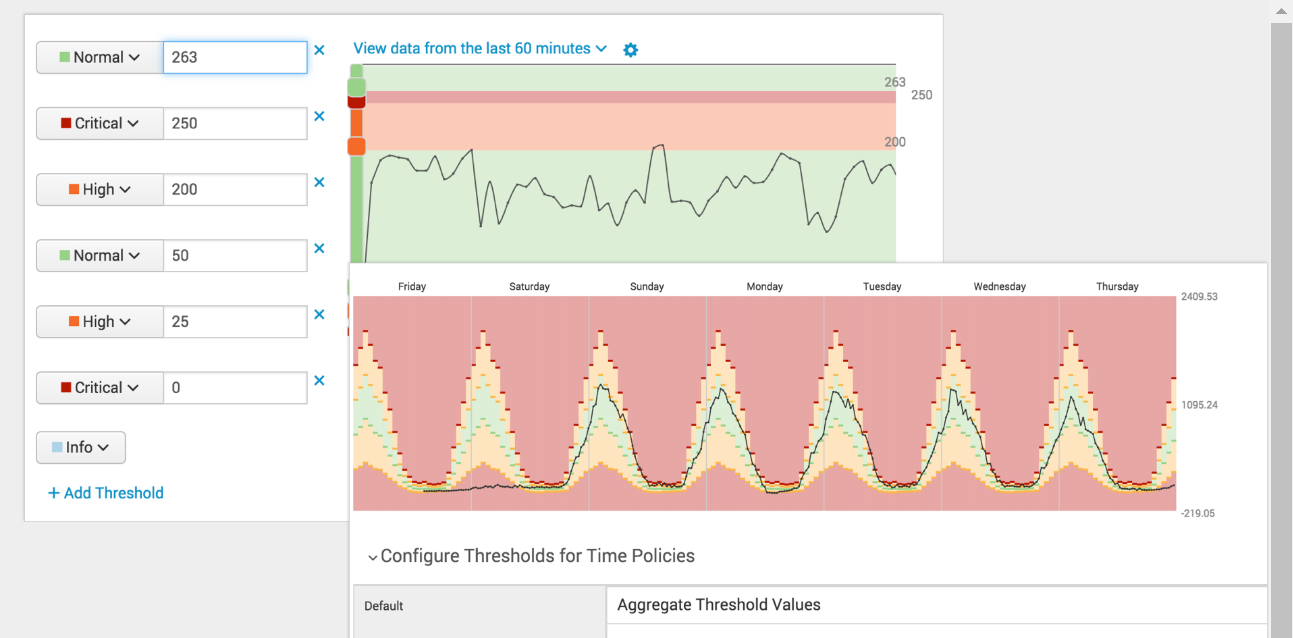
The ability to create various reports and visualization of their IT services, key indicators and trends. Reporting panels can be different and easily configured for different categories of users. Also, based on the values of various indicators, a group of indicators, or specific events, you can set up alerts for quick information about problems and early response.
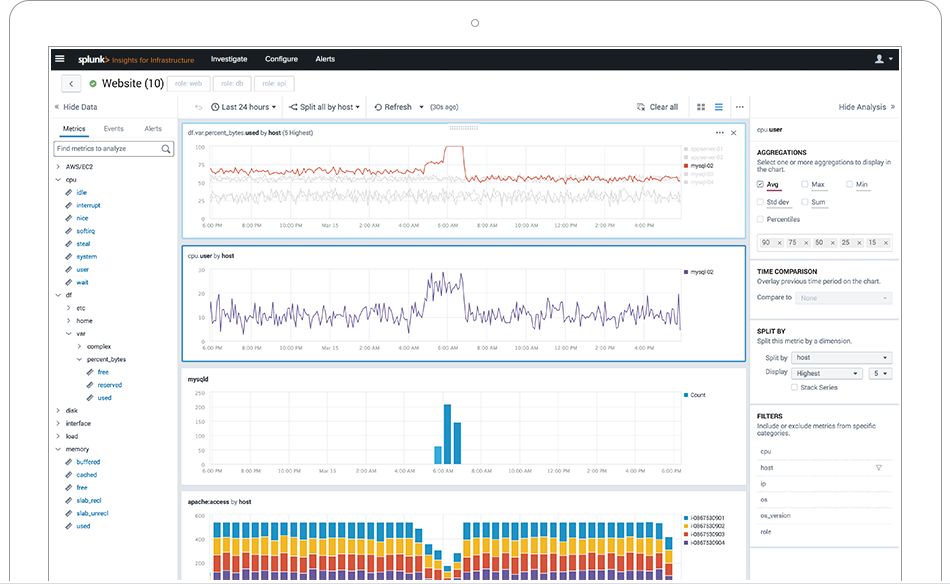
Turnkey solutions
Splunk has several ready-made solutions that allow you to quickly implement the monitoring of IT infrastructure. This is Splunk Insights for Infrastructure www.splunk.com/en_us/software/splunk-enterprise/infrastructure-insights.html and Splunk IT Service Intelligence (ITSI), which we analyzed in detail earlier .