Web Performance: How Swish.com Gets 40% Faster
- Transfer
Users do not like to wait. Study after study demonstrates that the speed of a site significantly affects visitors: on slow sites, visits are shorter, users view less pages and even make purchases on slow sites less often. Each site owner should be serious about its performance, as it significantly affects business results.
We are pleased to announce that it has become easier to test site performance thanks to the new F12 tools designed to find and fix problems associated with it. In this case, we used the Modern.ie scanner and the UI profiler from the new F12 set in IE11. We showed these tools to the developers of the team.swish.com to find out how a popular site can use them to optimize typical usage scenarios. The result - site loading has become 2 seconds faster: 40% performance increase due to a few simple changes in the code.
It is important to note that problems with site performance, in most cases, showed the same in all browsers. Almost all modern browsers performed the same operations. Good tools for web developers simply help find bottlenecks and increase overall productivity. The improvements made will help to speed up the site in all browsers, and not just in Internet Explorer.
Swish.com collects the most interesting items available for pre-order from the sites Kickstarter, Indiegogo, Amazon, Outgrow.me, Dragon Innovation, and Crowd Supply, giving you the opportunity to see the most impressive technical news in one place.
Like many similar sites, swish.com uses both static elements and content downloaded using AJAX requests from the database. The result is displayed as a grid with large product images.
The performance of swish.com at the time the project started was satisfactory, but we noticed a significant delay in the initial loading of the site. Our task was to find simple ways to optimize the site code that would allow users to quickly move on to the search for products.
We started testing from the “User Interface Response” tab in the F12 Internet Explorer 11 tools. Below is the result we got before the optimization: The “User Interface Response” tab is a new tool in the F12 suite, and it definitely deserves attention. The graphic at the top of the window displays all the activities that occur during page loading. The color coding shows what tasks the CPU was used for: blue - downloading files, red - JavaScript, etc. The same colors are used in the chart below.
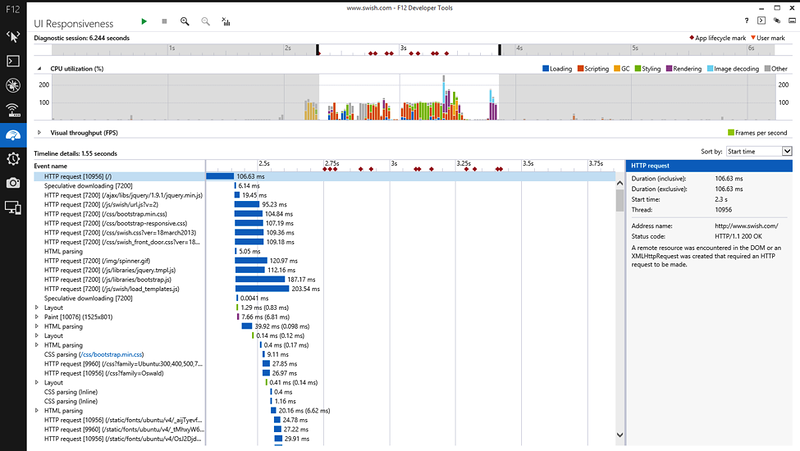
You can use your mouse to select any part of the graph to see what events were happening at that moment. The selected area is highlighted in white, with the details displayed in the diagram below. The panel on the right is used to display additional information for each selected event.
From the graph you can understand that when the site loads, there are periods of very low activity (white gaps between the colored columns). This means that the page is awaiting the arrival of content from the server. Some moments are also visible when the page is actively executing JavaScript and cannot do anything other than this. We will try to use knowledge of these two facts to optimize the page.
Many optimization options are associated with changing the file upload order. See what files the page loads and in what order you can in the “network” tab: Usually Internet Explorer caches files locally and tries to avoid wasting time on requesting files from the server. For optimization purposes, of course, we need to simulate a situation when a user visits the site for the first time, and there are no files in the cache yet. To do this, click the “always update from server” button at the top of the window before starting recording. After that, click on the “enable network traffic collection” button and refresh the page.
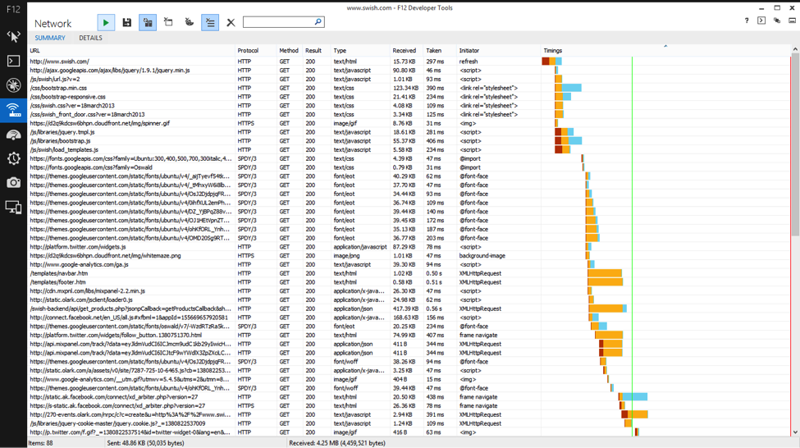
The tasks in the resulting network activity graph are also color coded: red - the time between the creation of the request and its actual sending, yellow - waiting from the moment the request is sent until the first byte of the result is received, and blue means the time to load the result.
Large white spaces that are not occupied by any activities (for example, a space after loading load_templates.js) mean moments when the network is not actually used. They match the spaces that we saw above in the “User Interface Response” tab. Approaching these areas, we can understand exactly where optimization is possible.
The information that we received from the IE11 developer tools is enough to draw up a plan for optimizing the site loading. What we saw on swish.com is also easy to find on many other sites, so the tips below can be widely applied for optimization.
Most browsers perform “speculative downloading” when loading a page, a procedure for scanning HMTL code and searching for elements that you can immediately download to maximize the connection capacity. The proper ordering of different file types, especially scripts and CSS, is extremely important to maximize download speed. Good advice is to download external CSS files as early as possible, because the browser will not be able to correctly display the page without CSS. JavaScript can wait.
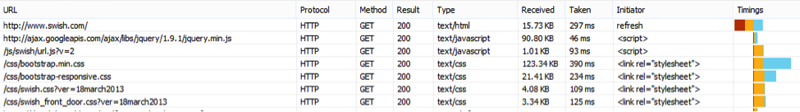
In this case, the “Network” tab shows that swish.com requires JavaScript before CSS before scripts are needed to display the page. The request for jquery.min.js and url.js files can be moved down to the closing tag. In extreme cases, external scripts may be at the end of the head section, but always after all CSS.
Using Gzip to compress files containing mostly text (HTML, CSS, JavaScript) can significantly reduce their size and, therefore, speed up the download. If we select an HTML page and look at the “Details” tab of the “network” tab, we will see that Gzip compression is not used (a page that uses compression will have a corresponding title). It turned out that Gzip compression was used earlier when the site was on a different server, but it was not turned on after the move.

CSS styles can load other external CSS files using the @ import directive. These nested style inclusions can significantly reduce performance, as they violate the browser’s ability to prefetch content. If the external style is specified directly in HTML, the browser can immediately send a request to download it, which will reduce the overall page load time. If the external style has an embedded @ import directive, the browser cannot start downloading it until this style is loaded and processed.
In our case, bootstrap.min.css has a @ import directive that loads some fonts. In the network activity record, we see that @ import only starts after loading bootstrap.min.css, which causes a significant delay.

In this case, the @ import directives were required exclusively for downloading special fonts, so we decided to use the built-in fonts instead. In the general case, the correct solution would be to transfer the link to the files directly in HTML or to include the content directly in CSS.
In the footer template, we found a link to the script. F12 tools make it easy to notice, since they show the sources of all requests in the network activity report. The source of this jquery-cookie.js request is XMLHttpRequest, which is unusual and significantly reduces performance. We do not recommend using scripts in HTML templates. When jQuery processes scripts inside HTML, scripts are executed immediately before control returns to the HTML embed script. If the script is external, this leads to a significant delay caused by waiting for the script to be received from the server. The situation is very similar to the problem with @ import for CSS, described above, where additional levels of nesting lead to a delay in receiving content.

The solution to the problem is also similar to the situation described above with @ import. Scripts must be inserted directly into the HTML file so that the browser can preload them. If possible, you should also combine them and use compression to save network connection resources.
Third-party widgets and counters caused a significant portion of delays in loading and executing swish.com code. However, they are not required by the user at the initial stage of working with the site: it is unlikely that someone will want to share something on facebook or twitter - at least several seconds should be required to read the page. The IE11 JavaScript profiler showed that it was third-party code that was the main reason for CPU loading, which delayed the entire page.
In the “Network” tab, you can see that the scripts Facebook and Google analytics are loaded even earlier than the header and footer of the page. We recommended loading these scripts after a timeout of several seconds, after the basic page elements loaded.

Graphics can make up a substantial portion of the downloadable content, especially for a visually rich site like swish.com. Available online tools like modern.ie or webpagetest.org will help you determine which images can be compressed. You can use tools similar to kraken.io in order to minimize the weight of images, without significant loss of quality. Prior to optimization, swish.com received images directly from the original source, and these images were far from always optimized. Using optimized images from their own server, they were able to achieve much faster loading of the site.
The good news: these problems were very easy to solve - almost all of them were fixed. Here's what the network activity record looks like after optimization:

There are several ways to evaluate page loading speed. Due to the complexity of modern sites, simple measurements such as time to window.onload can no longer be an objective indicator. Performance optimization guru, Steve Souders, explained the reasons and suggested more relevant measurement metrics on his blog www.stevesouders.com/blog/2013/05/13/moving-beyond-window-onload
The webpagetest.org website allows you to view the storyboard of the video download site that shows how the user sees her. We tried this tool to visually evaluate the swish.com download speed before and after optimization.
Below is a storyboard of page loading, broken down by 0.5 seconds. It is seen that the appearance of the page skeleton occurs after 3 seconds, and the entire page becomes visible only after 5.5 seconds of loading. Our site optimization work done using the tools of the Internet Explorer 11 developer allows you to see the whole site and start using it after 3.5 seconds:


Updated developer tools in Internet Explorer 11 and the modern.ie scanner allow you to quickly and easily find and eliminate “bottlenecks” that prevent the site from loading quickly. New analytic tools, such as the “ User Interface Response ” tab, allow you to see which particular performance aspects most affect the page loading and save time on finding them. We were able to achieve two seconds faster loading of the site, and give users a faster interface immediately after entering the site.
We are pleased to announce that it has become easier to test site performance thanks to the new F12 tools designed to find and fix problems associated with it. In this case, we used the Modern.ie scanner and the UI profiler from the new F12 set in IE11. We showed these tools to the developers of the team.swish.com to find out how a popular site can use them to optimize typical usage scenarios. The result - site loading has become 2 seconds faster: 40% performance increase due to a few simple changes in the code.
It is important to note that problems with site performance, in most cases, showed the same in all browsers. Almost all modern browsers performed the same operations. Good tools for web developers simply help find bottlenecks and increase overall productivity. The improvements made will help to speed up the site in all browsers, and not just in Internet Explorer.
This is how we did it
Swish.com Analysis
Swish.com collects the most interesting items available for pre-order from the sites Kickstarter, Indiegogo, Amazon, Outgrow.me, Dragon Innovation, and Crowd Supply, giving you the opportunity to see the most impressive technical news in one place.
Like many similar sites, swish.com uses both static elements and content downloaded using AJAX requests from the database. The result is displayed as a grid with large product images.
The performance of swish.com at the time the project started was satisfactory, but we noticed a significant delay in the initial loading of the site. Our task was to find simple ways to optimize the site code that would allow users to quickly move on to the search for products.
We look at the tab “User Interface Response”
We started testing from the “User Interface Response” tab in the F12 Internet Explorer 11 tools. Below is the result we got before the optimization: The “User Interface Response” tab is a new tool in the F12 suite, and it definitely deserves attention. The graphic at the top of the window displays all the activities that occur during page loading. The color coding shows what tasks the CPU was used for: blue - downloading files, red - JavaScript, etc. The same colors are used in the chart below.

You can use your mouse to select any part of the graph to see what events were happening at that moment. The selected area is highlighted in white, with the details displayed in the diagram below. The panel on the right is used to display additional information for each selected event.
From the graph you can understand that when the site loads, there are periods of very low activity (white gaps between the colored columns). This means that the page is awaiting the arrival of content from the server. Some moments are also visible when the page is actively executing JavaScript and cannot do anything other than this. We will try to use knowledge of these two facts to optimize the page.
Dig deeper: Network tab
Many optimization options are associated with changing the file upload order. See what files the page loads and in what order you can in the “network” tab: Usually Internet Explorer caches files locally and tries to avoid wasting time on requesting files from the server. For optimization purposes, of course, we need to simulate a situation when a user visits the site for the first time, and there are no files in the cache yet. To do this, click the “always update from server” button at the top of the window before starting recording. After that, click on the “enable network traffic collection” button and refresh the page.

The tasks in the resulting network activity graph are also color coded: red - the time between the creation of the request and its actual sending, yellow - waiting from the moment the request is sent until the first byte of the result is received, and blue means the time to load the result.
Large white spaces that are not occupied by any activities (for example, a space after loading load_templates.js) mean moments when the network is not actually used. They match the spaces that we saw above in the “User Interface Response” tab. Approaching these areas, we can understand exactly where optimization is possible.
First results
The information that we received from the IE11 developer tools is enough to draw up a plan for optimizing the site loading. What we saw on swish.com is also easy to find on many other sites, so the tips below can be widely applied for optimization.
Download CSS first, then JavaScript
Most browsers perform “speculative downloading” when loading a page, a procedure for scanning HMTL code and searching for elements that you can immediately download to maximize the connection capacity. The proper ordering of different file types, especially scripts and CSS, is extremely important to maximize download speed. Good advice is to download external CSS files as early as possible, because the browser will not be able to correctly display the page without CSS. JavaScript can wait.

In this case, the “Network” tab shows that swish.com requires JavaScript before CSS before scripts are needed to display the page. The request for jquery.min.js and url.js files can be moved down to the closing tag. In extreme cases, external scripts may be at the end of the head section, but always after all CSS.
Use gzip to compress files
Using Gzip to compress files containing mostly text (HTML, CSS, JavaScript) can significantly reduce their size and, therefore, speed up the download. If we select an HTML page and look at the “Details” tab of the “network” tab, we will see that Gzip compression is not used (a page that uses compression will have a corresponding title). It turned out that Gzip compression was used earlier when the site was on a different server, but it was not turned on after the move.

Consider using inline fonts.
CSS styles can load other external CSS files using the @ import directive. These nested style inclusions can significantly reduce performance, as they violate the browser’s ability to prefetch content. If the external style is specified directly in HTML, the browser can immediately send a request to download it, which will reduce the overall page load time. If the external style has an embedded @ import directive, the browser cannot start downloading it until this style is loaded and processed.
In our case, bootstrap.min.css has a @ import directive that loads some fonts. In the network activity record, we see that @ import only starts after loading bootstrap.min.css, which causes a significant delay.

In this case, the @ import directives were required exclusively for downloading special fonts, so we decided to use the built-in fonts instead. In the general case, the correct solution would be to transfer the link to the files directly in HTML or to include the content directly in CSS.
Avoid scripting in templates
In the footer template, we found a link to the script. F12 tools make it easy to notice, since they show the sources of all requests in the network activity report. The source of this jquery-cookie.js request is XMLHttpRequest, which is unusual and significantly reduces performance. We do not recommend using scripts in HTML templates. When jQuery processes scripts inside HTML, scripts are executed immediately before control returns to the HTML embed script. If the script is external, this leads to a significant delay caused by waiting for the script to be received from the server. The situation is very similar to the problem with @ import for CSS, described above, where additional levels of nesting lead to a delay in receiving content.

The solution to the problem is also similar to the situation described above with @ import. Scripts must be inserted directly into the HTML file so that the browser can preload them. If possible, you should also combine them and use compression to save network connection resources.
Take your time to download third-party code
Third-party widgets and counters caused a significant portion of delays in loading and executing swish.com code. However, they are not required by the user at the initial stage of working with the site: it is unlikely that someone will want to share something on facebook or twitter - at least several seconds should be required to read the page. The IE11 JavaScript profiler showed that it was third-party code that was the main reason for CPU loading, which delayed the entire page.
In the “Network” tab, you can see that the scripts Facebook and Google analytics are loaded even earlier than the header and footer of the page. We recommended loading these scripts after a timeout of several seconds, after the basic page elements loaded.

Compress pictures
Graphics can make up a substantial portion of the downloadable content, especially for a visually rich site like swish.com. Available online tools like modern.ie or webpagetest.org will help you determine which images can be compressed. You can use tools similar to kraken.io in order to minimize the weight of images, without significant loss of quality. Prior to optimization, swish.com received images directly from the original source, and these images were far from always optimized. Using optimized images from their own server, they were able to achieve much faster loading of the site.
The good news: these problems were very easy to solve - almost all of them were fixed. Here's what the network activity record looks like after optimization:

Before and after: what we won
There are several ways to evaluate page loading speed. Due to the complexity of modern sites, simple measurements such as time to window.onload can no longer be an objective indicator. Performance optimization guru, Steve Souders, explained the reasons and suggested more relevant measurement metrics on his blog www.stevesouders.com/blog/2013/05/13/moving-beyond-window-onload
The webpagetest.org website allows you to view the storyboard of the video download site that shows how the user sees her. We tried this tool to visually evaluate the swish.com download speed before and after optimization.
Below is a storyboard of page loading, broken down by 0.5 seconds. It is seen that the appearance of the page skeleton occurs after 3 seconds, and the entire page becomes visible only after 5.5 seconds of loading. Our site optimization work done using the tools of the Internet Explorer 11 developer allows you to see the whole site and start using it after 3.5 seconds:


Happy end
Updated developer tools in Internet Explorer 11 and the modern.ie scanner allow you to quickly and easily find and eliminate “bottlenecks” that prevent the site from loading quickly. New analytic tools, such as the “ User Interface Response ” tab, allow you to see which particular performance aspects most affect the page loading and save time on finding them. We were able to achieve two seconds faster loading of the site, and give users a faster interface immediately after entering the site.