Collection of sensor readings and their display
People like beautiful presentations. Beautiful pictures, some text, changing slides. A beautiful picture allows you to quickly transfer information to a person, communicate the most important. We all know that. I’m thinking how to “cross a hedgehog and a snake”?
How to visualize on a computer monitor the processes occurring inside a microcontroller or FPGA? Or how to show what is happening inside the entire automation system implemented on a microcontroller or FPGA?
Actually, I know the correct answer - you need to use SCADA systems.
SCADA is supervisory control and data acquisition, supervisory control and data collection. But we are not looking for easy ways, we want to invent our bicycle a little.
I want to share my simple method of displaying data received from sensors and sensors from the control board.
Here, first of all, you need to separate three components:
- data transfer protocol. It is necessary to somehow encode the information transmitted from the controller to the computer.
- firmware in the automation system, in the microcontroller or FPGA. This module should collect the readings of the sensors and transfer them to a computer for display in a "beautiful form"
- visualization software. Shows the status and values of the sensors. Maybe he is building some kind of graphics.
So, in order I will try to tell.
Data transfer protocol.
Currently, there are only two physical possibilities to connect a device to a computer or laptop: a network connection via Ethernet / WiFi or USB. The “real” parallel and serial ports are almost a thing of the past. It was easy with them. Of course, they can still be found if you look. But it’s better not to think in this direction.
Ethernet so far set aside. For transmission over the network, you need to have TCP / IP stack drivers in the controller, as a rule, this draws the presence of an OS, usually Linux or ucLinux. Then you need a network setup interface: what is the IP address? Is it static or dynamic? What mask and gateway? In general, it is not very simple to implement and configure.
USB seems much simpler, although there are many pitfalls: what class / subclass of the device? Does he need drivers or are standard drivers of the same Windows used?
And again, back to square one - the easiest way is to use a serial port via USB. In the simplest case, there are cords like USB2Serial. Well, or as a great option for the developer of boards and controllers - various FTDI chips.
OK, still select the serial port via USB. And if so, then the data transfer may be in the form of a sequence of characters. So it’s even simpler further: the sensor readings can be transmitted in the form of lines of the form “SENSOR_NAME = VALUE”
With this approach, we can easily increase the number of polled sensors, and easily change their type. The state of the trailer or reed switch will be transmitted, for example, in the form of the lines “but0 = 1” or “but1 = 0”. The temperature value can be transmitted in the form of the string "t0 = 36.6". Lines are most easily separated by carriage return characters: 0x0D 0x0A.
So, at first, even the visualization program on the computer is not needed. You can simply run a terminal program like Putty and look at the sensor readings from the controller.
Controller.
My controller is based on the Altera Cyclone III FPGA. In fact, this is the Mars rover2 board known to the developers . I already wrote about some of the projects carried out on it. For example, once we made on this board on a clean FPGA FM radio transmitter . And we also made a USB Tracker on it . There are other projects.
Here is such a board:

There are already 2 buttons on the board - these are the first two sensors for my experiments.
I also connected the ds18b20 thermometer chip - this is the second sensor.
You can also use the ADC board to measure something-yet-don't-know-what. So far, here is just a variable resistor instead of a sensor.
It is important that the FTDI FT2232HL microcircuit is already on the board, which provides communication with a computer via USB in the form of a virtual serial port. The transfer rate is already 12Mbit / s. This is conditionally 1.2 MB / s. If, for example, the board polls sensors every 100 milliseconds, then it turns out that for each poll, you can transfer more than 100Kbytes of data to the computer. Pretty well.
Now I will not talk about the project for the board and FPGA Cyclone III. There is a separate article for this . This article details how data is polled and the results are transferred to a computer via the serial port. It’s better to move on to the consideration of the 3rd component - a program for visualizing sensor values that runs on a computer.
Data visualization program.
Here I wanted to do everything quickly and easily. What to write a program on so that it is easy to write, change, supplement?
I choose Python, although honestly there is no experience. It just seems that it will be good. As one of the harazhiteli said (sorry, I don’t remember who) - I would also like to “train my python”.
So, since the program will be graphical, I’ll try the built-in Tkinter python. I will use pyserial to work with the serial port.
I would like to write a kind of set of classes - for each type of sensor its own class.
The simplest class is a binary sensor. It can be a button, a trailer, a reed switch. Its values are 0 or 1. The python class BinSensor corresponding to this sensordisplays only 2 states. I suggest each state draw its own image. The image is attached to the fixed coordinates of the program window on top of the background image.

As soon as the value "0" has arrived, we show the first picture. If the value "1" has come, then we show the second picture. Images can be any - it all depends on our imagination.
Here is this class:
#!/usr/bin/env python
import Tkinter
from Tkinter import *
root = Tk()
class BinSensor:
  def __init__(self,name,img0,img1,x,y):
    self.name=name
    self.x=x
    self.y=y
    self.img0=PhotoImage(file=img0)
    self.img1=PhotoImage(file=img1)
    self.val=0
    self.label_img=Label(root,image=self.img0)
    self.label_img.place(x=self.x,y=self.y)
  def set(self,state):
    if(self.val==state): return
    self.val=state
    if( int(state)==0 ):
      self.label_img.configure(image=self.img0)
    else:
      self.label_img.configure(image=self.img1)
The following parameters are passed to the __init__ function, which is called when the class is instantiated:
Name - the name of the sensor
Img0 and img1 - the names of the image files used to display the state of the sensor.
X and y are the coordinates of the window where the sensor will be displayed.
When creating a sensor object, a Label with a picture is immediately created and placed in the Tkinter window.
The set function takes a string parameter - this is the new state of the sensor “0” or “1”. Depending on the new value, the picture inside the Label is reconfigured, changed to another. In general, that’s all.
Similarly, the second vBarSensor class is implemented .
class vBarSensor:
  def __init__(self,name,scale,min,max,x,y,w,h):
    self.name=name
    self.scale=scale
    self.x=x
    self.y=y
    self.h=h
    self.val=min
    self.min=min
    self.max=max
    self.delta=max-min
    h1=self.h*(self.val-self.min)/self.delta
    h0=self.h-h1
    self.canv0 = Canvas(root, width = w, height = h0, bg = "lightblue", bd=1, relief='ridge')
    self.canv1 = Canvas(root, width = w, height = h1, bg = "red", bd=1, relief='ridge')
    self.barLabel = Label(root, text = "0")
    self.canv0.place(x=self.x,y=self.y)
    self.canv1.place(x=self.x,y=self.y+h0)
    self.barLabel.place(x=self.x,y=self.y+h+5)
  def set(self,newval):
    #newval is signed hex string like "83A5"
    val=int(newval,16)
    if(val>0x7fff): val=-val
    val=val/self.scale
    if(self.val==val): return
    self.val=val
    h1=self.h*(self.val-self.min)/self.delta
    h0=self.h-h1
    self.barLabel.configure(text=str(self.val))
    self.canv0.configure(height = h0)
    self.canv1.configure(height = h1)
    self.canv1.place(y=self.y+h0)
This class graphically represents a thermometer type sensor. The values from the sensor may vary in a certain range. Also, when creating an instance of this class, you must specify the name of the sensor. In addition, the thermometer has a possible minimum and maximum value, and we also indicate the coordinates of the column in the visualization window, the width and height of the column.
The thermometer column, as it were, consists of two parts, the lower red and the upper light.
It would be possible to create one Tkinter canvas and draw these columns on it, but for some reason I did wrong. I made two canvases of different colors and in the set () function I change the vertical size for them. In principle, this is not important. Works. By the way, if you want to see exactly the image of the thermometer in the visualization window, then you can draw it on the background image of the window, and place an instance on top of itvBarSensor .

Probably will be nice.
I wrote another GridDisplay class to display sensor readings and change them over time. I will not cite its source code here, so as not to overload the article with unnecessary details. Who will need to download the entire project from the site , along with the source for FPGAs for Altera Quartus II.
But perhaps the main program alls.py will show. There are not many things here:
#!/usr/bin/env python
import sensor
from sensor import *
import serial
from serial import *
class AllSensors:
  def __init__(self):
    #open serial port
    self.s=serial.Serial("COM27",115200,timeout=10)
    #load background image
    self.bgnd=PhotoImage(file="bgnd.gif")
    self.label_bgnd=Label(root,image=self.bgnd)
    self.label_bgnd.place(x=0,y=0)
    #add all sensors and indicators
    self.all=[]
    self.all.append( BinSensor("b0","f0.gif","f1.gif",32,32) )
    self.all.append( BinSensor("b1","f0.gif","f1.gif",32,128) )
    self.all.append( vBarSensor("a0",1,0,255,128,32,32,160) )
    self.all.append( GridDisplay("t0",16,-55,125,10,16,180,32,256,160) )
  def set(self,name,val):
    for sens in self.all:
      if(sens.name==name):
        sens.set(val)
        return
  def setline(self,line):
    p=line.split("=")
    if(len(p)==2):
      self.set( p[0], p[1] )
  def run(self):
    while(1):
      line=self.s.readline()
      line=line.rstrip()
      #print(line)
      self.setline(line)
      root.update()
a=AllSensors()
a.run()
In this program, I open the serial port for reading. I load the background image into the window. I create a list of all available sensors. Next, I read the lines from the port, disassemble them and pass the new value to the corresponding class instance by the name of the sensor.
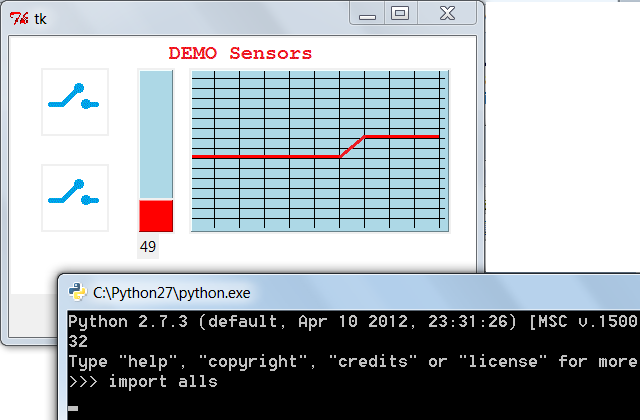
Running a program from Python is easy: “import alls”, where alls is the name of the main program, the alls.py file . That's what my program looks like now:
Here is a video that shows how it all works (just don’t be scared, I turn on the hairdryer there to heat the temperature sensor, so it’s better to tighten the sound):
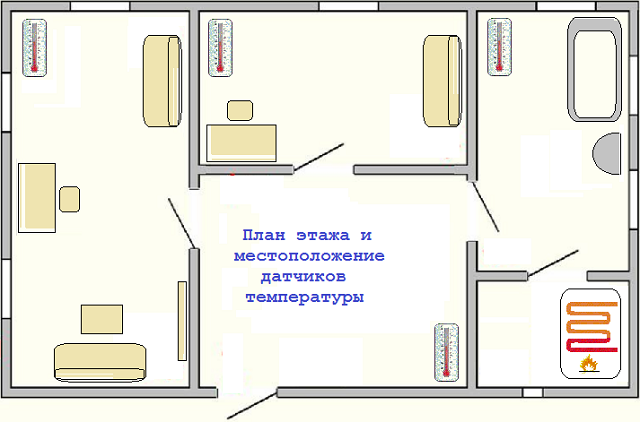
Now that the "skeleton" of the application is working, you can proceed to a detailed drawing of the floor plan and the sensors installed in it.