KDD 2018, fourth day, stands the Nobel laureate

The second day of the main KDD program. There is again a lot of interesting things under the cut: from machine learning on Pinterest to different ways to get to the water pipes. Including the performance of the Nobel laureate in economics - a story about how NASA works with telemetry, and many graph embeddings :)
Market design and computerized marketplace
A good presentation of the Nobel laureate who worked with Shapley on markets. The market is an artificial thing that people invent. There are so-called commodity markets, when you buy a certain product and you do not care from whom, it is only important at what price (for example, the stock market). And there are matching markets when price is not the only factor (and sometimes there is none at all).
For example, the distribution of children by school. Previously, in the US, the scheme worked like this: parents write out a list of schools by priorities (1, 2, 3, etc.), schools first consider those who indicated them as number 1, sorted by their school criteria and take as much as they can . For those who missed, we take the second school and repeat the procedure. From the point of view of game theory, the scheme is very bad: parents have to behave “strategically”, it is inappropriate to honestly say their preferences - if you don’t get into school 1, by the second round, school 2 may already be filled and you don’t get into it even if your characteristics are higher than those who were accepted in the first round. In practice, disrespect for the theory of games translates into corruption and internal agreements between parents and schools. Mathematicians have proposed a different algorithm - “pending adoption”. The basic idea is that the school does not give consent immediately, but simply keeps a “ranked list of candidates” “in memory”, and if someone goes beyond the tail of the tail, they immediately receive a refusal. In this case, there is a dominant strategy for parents: first we go to school 1, if at some point we get rejected, then we go to school 2 and are not afraid to lose anything - the chances of getting to school 2 are the same as if we went to it right away This scheme is implemented "in production", though. The results of the A / B test are not told. Then we go to school 2 and are not afraid to lose anything - the chances of getting to school 2 are the same as if we went to it right away. This scheme is implemented "in production", though. The results of the A / B test are not told. Then we go to school 2 and are not afraid to lose anything - the chances of getting to school 2 are the same as if we went to it right away. This scheme is implemented "in production", though. The results of the A / B test are not told.
Another example is kidney transplantation. Unlike many other organs, it is possible to live with one kidney, so often a situation arises that someone is willing to give a kidney to another person, but not abstract, but concrete (in view of personal relationships). However, the likelihood that the donor and the recipient are compatible is very small, and you have to wait for another body. There is an alternative - the exchange of the kidneys. If two donor-recipient pairs are incompatible inside but compatible between pairs, then an exchange can be made: 4 simultaneous extraction / implantation operations. For this, the system is already running. And if there is a “free” organ that is not tied to a specific pair, then it can give rise to a whole chain of exchanges (in practice there were chains of up to 30 transplantations).
There are a lot of similar markets now: from Uber to the online advertising market, and everything changes very quickly due to computerization. Among other things, “privacy” is changing a lot: as an example, the speaker pointed out a study of one student who showed that in the United States after the elections, the number of visits to Thanksgiving Day has decreased due to inter-state trips with different political views. The study was conducted on an anonymized dataset of the coordinates of the phones, but the author rather easily singled out the “house” of the owner of the phone, i.e. deanonymized dataset.
Separately, the speaker went through technological unemployment. Yes, unmanned cars will deprive many of them (in the US, 6% of jobs are at risk), but they will create new jobs (for auto mechanics). Of course, an elderly driver will not be able to retrain, and for him it will be a strong blow. At such moments, you need to concentrate not on how to prevent changes (it will not work), but on how to help people get through them as painlessly as possible. In the middle of the last century, many people lost their jobs during the mechanization of agriculture, but we are glad that half of the population now does not have to go to work in the field? Unfortunately, this is only talk, the speaker didn’t offer any options to mitigate the blow for those on whom technological unemployment is heading ...
And yes, again about faireness. It is impossible to make so that the distribution of the forecast model was the same in all groups, the model will lose its meaning. What can be done, in theory, so that the distribution of ERRORS of the first and second kind is the same for all groups? This already looks much more sensible, but how to achieve this in practice is not clear. He gave a link to an interesting article on legal practice - in the United States, the judge decides whether to release bail based on the ML forecast .
Recommenders I
Confused in the schedule and came not to the speech, but still in the subject - the first block on recommendation systems.
Leveraging Meta-path-based mechanism
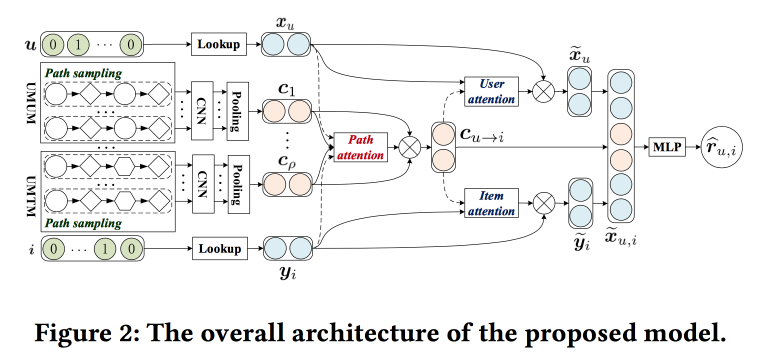
The guys are trying to improve the recommendations by analyzing the paths in the graph. The idea is quite simple. There is a “classic” neural network recommender with embeddings for objects and users and a fully connected part from above. There are recommendations on the graph, including with neural network wraps. Let's try to combine it all in one mechanism. Let's start by building a “meta graph” that unites users, movies and attributes (actor / director / genre, etc.), sample a number of paths on the random walk-om box, feed a convolutional network at the input, add the user's embeddings and object, and above we will hang attention (here is a little tricky, with its own characteristics for different branches). To get the final answer, we will install a perceptron with two hidden layers from above.
Consumer Internet Applications
Between presentations, I move to the presentation I wanted to initially: here are guest speakers from LinkedIn, Pinterest and Amazon. All girls and all heads of DS-departments.
Neraline Contextual Recommentations for Active Communities LinkedIn
The point is to stimulate the development of communities and their activation in LinkedIn. Half missed the development, the last recommendation: to exploit local patterns. For example, in India, students often after graduation try to contact graduates of the same university from previous courses with a decorated career. In LinkedIn, this is taken into account when building and when issuing recommendations.
But simply creating a community is not enough, it is necessary that there was an activity: users published content, received and gave feedback. Show the correlation of the received feedback with the number of publications in the future. Show how the information cascades spread over the graph. But what if a node is not involved in a cascade? Send a notification!
Then there were quite a lot of calls with yesterday's story about working with notifications and tape. Here they also use the multipurpose optimization approach “maximize one of the metrics while keeping the others within certain limits”. In order to control the load, we introduced our system “Air Trafic Control”, which limits the load on notifications to the user (they were able to reduce formal replies and complaints by 20% without dropping engagement). ATC decides whether to push the user or not, and another push is preparing this push called Concourse, which is streaming (like us, on Samza !). It was about her many told yesterday. Concourse also has an offline partner named Beehive, but gradually more and more goes into streaming.
A few more points were noted:
- Important dedupilation, and quality, given the presence of many channels and content.
- It is important to have a platform. And they have a dedicated team of the platform, and programmers work there.
Pinterest Approach to Machine learning
Now the representative of Pinterest speaks and talks about two big tasks where ML is used (homefeed) tape and search. The speaker immediately says that the final product is the result of the work not only of a data scientist, but also of ML engineers, and programmers — all of them have been assigned to people.
The tape (the situation when there is no user intention) is built according to the following model:
- We understand the user - we use information from a profile, a graph, interaction with pins (that I saw, that I kicked), we build embeddings according to their behavior and attributes.
- We understand the content - we look at it in all aspects: visual, textual, who the author is, what boards he gets on, who reacts. It is very important to remember that people in one picture often see different things: someone has a blue accent in design, someone has a fireplace, and someone has a kitchen.
- Putting it all together - a three-step procedure: we generate candidates (recommendations + subscriptions), personalize (using the ranking model), blend with policies and business rules.
For recommendations, use a random walk by user-board-pin graph, implement PinSage, which was spoken about yesterday . Personalization has evolved from sorting by time, through a linear model and GBDT to a neural network (since 2017). When collecting the final list, it is important not to forget about the business rules: freshness, variety, additional filters. We started with heuristics, now they are moving towards the context optimization model as a whole relative to the goals.
In the search situation (when the intention is there), they move a little differently: they try to better understand the intention. To do this, use the techniques of query understanding and query expansion, and the expansion is made not just by autocompletion, but through beautiful visual navigation. Use different techniques for working with pictures and texts. We started in 2014 still without deep learning, launched Visual Search with deep learning in 2015, added object detection with semantic analysis and search in 2016, recently launched the Lens service - you point the smartphone camera at an object and get pins. In deep learning, multi task is actively used: there is a common block that builds embedding of a picture. and on top of other networks to solve different problems.
In addition to these tasks, ML is used a lot more where: notifications / advertising / spam / forecasting, etc.
A little about the lessons learned:
- We must remember about the bass, one of the most dangerous "rich get richer" (the tendency of machine learning to pour traffic into the already popular objects).
- Be sure to test and monitor: the introduction of the grid at first strongly collapsed all the indicators, then it turned out that because of the bug, the distribution of features drifted long ago and voids appeared online.
- The infrastructure and the platform are very important, special emphasis is placed on convenience and parallelization of experiments, but it is also necessary to be able to cut off experiments offline.
- Metrics and understanding: offline does not guarantee online, and for the interpretation of models we make tools.
- We build a sustainable ecosystem: about the garbage filter and clickbate, be sure to add negative feedback to the MD and the model.
- Don't forget that there is a layer for embedding business rules.
Broad Knowledge Graph by Amazon
Now comes the girl from Amazon.
There are knowledge graphs — entity nodes, edge attributes, etc. — that are built automatically, for example, by Wikipedia. They help to solve many problems. We would like to get a similar thing for products, but there are a lot of problems with it: there is no structured data at the entrance, the products are dynamic, there are many different aspects that do not fall on the knowledge graph model (arguably, in my opinion, rather “do not fall without serious complication of the structure "), There are a lot of verticals and" not named entities ". When the concept was “sold” to the management and received good, the developers said that it was “a project for a hundred years,” and finally managed in 15 man-months.
We started with extracting entities from the Amazon catalog: there is some kind of structure here, although it is crowdsourced and dirty. Next hooked up OpenTag (explained in more detail yesterday) for word processing. And the third component was Ceres - a tool for parsing from the web, taking into account the DOM tree. The idea is that by annotating one of the pages of the site, you can easily parse the rest - because everything is generated from a template (but there are many nuances). To do this, they used the Vertex markup system (bought by Amazon in 2011) - they make markup, use the xpath set to isolate attributes, and determine which are applicable to a specific page using logistic regression. To merge information from different sites, use random forest. They also use active learning, complex pages are sent to manual layout.
Next, a little for life. They identify two types of targets. Roofshots are the short-term goals that we achieve and we are moving the product, and Moonshots, which we are expanding and holding global leadership.
Embeddings and Representations
After lunch, I went to the section on how to build embeddings, mainly for graphs.
Finding Similar Exercises with a Unified Semantic Representation
The guys solve the problem of finding similar tasks in some Chinese online learning system. Tasks are described by text, pictures, and a set of related concepts. Developer input - Blend information from these sources. For pictures they make a rollout, for concepts, embeddings are trained, for words too. Word embedings are passed to Attention-based LSTM along with information about concepts and pictures. Get some representation of the assignment.

The block described above is turned into a Siamese network, in which attention is also added and at the output of a similarity score.
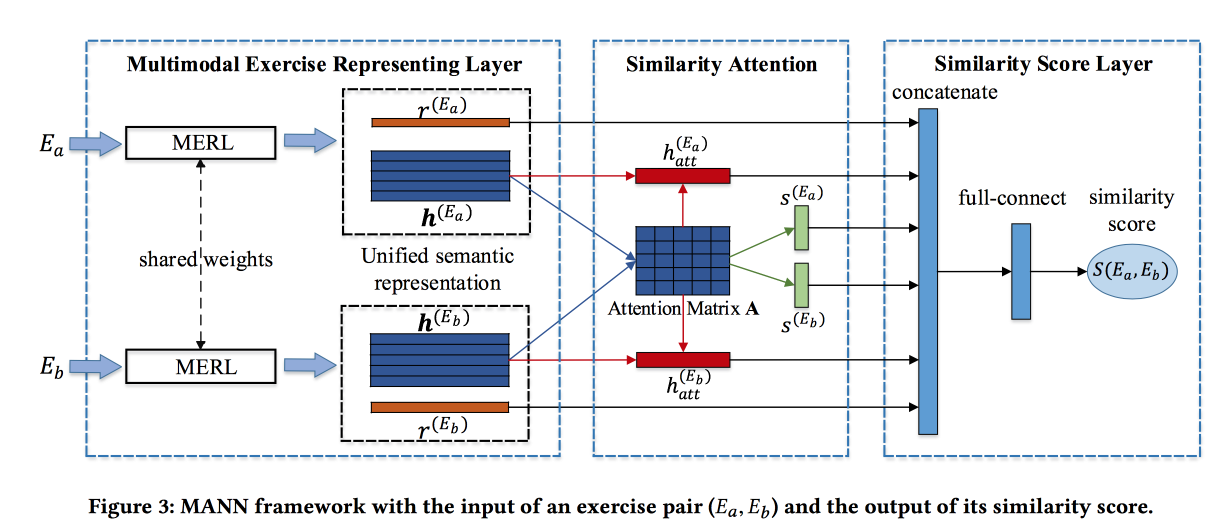
They teach on a marked dataset of 100 thousand exercises and 400 thousand pairs (only 1.5 million exercises). Add hard negative, sampling exercises with the same concepts. The attention matrices can then be used to interpret similarity.
Arbitrary-Order Proximity Preserved Network Embedding
The guys are building a very interesting version of embeddings for graphs. First, methods based on walks and on the basis of neighbors are criticized for emphasizing the “proximity” of a certain level (corresponding to the length of the walk). They also offer a method that takes into account the proximity of the desired order, and with controlled weights.
The idea is very simple. Let's take a polynomial function and apply to the adjacency matrix of the graph, and factor the result by SVD. In this case, the degree of a particular member of a polynomial is the level of proximity, and the weight of this member is the effect of this level on the result. Naturally, this wild idea is not realizable: after building the adjacency matrix into a power, it becomes compacted, does not fit into the memory, and figures factor this.
Without mathematics, it's a rubbish, because if a polynomial function is applied to the result AFTER decomposition, then we get exactly the same thing as if we applied the decomposition to a large matrix. Not really, really. We consider SVD approximate and leave only the highest eigenvalues, but after applying a polynomial, the order of eigenvalues can change, so you need to take numbers with a margin.

The algorithm impresses with its simplicity and shows stunning results in the problem of link prediction.

NetWalk: A Flexible Deep Embedding Approach for Dynamic Networks
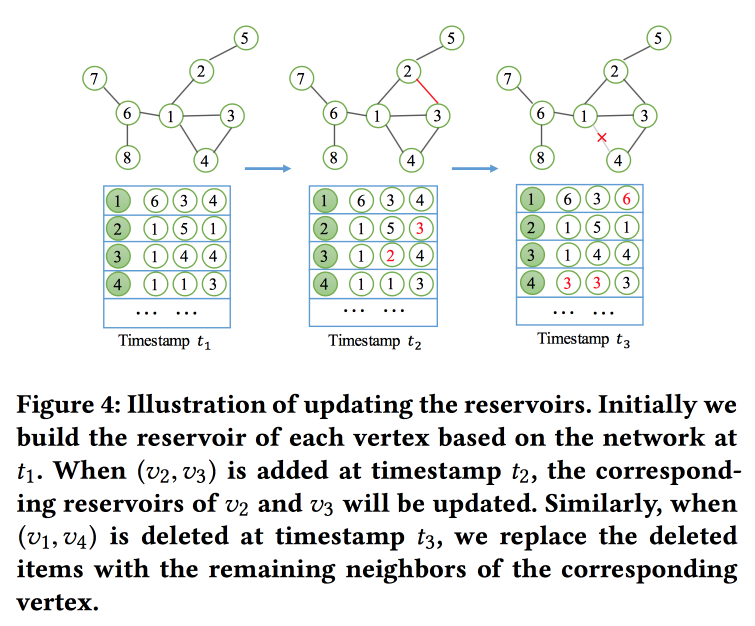
As the name implies, we will build graph embedings based on walks. But it is not easy, but in streaming mode, since we are solving the problem of finding anomalies in dynamic networks (the work on this topic was yesterday). In order to quickly read and update embeddings, the concept of a “ reservoir ” is used, in which the count's sample lies and is stochastically updated as changes arrive.
For training, they formulate a rather complicated task with several goals, the main ones being the proximity of embeddings for nodes in one way and a minimum of error when the network is restored by the autoencoder.
Hierarchical Taxonomy Aware Network Embedding
Another version of the construction of embeddings for the graph, this time based on a probabilistic generating model. The quality of embeddings is improved by using information from a hierarchical taxonomy (for example, areas of knowledge for citation networks or product categories for products in e-tail). The generation process is based on some “tops”, some of which are tied to nodes in the taxonomy, and some to a specific node.
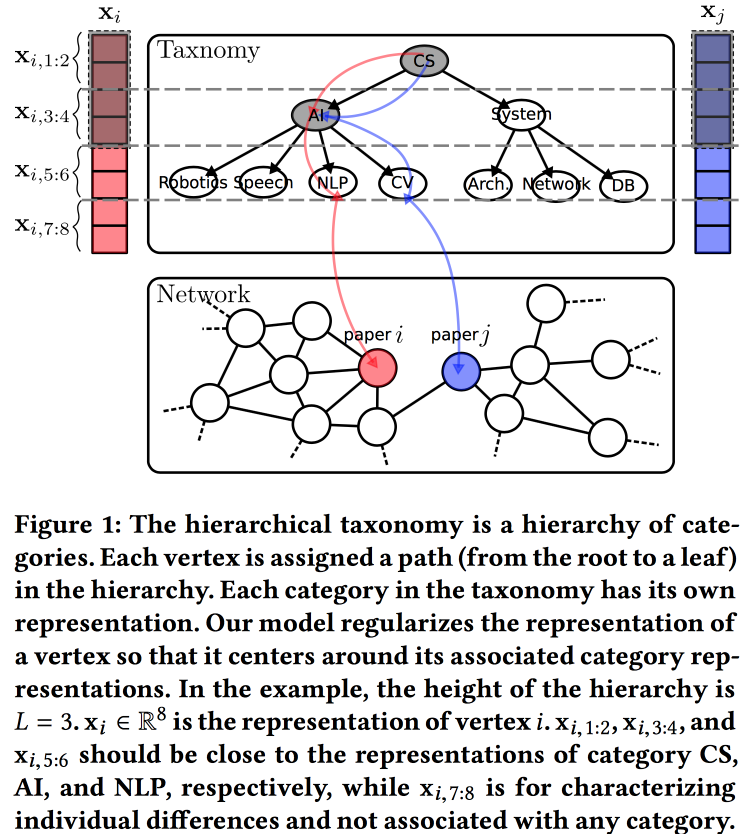
We associate with the taxonomy parameters an a priori normal distribution with zero mean, the parameters of a particular vertex in taxonomy are the normal distribution with an average equal to the taxonomy parameter, and the free parameters of the vertex are with the normal distribution with zero mean and infinite variance. The vertex environment is generated using the Bernoulli distribution, where the probability of success is proportional to the proximity of the parameters of the nodes. We optimize this whole machine with the EM algorithm .
Deep Recursive Network Embedding with Regular Equivalence
Common methods for building embeddings do not work for all tasks. For example, consider the task "the role of the node." To determine the role, it is not the specific neighbors (which are usually looked at) that are important, but the structure of the graph in the neighborhood of the vertex and some patterns in it. At the same time, it is very difficult algorithmically to find these patterns (regular equivalence) algorithmically, but for large graphs it is unrealistic.
So let's go the other way . For each node, we calculate the parameters associated with its graph: degree, density, different centralities, etc. On them, embeddings cannot be built, but recursion can be used, because the presence of the same pattern implies that the attributes of the neighbors of two nodes with the same role should be similar. So, you can stack more layers.
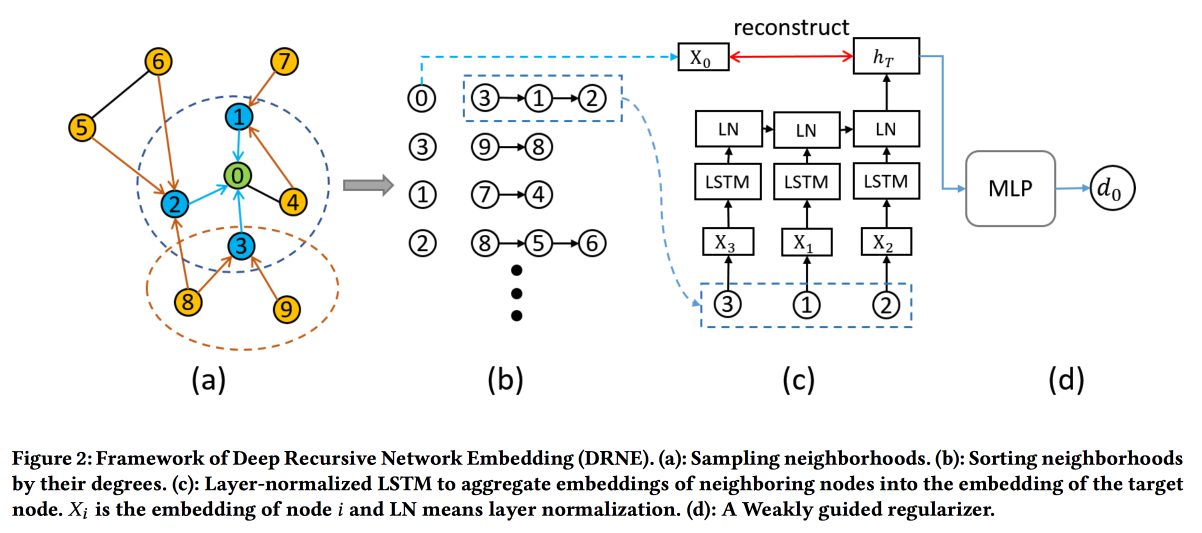
The validations show that the standard base lines of DeepWalk and node2wek bypass many tasks.
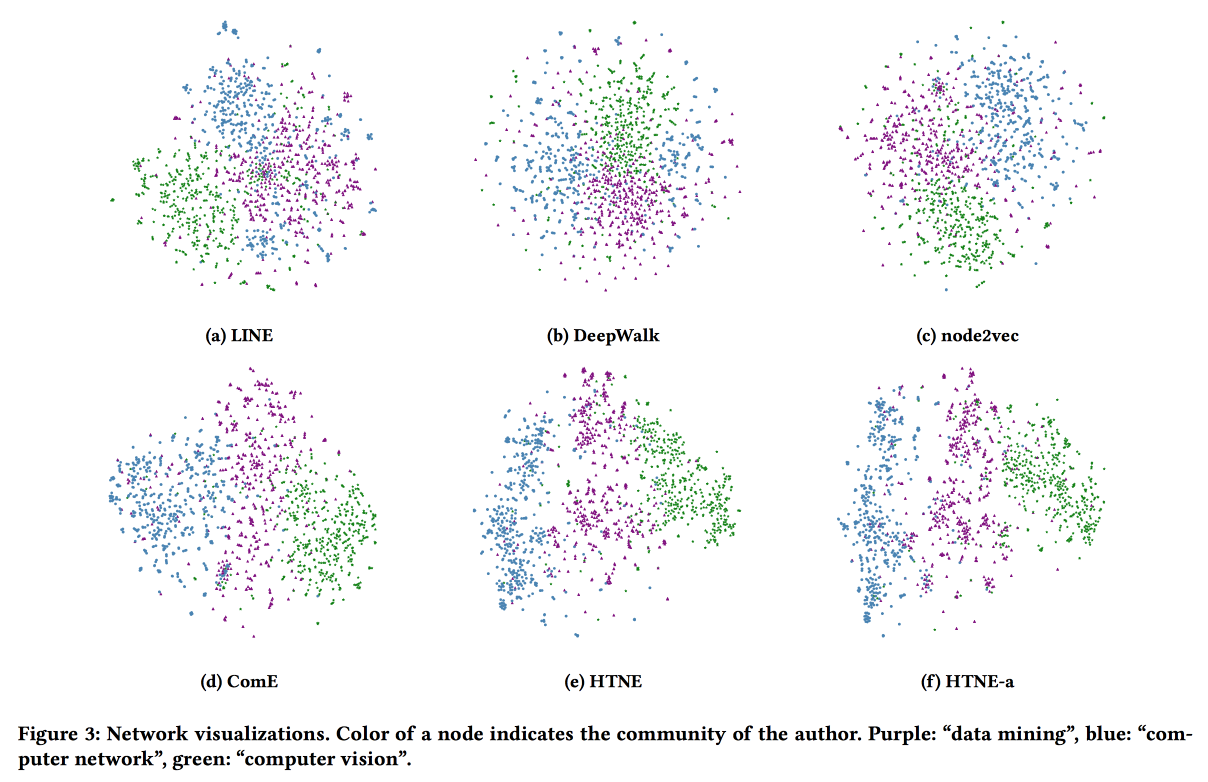
Embedding Temporal Network via Neighborhood Formation
Last work on graph embeddings for today. At this time, we will look at the dynamics: we will evaluate both the moment of the occurrence of the connection and all the facts of interaction in time. As an example, we take a citation network, where interaction is a joint publication.
Use the Hawkes Process to simulate how past vertex interactions affect their future interactions. The intensity functions and the influence of historical events for HP are determined through the Euclidean distance between embeddings. To improve the result, add the attention matrix to adjust the effect of the story. Optimize log likelihood using gradient descent. The results look good.
Safety
In the evening session it was difficult to choose. where to go, but in the end I was very pleased. In the analysis of questions about how ML can help protect life in real projects, there was almost no complicated ML, but practical cases are very interesting.
Using the Machine Learning
In the American city of Syracuse problems: the population is decreasing, tax collection too, the infrastructure is aging - some water pipes were laid in the nineteenth century. Naturally, pipe breaks regularly and eliminating the consequences is very expensive. Pipes need to be changed, but little money (including due to the fact that a lot of them are spent on eliminating accidents), and you can change only 1-2% of pipes per year. We must choose where to change the pipe in the first place .
And then I decided to try to help the data miners team from the Chicago-based Data Science for Social Good project . True, the guys immediately ran into problems, since the most important data looked like this:

Handwritten diagrams of pipes and acts of acceptance of work, some of which are more than a hundred years old. But the guys did a good job: they manually digitized this dataset and zablendili a lot of other things, and then trained GBDT. At the same time, they made a rather unusual optimization of hyperparameters for accuracy on Top-1% of the answer.
We compared the accuracy of the forecast with the base line: the heuristics for “changing the oldest pipes” works almost as bad as a random choice, but the heuristics for “changing where the most accidents have been lately” works very well. But ML, of course, is better.
27 of the 32 predicted accidents have already happened, the rest, most likely, not far off (in accidents there is seasonality, in winter there are more of them - the pipes freeze). Expect that the use of the model will save about $ 1.2 million next year.
On the question of whether it was possible to find interesting and not obvious patterns, they said that in the 1940s, it seems, the metal for the pipes was of poor quality (everything went to the front) and the model paid attention to this.
Detecting Spacecraft Anomalies Using LSTMs and Nonparametric Dynamic Thresholding
The guys from NASA presented the work on the analysis of telemetry from spacecraft (satellites and rovers). Task - search for anomalies. Now the system works on thresholds and does not detect some types of anomalies until a catastrophe occurs. Experts periodically look through the graphics with their eyes, but there is a lot of data.
ML is pretty simple. We refuel the time series in LSTM and predict what will happen in the future. We build on the model on each telemetry channel for interpretability of the result (so that the expert understands where to look). Then we compare the real values with the forecast, and if the difference is above the threshold, then we light the signal. With the threshold is not so simple, it is also selected on the data. Gaussian error modeling did not work, there is a different distribution.
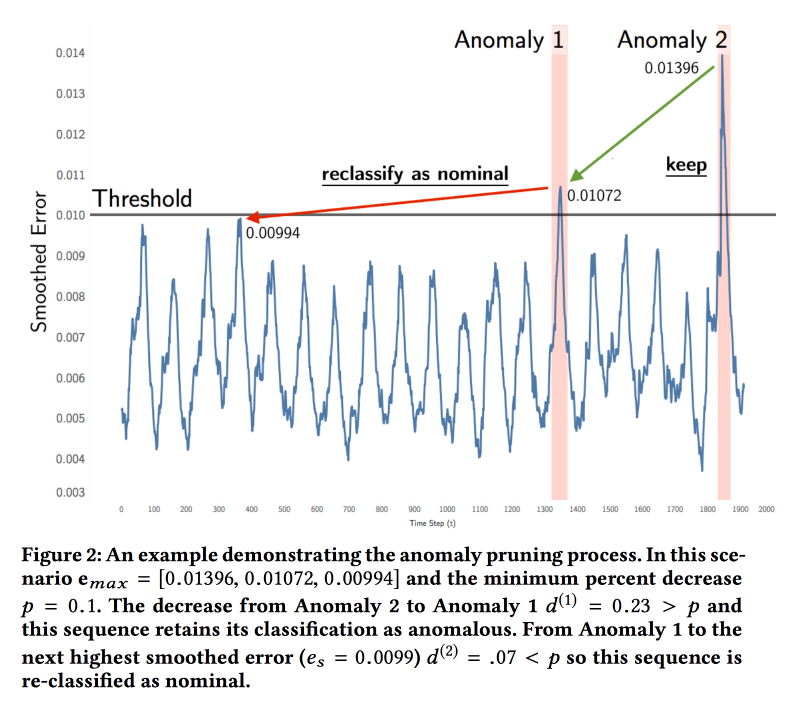
Checked the model on the data of two missions:soil moisture active passive in orbit and Curiosity from the Mars Science Laboratory. Experts noted 122 anomalies, the accuracy and completeness of the model turned out about 80%. They launched the pilot, found anomalies in the work of the radar, which broke down after two months. There is a problem with the teams, some indicators change as expected when the commands are executed, but the commands themselves do not fall into the model.
Explaining Aviation Safety Incidents of Deep Temporal Multiple Instance Learning
Another work on telemetry, this time from conventional aircraft. Occasionally Safety Incidents happen to airplanes, for example, when landing at a certain point, the speed becomes higher than the standard. Some of these incidents end in tragedy, but the vast majority of passengers do not even know. In this case, any incident carefully versed on the ground.
A lot of indicators are collected from an airplane, and an expert person sits down to study them in the period preceding the incident. His task is to find "precursors", i.e. factors that led to the incident. This work is very hard, because there is a lot of data, but it is analyzed manually. So, we need to make a system that would help to look for problem areas.
The essence of the model proposed in the work lies in the recurrent neural network based on the GRU , which is trained using the Multiple Instances Learning approach . The approach is that instead of individual labeled learning examples, we are given “bags” - sets of examples where the label is associated with the bag as a whole. When forecasting, we also evaluate the bags according to the principle “if there is at least one positive, then the whole bag is positive, if not, then negative” (in our case, positive = anomaly). This scheme is very easy to add to the network using the max pooling layer on top of the outputs of the recurrent units.

They taught all this with the help of cross entropy loss on a marked dataset from human-analyzed incidents. As the base line used options MI-SVM and his past work as an ADOPT.
ActiveRemediation: The Search for Lead Pipes in Flint, Michigan
Those who read, waiting for a wonderful story .
There is a small town in the USA Flint. It is located a hundred kilometers from Detroit and about 120 thousand people live there. Unfortunately, the neighbor Detroit declared bankruptcy in 2013, which created certain problems for Flint: the water supply system was tied to Detroit. But a river of the same name flowed alongside, so they decided to take water from there and switched to the actual water supply in 2014. However, in 2015, pediatricians sounded the alarm - the number of children with an abnormally high amount of lead in the blood increased dramatically. Checking the water in the houses showed the presence of lead, although it was not found in the river. Immediately switched back to the supply from Detroit, but lead in the water has not gone anywhere ...
After a showdown, the situation cleared up - the water in the river was clean, but it had a different toughness and its own impurities. Whereas in the construction of the aqueduct many years ago, lead pipes with insulation designed for Detroit water were used. Flint water dissolved this insulation and the lead pipes began to come into contact with water.
As a result, the city’s water supply system needs almost complete replacement. "Practically," because part of the pipes are made of copper. But then new difficulties surfaced: records about where and which pipes lay were extremely careless, some of the data was lost. In the end, where is the lead, and where is the copper - is unknown, and everything must be changed ...
For several years, replaced about 6 thousand sections of the pipeline. At first they found only lead, but then the percentage of false autopsies and wasted money began to grow and reached 20%. Here they decided to call the data scientist for help.
Those who saw the data in the books and cards of the 19th century, were a little stunned, didn’t bury their hands and sent to the digitization office. Only a part of them could be recognized there, and the rest was returned marked “impossible to recognize”. Added additional sources, including a map, and set XGBoost and hierarchical Bayesian on it for modeling geo-spatial dependencies. We got a good forecast accuracy (7% better than the logistic regression).
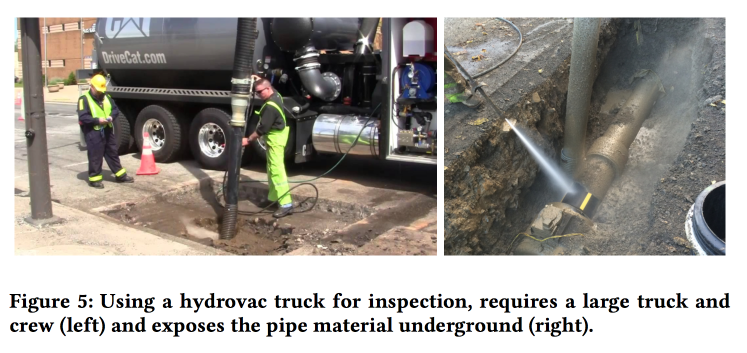
The authorities did not dare to dig according to the results of the forecast, but they gave the guys a car-wiper, which could get to the pipes with relatively little damage, in order to check whether copper or lead was there. With this machine, the guys began to practice "active learning" and were convinced of the effectiveness of the model.
After analyzing the data retrospectively, it was considered that using the model in the format of active learning would reduce the cost overrun from 16% to 3%. In addition, they noted that in the process of interaction with scientists, the authorities significantly improved their attitude to the data - instead of leaflets and scattered plates in Excel, a normal portal appeared to track the process of replacing the water supply system.
A Dynamic Pipeline for Spatio-Temporal Fire Risk Prediction
In conclusion, another sore point - fire inspections. About what happens if they do not hold, we learned in March 2018. In the US, too, such cases are not rare. At the same time, the resources for inspections at firemen are limited, it is necessary to direct them to the place where the risk is greatest.
There are open fire risk assessment models, but they are intended for forest fires and are not suitable for the city. There is some kind of system in New York, but it is closed. So you should try to make your own .
In cooperation with the firefighters of Pittsburgh, the guys collected data on fires over several years, added information about demographics, income, business forms, etc., as well as other appeals to the fire service that were not related to fires. And tried to assess the risk of fire based on these data.
They train two different XGBoost models: for households and for commercial real estate. The quality of work was evaluated, first of all, by Kapp in view of the strong imbalance of classes.
Adding dynamic factors (calls to the fire brigade, triggering detectors / alarms) to the model significantly improved the quality, but to use them, the model had to be recalculated every week. On the basis of the forecast, the models made a pleasant web-muzzle for fire inspectors, showing where the objects with the highest risk are located.
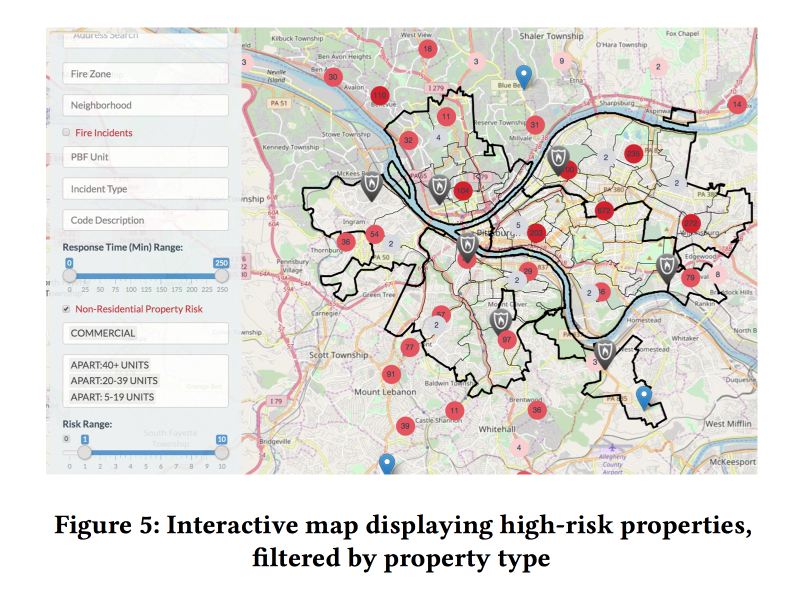
Analyzed the importance of signs. Among the important features for commerce turned out to be associated with false alarms of the alarm (apparently, the shutdown goes on). But for households - the amount of taxes paid (hi Fairness, fire inspections in poor areas will go more often).