24-core CPU, and I can not dial an email
- Transfer
I was not looking for trouble. I didn’t run Chrome’s build process a thousand times over the weekend , but I’ve only done the most common tasks of the 21st century — I just wrote an email at 10:30 in the morning. And suddenly Gmail hung. I kept typing for a few seconds, but no characters appeared on the screen. Then, suddenly, Gmail opened up - and I went back to my very important letter. But later everything repeated, only this time Gmail did not respond to requests even longer. This is strange ...
It is difficult to resist the opportunity to conduct a good investigation, but in this case the challenge is especially strong. After all, I'm working on Google to improve the performance of Chrome for Windows. Discover the cause of the hang - my job. And after a lot of false starts and hard efforts, I still managed to figure out how Chrome, Gmail, Windows and our IT department together prevented me from typing an email. Along the way, I found a way to save a significant amount of memory for some web pages in Chrome.
The investigation turned out to have so many nuances that I will leave some for another article , and now I will fully explain the reasons for the suspensions.
As usual, UIforETW works with me in the background and monitors cyclic buffers, so all that remained was to enter Ctrl + Win + R - and the buffers of the system were saved to disk in about the last thirty seconds. I downloaded them to the Windows Performance Analyzer (WPA), but could not finally install the hang.
When the Windows program stops transmitting messages, ETW events are issued indicating where exactly this happened , so these types of hangs are trivial to find. But, apparently, Chrome continued to transmit messages. I looked for the moment when one of the key streams of Chrome either entered the active cycle, or was completely idle, but found nothing obvious. There were some places where Chrome is mostlyidle, but even then all key streams continued to work, so it was impossible to be sure where the hangup occurred - Chrome could idle simply in the absence of events:

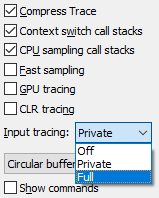 UIforETW has a built-in keylogger, which is often useful in identifying key points in the trace. However, for obvious security reasons, by default it anonymizes keystrokes, regarding each entered number as “1” and every letter as “A”. This makes it difficult to find the exact time of the hang, so I changed the type of tracing from “private” to “full” and waited for the hang. At about 10:30 the next morning the hangup repeated. I saved the trace buffers and saved this mark in the UIforETW trace information field:
This is a common discussion of how to get to the office , but it is important that there is now a way to find a hang in the ETW trace. I load the trace, look at the keylogger data in the Generic Events field (events are issued by UIforETW, and each is a purple diamond in the screenshot below) - and I immediately see where the hang occurred, which is clearly correlated by the failure in using CPU:

Good, but why Chrome stopped? Here are some hints: the screenshots do not show that every time WmiPrvSE.exe fully uses the hyper- thread CPU. But that shouldn't matter. In my machine, there are 24 cores / 48 threads, so the consumption of one hyperflow means that the system is still 98% free.
Then I approached a clearly important period when Chrome was idle - and looked, in particular, at the CrRendererMain process in chrome.exe (27368) corresponding to the Gmail tab.
The problem has cleared up. Within 2.81 seconds of hangup, this thread was launched according to the schedule 440 times. Usually, running every 6 ms is enough to make the program responsive, but for some reason this did not happen. I noticed that every time he woke up, I was on the same stack. If you simplify:
Chrome calls VirtualAlloc, which tries to update some “CfgBits” and should get a lock. At first, I assumed that Chrome called VirtualAlloc 440 times, which seems odd. But the reality was even stranger. Chrome called VirtualAlloc once - and had to get a lock. Chrome signaled the blocking availability, but - 439 times in a row - when Chrome woke up and tried to get the lock, it turned out to be unavailable. The blocking was obtained again through the process mentioned above.
This is because Windows locks are inherently unfair - and if the thread releases the lock and then immediately requests it again, it can receive it forever. Hunger. More on this next time.
In each In the case of a process that signals Chrome to take a lock, there was a WmiPrvSE.ehe, releasing the lock on this stack:
It took some time to parse in WMI (more on that next time), but in the end I wrote a program to recreate the behavior of WMI. I had CPU sampling data that showed what WmiPrvSE.exe is spending time on (in simplified form with some edits):
Playing back the slow scan from the sample data was pretty easy. An interesting part of the call stack above was NtQueryVirtualMemory , which is used to scan the process memory and is called appropriately named GetProcessVaData , where Va probably represents the virtual address. My VirtualScan program simply called NtQueryVirtualMemory in an obvious loop to scan the address space of the specified process, the code worked very long to scan the Gmail process (10-15 seconds) - and caused it to hang. But why?
The advantage of a handwritten scan cycle is that you can generate statistics. NtQueryVirtualMemoryreturns data for each adjacent range of address space with corresponding attributes. Such can be "everything is reserved", "everything is fixed with certain protection settings", etc. There were about 26,000 of these blocks in the Gmail process, but I found another process (as it turned out, this is WPA ) with 16,000 memory blocks, which was scanned very quickly.
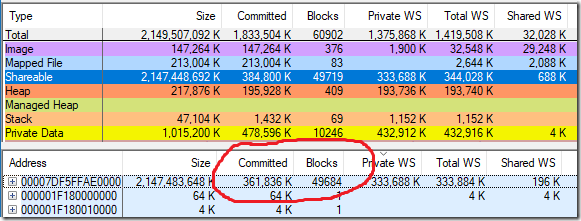
At some point, I looked at the Gmail process using vmmap and noticed that the Gmail process takes up a lot of memory (361,836 KB) and many separate blocks (49,719) coming from a single source of reserved shared memory - a source of 2,147,483,648 in size KB, that is 2 TB. What?
I knew that a 2 TB backup is used for Control Flow Guard(CFG), and remembered that “CFG” did appear in the call stacks, where the Gmail process in Chrome was waiting — MiCommitVadCfgBits was on the stack . Maybe a large number of blocks in the CFG region was a problem!
Control Flow Guard (CFG) is used to protect against exploits. Two terabytes are reserved as a bitmap, which indicates valid indirect transitions in the 128-terabyte user mode address space. Therefore, I changed my virtual memory scanner to calculate how many blocks are in the CFG region (just search for a 2 TB reservation), and how many blocks are marked as executable. Since CFG memory is used to describeexecutable memory, I expected to see in the process one CFG memory block for each block of executable memory. Instead, I saw 98 blocks of executable memory and 24,866 blocks of fixed CFG memory. Significant discrepancy:
With hindsight, this seems obvious, but what if the CFG bitmap is never cleared? What if memory is allocated in the CFG bitmap when allocating executable memory, but not released when the executable memory is released? Then this behavior is understandable.
The next step is to write a VAllocStress program that allocates and frees thousands of blocks of executable memory at random addresses. For this executable, the 64-bit CFG mode should work, and there were some difficulties, because I really didn’t know what I was trying to do, but it all worked. After allocating and releasing this number of blocks of executable memory, the program should sit in a loop, from where it occasionally tries to allocate / release more executable memory, and watches when this process slows down. Here is the basic algorithm for VAllocStress:
That's all. Very simple. And it was so nice when it worked. I ran the program, and then instructed VirtualScan to scan the VAllocStress process. It quickly became clear that the CFG block is terribly fragmented, and scanning takes a very long time. And my VAllocStress program crashed while scanning!
At this point, I modeled CFG fragmentation, a long scan time, and a hang. Hooray!
It turns out that the CodeRange objects are used in the v8 JavaScript engine to control the code generator, and each CodeRange object is limited to a 128 MB address range . It would seem that this is a small enough volume to avoid the uncontrolled distribution of CFG, which we observe.
But what if you have several CodeRange objects, and they are distributed to random addresses, and then released? I set up the CodeRange designer, left Gmail to work - and found the culprit. Every couple of minutes a new CodeRange object was created (and destroyed). In the debugger, it is easy to see how WorkerThread :: Start selects these objects. And then the puzzle has developed:
The slow CFG memory scan was actually fixed in Windows 10 RS4 (updated from April 2018), which made me think for a while if there was any point in this whole investigation. It turns out there was.
CFG reservations begin with a simple reservation of addresses — no memory is actually allocated. But as the executable pages are allocated, part of the CFG reservation becomes converted memory using real memory pages. And these pages are never released. If you continue to allocate and free randomly located blocks of executable memory, the CFG area can become infinitely large! Well, that's not entirely true. A CFG memory block is limited to a cache of a certain size. But it is not comforting if the limit is 2 TB per process !
The worst thing I've seen so far is when my Gmail tab worked for eight days and accumulated 353.3 MB of CFG memory and 59.2 MB of page tables to display this memory, for a total of about 400 MB. For some reason, most people have no such problems or they are much softer than mine.
The v8 command (JavaScript engine in Chrome) changed the code so that it reuses addresses for CodeRange objects , which rather well fixes this problem. Microsoft has already fixed performance issues with CFG memory scanning. Maybe someday Microsoft will release the CFG regions as the executable memory is released, at least in the simple cases when large address ranges are released. And the vmmap bug is also in processing.
Most of the users and my colleagues never noticed this problem. I noticed her only because:
It seems very unlikely that, as one of the most qualified people to diagnose this error, I was the first to notice it. If you remove any of the above factors, then you may never have noticed a freeze or memory loss associated with it.
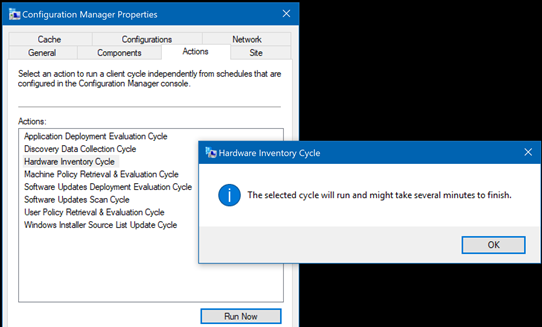
By the way, the hangs happened exactly at 10:30 in the morning just because it was at this time that our IT department ran the corresponding scan. If you want to start a manual scan, you can go to Control Panel → Configuration Manager → Actions , select Hardware Inventory Cycle and click Run Now .
If you want to play, the source code for the VAllocStress and VirtualScan is on Github .
There are a lot of nuances in this investigation . Some of them are important (page tables), some instructive (locks), and some turned out to be a waste of time (WMI details). In the next article I will tell you more about them and about the vmmap error. If you want more bloody details - some of which turned out to be incorrect or irrelevant - you can follow the investigation at crbug.com/870054 .
UPD. The second part of
It is difficult to resist the opportunity to conduct a good investigation, but in this case the challenge is especially strong. After all, I'm working on Google to improve the performance of Chrome for Windows. Discover the cause of the hang - my job. And after a lot of false starts and hard efforts, I still managed to figure out how Chrome, Gmail, Windows and our IT department together prevented me from typing an email. Along the way, I found a way to save a significant amount of memory for some web pages in Chrome.
The investigation turned out to have so many nuances that I will leave some for another article , and now I will fully explain the reasons for the suspensions.
As usual, UIforETW works with me in the background and monitors cyclic buffers, so all that remained was to enter Ctrl + Win + R - and the buffers of the system were saved to disk in about the last thirty seconds. I downloaded them to the Windows Performance Analyzer (WPA), but could not finally install the hang.
When the Windows program stops transmitting messages, ETW events are issued indicating where exactly this happened , so these types of hangs are trivial to find. But, apparently, Chrome continued to transmit messages. I looked for the moment when one of the key streams of Chrome either entered the active cycle, or was completely idle, but found nothing obvious. There were some places where Chrome is mostlyidle, but even then all key streams continued to work, so it was impossible to be sure where the hangup occurred - Chrome could idle simply in the absence of events:
UIforETW has a built-in keylogger, which is often useful in identifying key points in the trace. However, for obvious security reasons, by default it anonymizes keystrokes, regarding each entered number as “1” and every letter as “A”. This makes it difficult to find the exact time of the hang, so I changed the type of tracing from “private” to “full” and waited for the hang. At about 10:30 the next morning the hangup repeated. I saved the trace buffers and saved this mark in the UIforETW trace information field:He typed “put aside for those who have more experience with scuba diving” - and Gmail hung at the end of the word “those”, and then resumed work in the area of the word “experience”. Gmail tab with PID 27368.
This is a common discussion of how to get to the office , but it is important that there is now a way to find a hang in the ETW trace. I load the trace, look at the keylogger data in the Generic Events field (events are issued by UIforETW, and each is a purple diamond in the screenshot below) - and I immediately see where the hang occurred, which is clearly correlated by the failure in using CPU:
Good, but why Chrome stopped? Here are some hints: the screenshots do not show that every time WmiPrvSE.exe fully uses the hyper- thread CPU. But that shouldn't matter. In my machine, there are 24 cores / 48 threads, so the consumption of one hyperflow means that the system is still 98% free.
Then I approached a clearly important period when Chrome was idle - and looked, in particular, at the CrRendererMain process in chrome.exe (27368) corresponding to the Gmail tab.
Note: I want to say thank you to myself from 2015 for requesting Microsoft to improve the naming mechanisms for threads, and thanks to Microsoft for implementing all of the suggestions - the names of the threads in WPA are just great!
The problem has cleared up. Within 2.81 seconds of hangup, this thread was launched according to the schedule 440 times. Usually, running every 6 ms is enough to make the program responsive, but for some reason this did not happen. I noticed that every time he woke up, I was on the same stack. If you simplify:
chrome_child.dll (stackbase)
KernelBase.dll!VirtualAllocntoskrnl.exe!MiCommitVadCfgBitsntoskrnl.exe!MiPopulateCfgBitMapntoskrnl.exe!ExAcquirePushLockExclusiveExntoskrnl.exe!KeWaitForSingleObject (stackleaf)
Chrome calls VirtualAlloc, which tries to update some “CfgBits” and should get a lock. At first, I assumed that Chrome called VirtualAlloc 440 times, which seems odd. But the reality was even stranger. Chrome called VirtualAlloc once - and had to get a lock. Chrome signaled the blocking availability, but - 439 times in a row - when Chrome woke up and tried to get the lock, it turned out to be unavailable. The blocking was obtained again through the process mentioned above.
This is because Windows locks are inherently unfair - and if the thread releases the lock and then immediately requests it again, it can receive it forever. Hunger. More on this next time.
In each In the case of a process that signals Chrome to take a lock, there was a WmiPrvSE.ehe, releasing the lock on this stack:
ntoskrnl.exe!KiSystemServiceCopyEnd (stack base)
ntoskrnl.exe!NtQueryVirtualMemory
ntoskrnl.exe!MmQueryVirtualMemory
ntoskrnl.exe!MiUnlockAndDereferenceVad
ntoskrnl.exe!ExfTryToWakePushLock (stack leaf)
It took some time to parse in WMI (more on that next time), but in the end I wrote a program to recreate the behavior of WMI. I had CPU sampling data that showed what WmiPrvSE.exe is spending time on (in simplified form with some edits):
WmiPerfClass.dll!EnumSelectCounterObjects (stack base)
WmiPerfClass.dll!ConvertCounterPath
pdh.dll!PdhiTranslateCounter
pdh.dll!GetSystemPerfData
KernelBase.dll!blah-blah-blah
advapi32.dll!blah-blah-blah
perfproc.dll!blah-blah-blah
perfproc.dll!GetProcessVaData
ntdll.dll!NtQueryVirtualMemory
ntoskrnl.exe!NtQueryVirtualMemory
ntoskrnl.exe!MmQueryVirtualMemory
ntoskrnl.exe!MiQueryAddressSpan
ntoskrnl.exe!MiQueryAddressState
ntoskrnl.exe!MiGetNextPageTable (stack leaf)
Playing back the slow scan from the sample data was pretty easy. An interesting part of the call stack above was NtQueryVirtualMemory , which is used to scan the process memory and is called appropriately named GetProcessVaData , where Va probably represents the virtual address. My VirtualScan program simply called NtQueryVirtualMemory in an obvious loop to scan the address space of the specified process, the code worked very long to scan the Gmail process (10-15 seconds) - and caused it to hang. But why?
The advantage of a handwritten scan cycle is that you can generate statistics. NtQueryVirtualMemoryreturns data for each adjacent range of address space with corresponding attributes. Such can be "everything is reserved", "everything is fixed with certain protection settings", etc. There were about 26,000 of these blocks in the Gmail process, but I found another process (as it turned out, this is WPA ) with 16,000 memory blocks, which was scanned very quickly.
At some point, I looked at the Gmail process using vmmap and noticed that the Gmail process takes up a lot of memory (361,836 KB) and many separate blocks (49,719) coming from a single source of reserved shared memory - a source of 2,147,483,648 in size KB, that is 2 TB. What?
I knew that a 2 TB backup is used for Control Flow Guard(CFG), and remembered that “CFG” did appear in the call stacks, where the Gmail process in Chrome was waiting — MiCommitVadCfgBits was on the stack . Maybe a large number of blocks in the CFG region was a problem!
Control Flow Guard (CFG) is used to protect against exploits. Two terabytes are reserved as a bitmap, which indicates valid indirect transitions in the 128-terabyte user mode address space. Therefore, I changed my virtual memory scanner to calculate how many blocks are in the CFG region (just search for a 2 TB reservation), and how many blocks are marked as executable. Since CFG memory is used to describeexecutable memory, I expected to see in the process one CFG memory block for each block of executable memory. Instead, I saw 98 blocks of executable memory and 24,866 blocks of fixed CFG memory. Significant discrepancy:
Scantime, Committed, pagetables, committedblocksTotal: 41.763s, 1457.7MiB, 67.7MiB, 32112, 98 codeblocksCFG: 41.759s, 353.3MiB, 59.2MiB, 24866vmmap shows redundancy and allocated memory as blocks, and my scanning tool counts only allocated blocks — which is why vmmap shows 49,684 blocks, and my tool 24,866
With hindsight, this seems obvious, but what if the CFG bitmap is never cleared? What if memory is allocated in the CFG bitmap when allocating executable memory, but not released when the executable memory is released? Then this behavior is understandable.
Play from start to finish
The next step is to write a VAllocStress program that allocates and frees thousands of blocks of executable memory at random addresses. For this executable, the 64-bit CFG mode should work, and there were some difficulties, because I really didn’t know what I was trying to do, but it all worked. After allocating and releasing this number of blocks of executable memory, the program should sit in a loop, from where it occasionally tries to allocate / release more executable memory, and watches when this process slows down. Here is the basic algorithm for VAllocStress:
- Multiple cycle:
- Allocate executable memory using VirtualAlloc at a random address.
- Free up memory.
- Then an infinite loop:
- Sleep mode for 500 ms (I don’t want a pig to grab the processor).
- Allocate a bit of executable memory with VirtualAlloc at a given address.
- Displays a message if the call to VirtualAlloc takes more than ~ 500 ms
- Free up memory.
That's all. Very simple. And it was so nice when it worked. I ran the program, and then instructed VirtualScan to scan the VAllocStress process. It quickly became clear that the CFG block is terribly fragmented, and scanning takes a very long time. And my VAllocStress program crashed while scanning!
At this point, I modeled CFG fragmentation, a long scan time, and a hang. Hooray!
Root cause
It turns out that the CodeRange objects are used in the v8 JavaScript engine to control the code generator, and each CodeRange object is limited to a 128 MB address range . It would seem that this is a small enough volume to avoid the uncontrolled distribution of CFG, which we observe.
But what if you have several CodeRange objects, and they are distributed to random addresses, and then released? I set up the CodeRange designer, left Gmail to work - and found the culprit. Every couple of minutes a new CodeRange object was created (and destroyed). In the debugger, it is easy to see how WorkerThread :: Start selects these objects. And then the puzzle has developed:
- Gmail uses service workers , probably to implement offline mode.
- They appear and disappear every few minutes, because service workers behave this way.
- Each worker thread gets a temporary CodeRange object that allocates some executable pages for JITted JavaScript code from a random location in the 47-bit process address space.
- When allocating new code pages, recordings are made in the CFG memory reservation of 2 TB.
- CFG distributions are never released.
- NtQueryVirtualMemory painfully slowly scans CFG memory (about 1 ms per block) for reasons I don’t understand.
The slow CFG memory scan was actually fixed in Windows 10 RS4 (updated from April 2018), which made me think for a while if there was any point in this whole investigation. It turns out there was.
Memory
CFG reservations begin with a simple reservation of addresses — no memory is actually allocated. But as the executable pages are allocated, part of the CFG reservation becomes converted memory using real memory pages. And these pages are never released. If you continue to allocate and free randomly located blocks of executable memory, the CFG area can become infinitely large! Well, that's not entirely true. A CFG memory block is limited to a cache of a certain size. But it is not comforting if the limit is 2 TB per process !
The worst thing I've seen so far is when my Gmail tab worked for eight days and accumulated 353.3 MB of CFG memory and 59.2 MB of page tables to display this memory, for a total of about 400 MB. For some reason, most people have no such problems or they are much softer than mine.
Decision
The v8 command (JavaScript engine in Chrome) changed the code so that it reuses addresses for CodeRange objects , which rather well fixes this problem. Microsoft has already fixed performance issues with CFG memory scanning. Maybe someday Microsoft will release the CFG regions as the executable memory is released, at least in the simple cases when large address ranges are released. And the vmmap bug is also in processing.
Most of the users and my colleagues never noticed this problem. I noticed her only because:
- I had offline Gmail enabled.
- I worked on the old version of Windows 10.
- Our IT department regularly performs WMI scans of our computers.
- I was attentive.
- I was lucky.
It seems very unlikely that, as one of the most qualified people to diagnose this error, I was the first to notice it. If you remove any of the above factors, then you may never have noticed a freeze or memory loss associated with it.
By the way, the hangs happened exactly at 10:30 in the morning just because it was at this time that our IT department ran the corresponding scan. If you want to start a manual scan, you can go to Control Panel → Configuration Manager → Actions , select Hardware Inventory Cycle and click Run Now .
Source
If you want to play, the source code for the VAllocStress and VirtualScan is on Github .
Nuances
There are a lot of nuances in this investigation . Some of them are important (page tables), some instructive (locks), and some turned out to be a waste of time (WMI details). In the next article I will tell you more about them and about the vmmap error. If you want more bloody details - some of which turned out to be incorrect or irrelevant - you can follow the investigation at crbug.com/870054 .
UPD. The second part of