Analysis of binary options charts or how I once again proved to myself that freebies do not exist
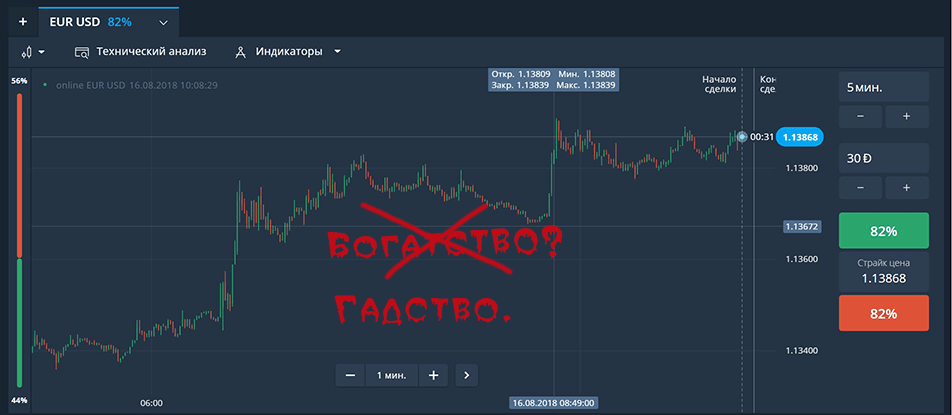
Recently, I stumbled upon an entertaining video from the category of "To quickly become rich you need only ...". The video begins with a pathetic recalculation of a solid wad of money and a demonstration of a decent bill. Next, the guy shows a strategy that is based on the phrase "Well, look at the chart, here it is clear."
However, I am a modest person, and therefore I decided before going after my Lard to first check this strategy mathematically and programmatically. Below you can see what came of it.
I will first describe “Strategy” (I'm not sure that I can drop the link to the video here, but I will do it in the comments if necessary). The guy suggested that we switch the chart to the Japanese candles and then just put on the same course as the previous candle was closed. That is, if the last segment of 5 minutes was closed in a minus, then now we put on a minus. In the case of losing the next time double the bet.
Eh, how I like martingales with smart strategies . But let's get down to business.
Let's start with the task decomposition:
- You need to write a script that converts the graph into a string of the type OOGGO, where O is Orange, G is Green. That is, the fall and growth.
- Next, you need to simulate a strategy on this line and collect statistics.
- Analyze the results and make a conclusion.
Writing graphics analyzer
The graph on the site is an SVG element. Of course, we can analyze it right there, but for a start I would prefer to work in my own project. In the end, we would first be convinced of the effectiveness of the strategy, and only then write a robot, which will click our farm to farm our "wealth"
Comments immediately after the code.
functionturnToString(img) {
	var canvas = document.createElement('canvas'); //(1)var ctx = canvas.getContext('2d');
	canvas.width = img.width;
	canvas.height = img.height;
	ctx.drawImage(img, 0, 0, img.width, img.height);
	img.remove();
	document.body.appendChild(canvas);
	var result = [];
	var isLocked = false;
	var imgData = ctx.getImageData(0,0,canvas.width,canvas.height).data;
	for(var i = 0;i<canvas.width;i++) {
		var mainColor = "N";
		for(var j = 0;j<canvas.height;j++) { //(2)var colorIndexes = getColorIndexes(i,j,canvas.width);
			var redPartIndex= colorIndexes[0];
			var greenPartIndex= colorIndexes[1];
			if (imgData[redPartIndex] > 120) {
				mainColor = "O";
				break;
			}
			if (imgData[greenPartIndex] > 120) {
				mainColor = "G";
				break;
			}
		}
		if (isLocked == false && mainColor == "G") { //(3)
			result.push("G");
			isLocked = true;
		}
		if (isLocked == false && mainColor == "O") {
			result.push("O");
			isLocked = true;
		}
		if (mainColor == "N") {
			isLocked = false;
		}
		console.log("Yet another line")
	}
	return result.join("");
}
The getColorIndexes code that receives the color indices of the desired pixel.
functiongetColorIndexes(x,y,width) {
	var R = 4*(width*y + x);
	return [R,R+1,R+2];
}
Let me remind you, the Uint8ClampedArray array returned by the getImageData function is just a set of colors and alpha pixel channels in a row. It may contain millions of positions, but you don’t have to worry about the speed of work, because Google has great guys who made a data structure processing machine from V8.
It's simple.
1) Replace the picture on the canvas. Feel free to intervene in the DOM, because This is a local project, and in this form it will not be able to migrate anywhere.
2) Iterate through an array of pixels in columns. We look at the red and green pixel components in KGB RGB. If they exceed a certain level (With a large margin), then we stop the passage through the column. Main color assign the desired letter.
3) We look whether this candle has already been taken into account. Sign uchtonnosti believe isLocked equal to true . If the color was not detected and the variable retained the initial value “N”, then we came across a gap between the candles, which means that it is necessary to reset the isLocked value
Profit! Now we can load the chart!

I even brought the results under the appropriate candles and, as we can see, everything works in the normal mode.
Emulate strategy
We turn to the second part. Now our task is to pass the resulting string through the function that will emulate this strategy.
functionbasicProfitAnalisis(mask) {
	var maskInUse = mask;
	var result = [0,0];
	var currentBet = 50;
	var baseBet = 50;
	var maxBet = baseBet;
	var totalSum = 0;
	var multiplier = 0.82;
	for(var i = 1;i<maskInUse.length;i++) {
		if (maskInUse[i] == maskInUse[i-1]) {
			result[0]++; //Счетчик побед.
			totalSum += currentBet*multiplier;
			currentBet = baseBet;
		} else {
			result[1]++; //Счетчик поражений.
			totalSum -= currentBet;
			currentBet *= 2;
			if (currentBet > maxBet) {
				maxBet = currentBet;
			}
		}
	}
	document.getElementById("betsWon").innerHTML += result[0];
	document.getElementById("betsLost").innerHTML += result[1];
	if (totalSum >= 0) {
		document.getElementById("pureChange").innerHTML += `<font
                color='green'>${totalSum}</font>`;
	} else {
		document.getElementById("pureChange").innerHTML += `<font color='red'>${totalSum}
                </font>`;
	}
	document.getElementById("maxBet").innerHTML += maxBet;
	setCookie("totalSum", parseInt(getCookie("totalSum"))+totalSum, 365);
}
This code is quite simple. We are iterating on the received line, starting from the second character. Each time we compare the current character with the previous one. If it is not equal to it, then we lost - we deduct the amount of the bet from the current change in the initial amount and double the bet. If we won, we add to the change the rate multiplied by the coefficient (The largest on this site is 0.82, and we take it) and reset the rate to the base level. Then we simply print the result and add the amount to the cookie, so as not to count it manually.
We also remember that mathematics and Probability Theory like to joke . Very fond of joking . Well, love to joke . That is why we keep a record of the maximum rate through maxBet (This is probably the most interesting item of statistics that may surprise you. Or maybe not).
Well, let's launch the same schedule, on which we checked the correctness of the analyzer function.

Hm A little unlucky, it happens. Still.

What does it say? Second time - a coincidence?
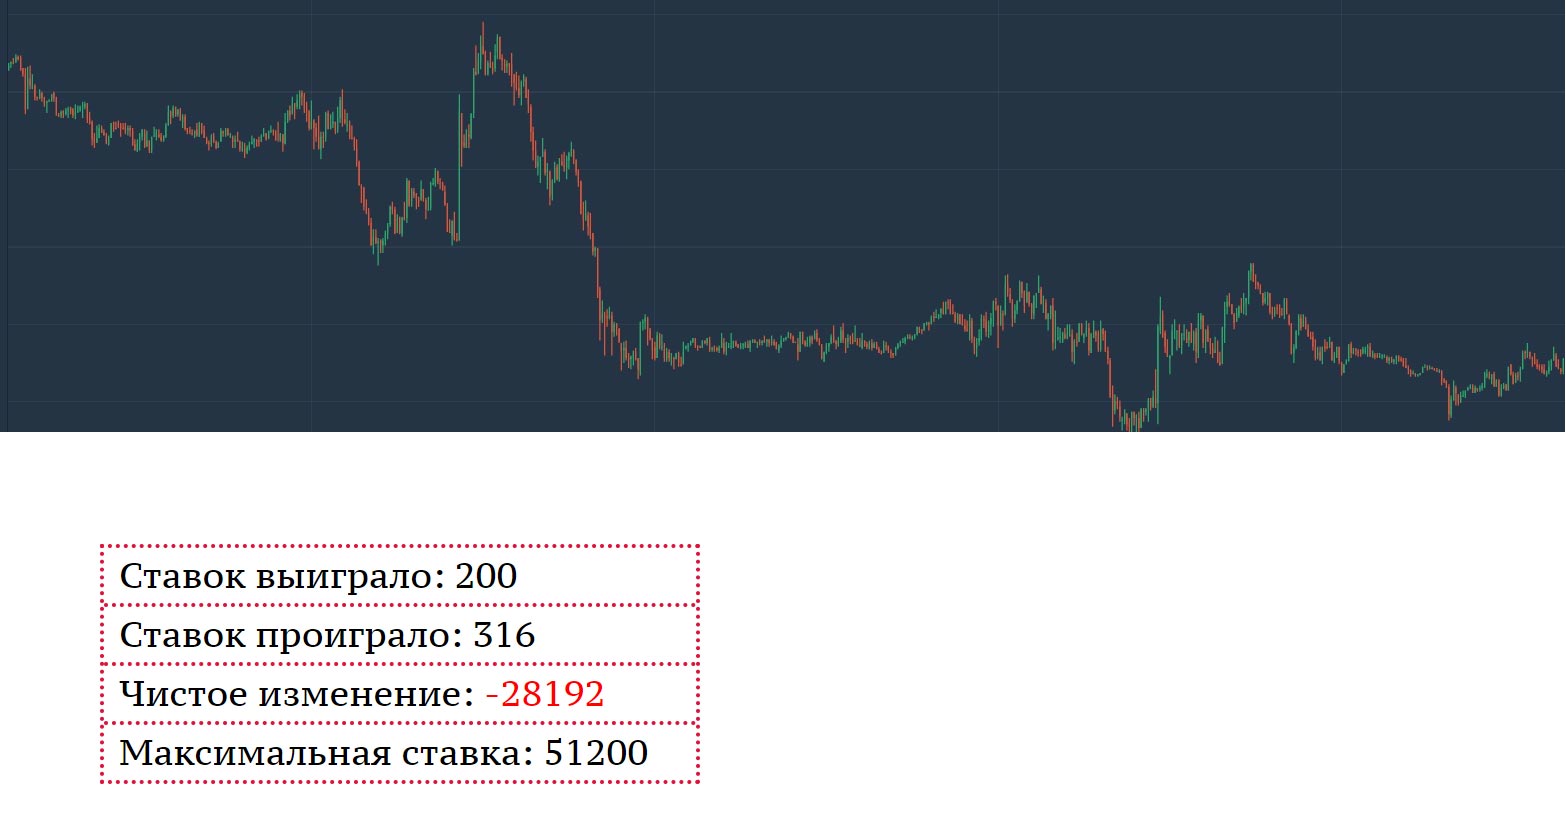
The third seems to be a pattern ... But, of course, I just have no luck. As always.
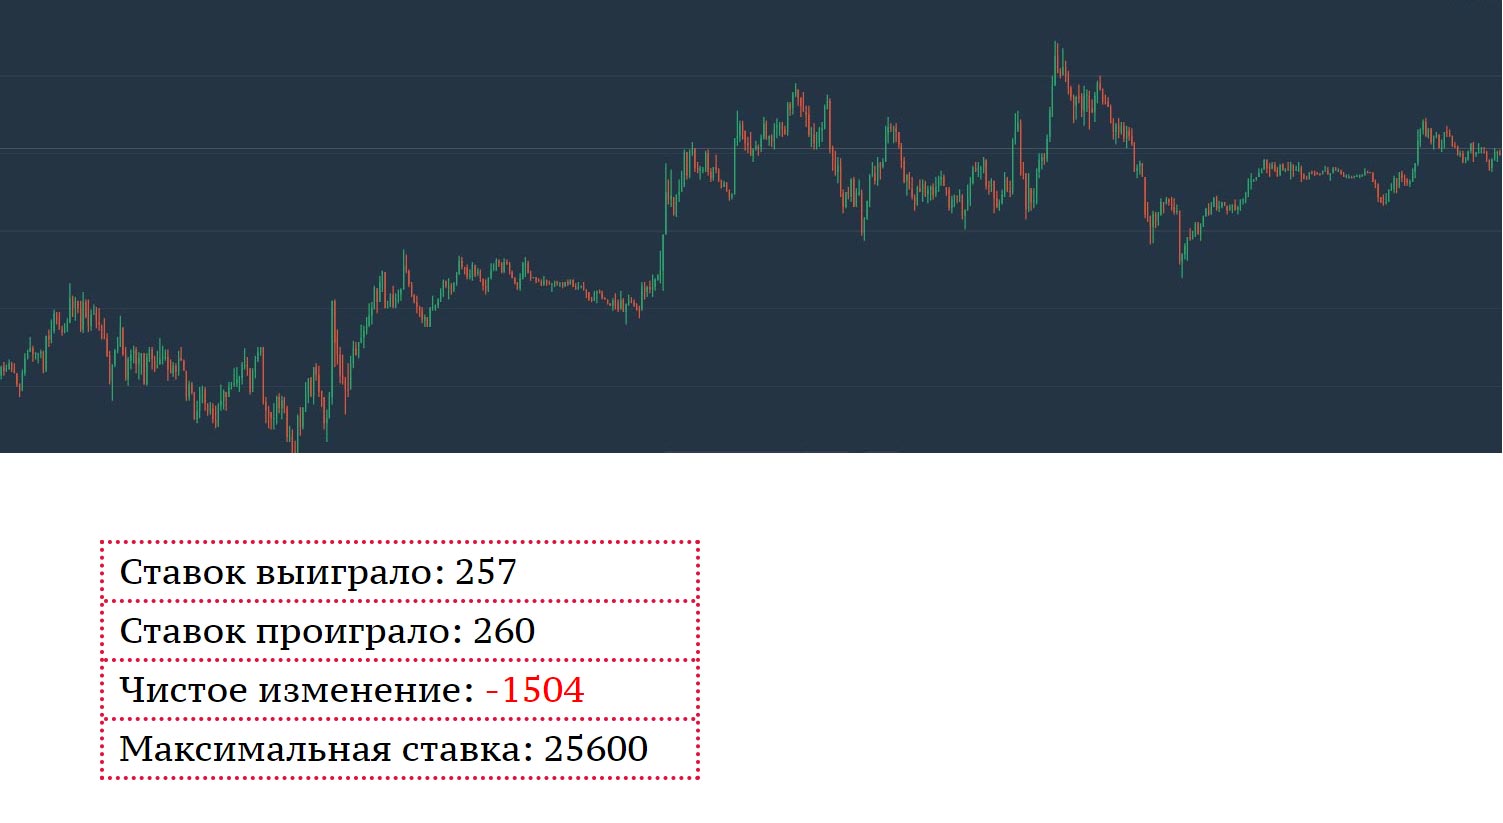
But he showed the money, but he could not lie.
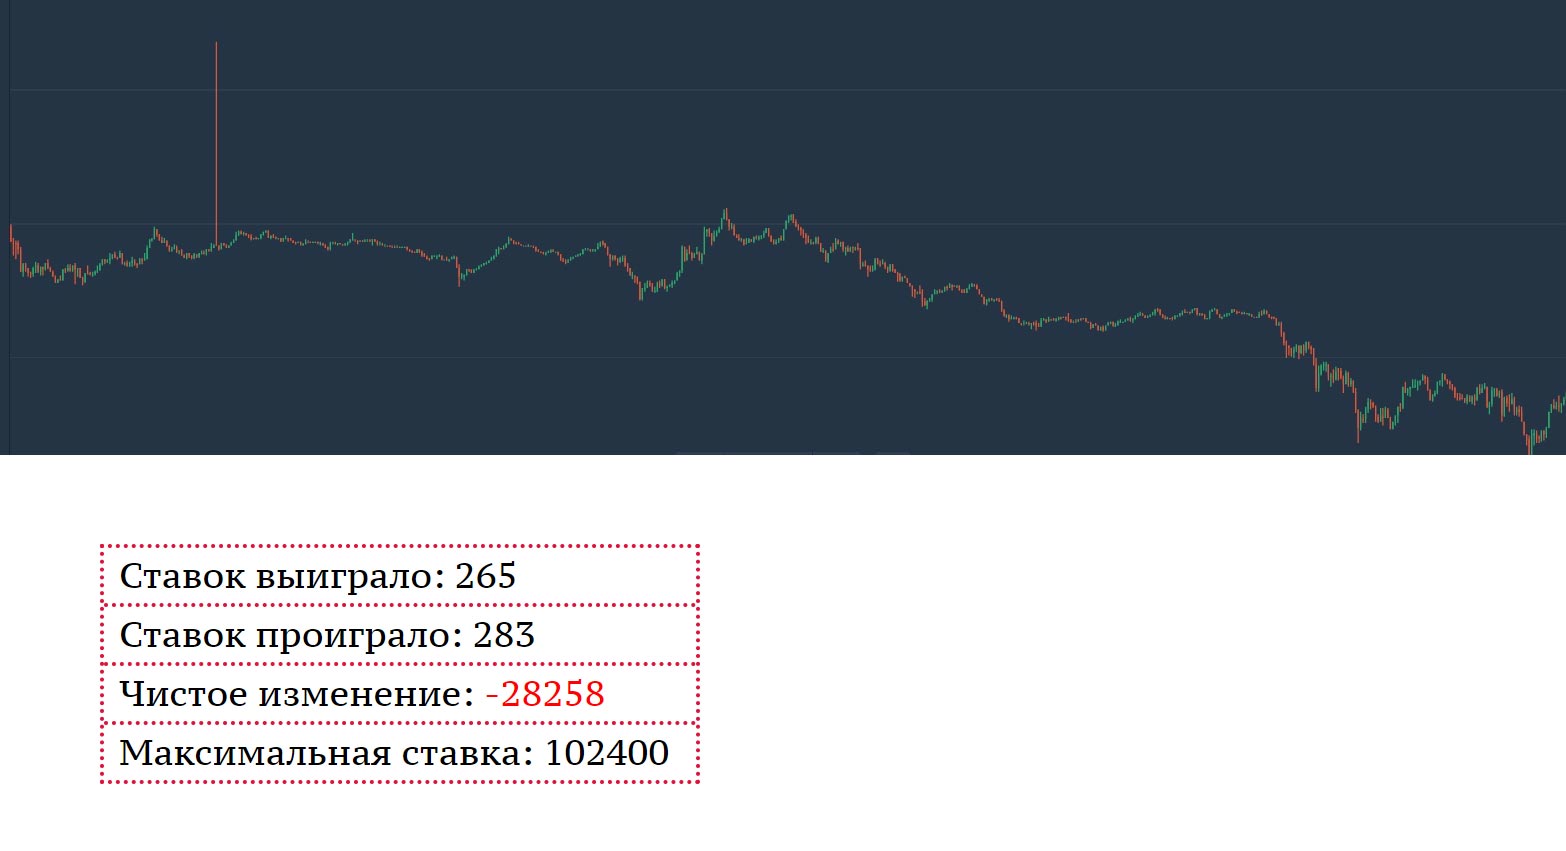
Or maybe he made money from people like me?
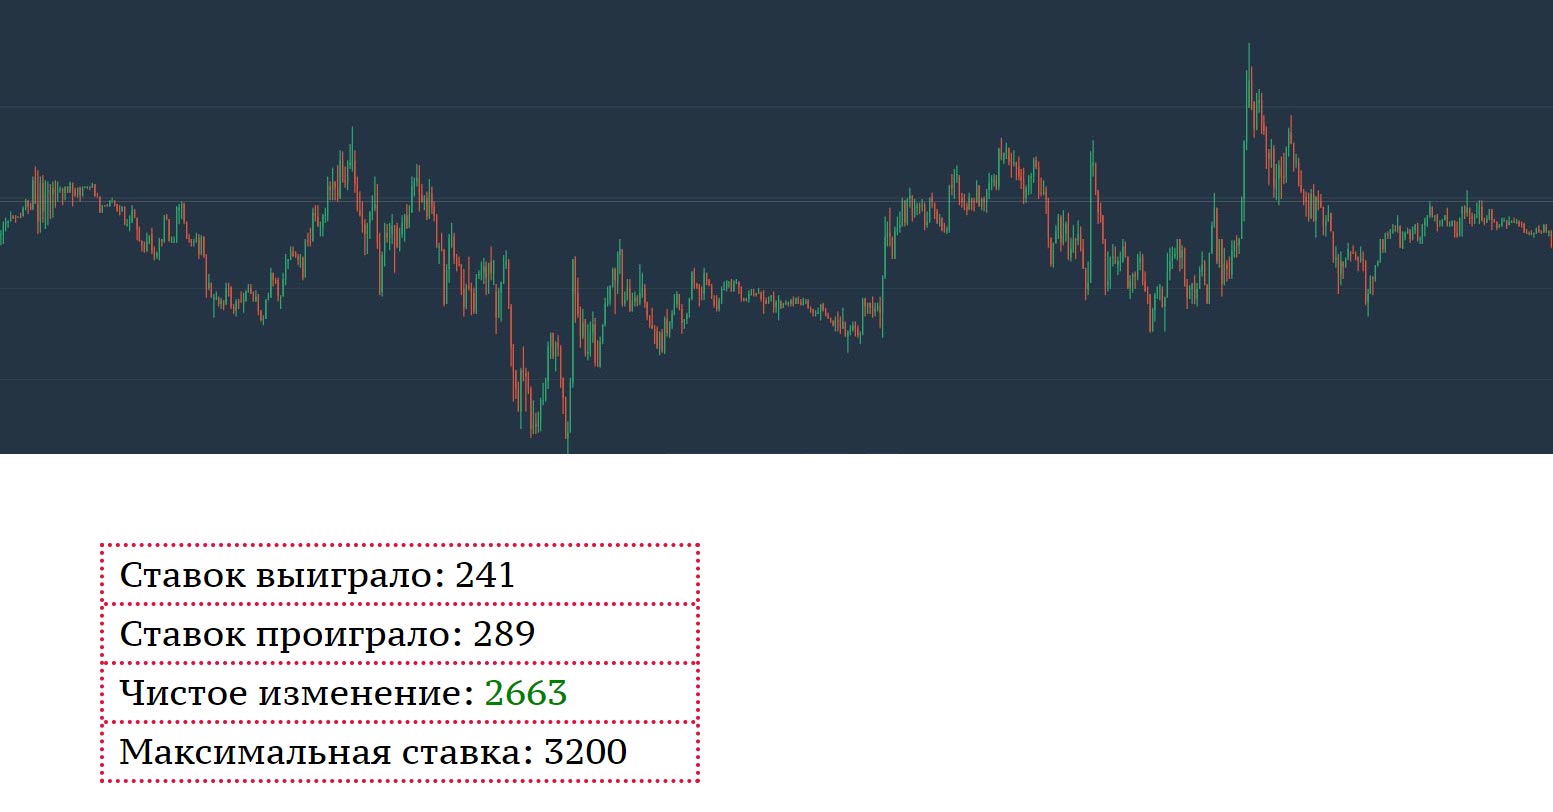
ABOUT! Everyone saw? The chakra of luck has opened. Now here's a little more play and go to choose a mansion and a wife - a model.
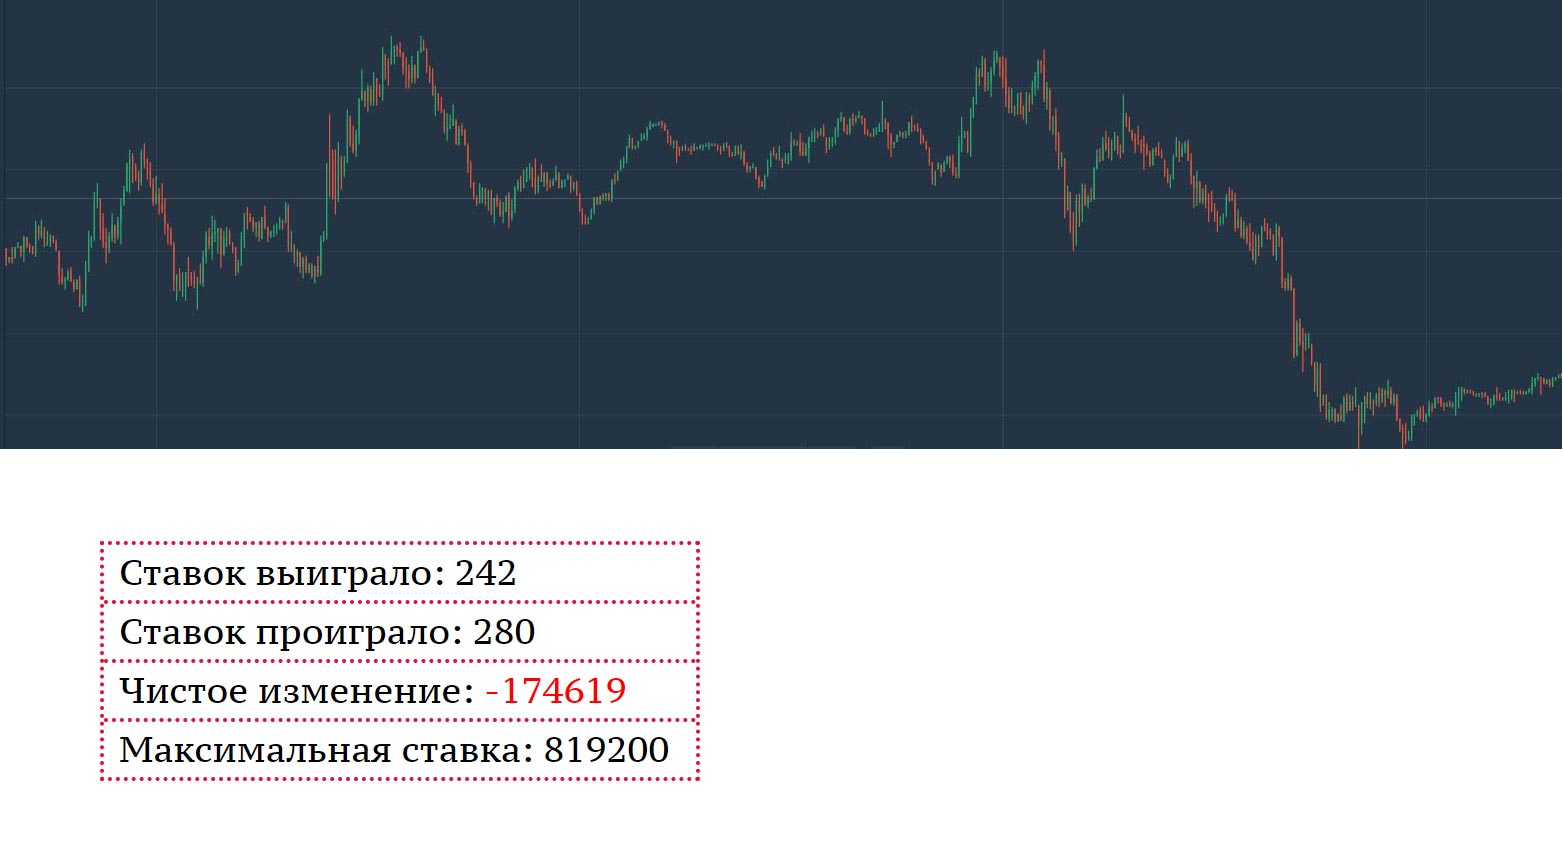
You know, money is not the main thing.
Statistics and conclusions.
Understandably, I can’t download all the tests I’ve performed here, but here’s the statistics for the last 10:
- Positive tests: 1 out of 10.
- Won money: 2663.
- Change the initial amount for an infinitely large account: -274484.
- Maximum bet: 819,200 (!!!).
На самом деле, рынок в стабильной стадии — это настолько сложная структура, где на ценообразование может оказывать влияние то, какой пастой чистит зубы Сатья Наделла, что на таких коротких промежутках, как 5 минут, можно вообще говорить о случайности. А у случайности, простите, вообще трудно выигрывать.
То есть в данном случае мы имеем чистую стратегию Мартингейла. Однако по этой стратегии нельзя выигрывать. Это не философский камень. Играя по ней достаточно долго, мы просто перераспределяем движение денег так, что выигрываем очень часто, но мало, а проигрываем редко, но много. В лучшем случае матожидание такой системы равно 0. Однако же в рулетке, например, существует помимо красного и черного еще и зеро, что снижает шанс угадать цвет до 48.65% (Зеро — 2.7%). У трейдеров тоже есть своё «Зеро» — коэффициент. Он сильно разнится от актива к активу. Я взял максимальный — 0.82 для курса доллар/евро. Однако даже с ним выход в плюс становится невозможным.
Уже сам тот факт, что казино или любая подобная организация существует, говорит нам о том, что в среднем компания получает больше денег, чем отдает.
But how so? because it looked so believable on the video! Yes, it looked. Just as the plane looks like the most dangerous form of transport for most. Or how tasks tend to look simple and obvious after the fact. Alas, but with such a sheet of only confirmed cognitive distortions, a person is a very mediocre observer. That is why we formalize various processes, invent strict algorithms, actively cooperate with the computer in solving problems.
We all want to believe that somewhere there is a way to earn money and / or fame, doing nothing, and our brain only helpfully draws to us a picture of the world in which it is real. We literally want to be cheated.
The system will not be able to exist if it does not have mechanisms of self-support and regulation. We all know for a long time why it is impossible to print a lot of money for everyone. Such a system would simply collapse! Therefore, you can not become rich, lying on the couch. You have to convert your time, energy and motivation into what you want.
This is such a simple truth, but most still believe in countless fraudulent and fraudulent schemes, casinos and lotteries.
Попрошу особенно отметить, я не сказал, что на тех же бинарных опционах невозможно заработать. Я лишь имел ввиду, что не существует в природе легких стратегий для этого. Вы сможете стабильно зарабатывать только если научитесь проводить тех. анализ, будете иметь набор компаний, с акциями которых вы близко знакомы (У разных компаний свои особенности движения акций), будете уметь управлять рисками… Можно ли всему этому научиться быстро? А самолет можно научиться садить за пару дней?
Также попрошу отметить, что я всего лишь новичок как в вашем сообществе, так и вообще в программировании, а потому прошу нещадно тыкать лицом во все сколь бы то ни было серьезные изъяны. Впрочем, не думаю, что вам нужно приглашение :)
And finally, about cognitive distortions.
