Spectral analysis at home
- Tutorial
Friends are approaching Friday evening, this is a wonderful intimate time when, under the cover of alluring dusk, you can get your spectrometer all night, measure the incandescent lamp spectrum before the first rays of the rising sun, and when the sun rises measure its spectrum.
How do you still not have your spectrometer? It’s not a problem if we go under the cut and correct this misunderstanding.
Attention! This article does not pretend to be a full-fledged tutorial, but it is possible within 20 minutes after reading it you will expand your first radiation spectrum.

I will tell you in the order in which I went through all the stages myself, we can say from worst to best. If someone is aimed immediately at a more serious result, then half of the article can be safely skipped. Well, for people with crooked hands (like mine) and just curious it will be interesting to read about my ordeals from the very beginning.
A lot of materials are walking on the Internet on how to assemble a spectrometer / spectroscope yourself from improvised materials.
In order to acquire a spectroscope at home, in the simplest case, you will not need much at all - a CD / DVD disc and box.
This material prompted me to my first experiments in studying the spectrum - Spectroscopy
Actually, thanks to the author’s achievements, I assembled my first spectroscope from a transmission diffraction grating of a DVD disc and a cardboard box made of tea, and before that I had enough of a dense piece of cardboard with a slot and transmission gratings from a DVD disc.
I can’t say that the results were stunning, but I managed to get the first spectra, miraculously saved photos of the process under the spoiler
Alternatively, you can do it differently , use a reflective layer or use a matchbox and blades.
Well, suppose you already looked at the spectra of everything that shines in your house.
There is a logical development of the situation. How now to research what they got?
Here, again, several options will come to our aid at once. The first thing I found on the subject of spectral analysis was the development of a foreign scientist - Cell Phone Spectrophotometer, which suggests using the assembled spectroscope, a mobile phone camera and free software written by the author as an spectrometer. An interesting system, but due to the lack of components at hand, the system itself I did not begin to collect, but I used only the software and the previously captured spectra.
Oddly enough, but the use of software (CellPhoneSpec.exe) caused some difficulties for me and my colleague, for the most part I have empirically figured out how it works, I still hope that I understood correctly, in any case even if not, then at the end of the article I will give an option that works ironically. In the meantime, a little about CellPhoneSpec.
My instruction is more like dancing with a tambourine, but still.
To work with the program, we need a sample of the full spectrum and a photo of the captured experimental spectrum, well, and then in order:
0) It is advisable to put all the photos in one folder to the .exe file of the program for convenience
1) Open the program, select a picture with a full spectrum sample in the reference field , in the sample field, select a sample photo
2) Click on the extreme blue section of the reference dialog pops up - select “blue end”, click on the red end of the spectrum and select “red end”, respectively, well, we will do the same for the tab with the sample.
3) It would seem that’s all let's get the graphics going, but some error constantly pops up,
I treat it like this. In the spectrum parameters fields, delete the values after the point and the point inclusive, well, let's just do 720 from 720.0 and press enter and so on for all values, after that in the sample field I select the same figure again that I put in the beginning and then the Make Plot button lights up for a miracle
4) Click Make Plot to get the graphics of the three channels (RGB) and the total. Received data can be saved in CSV
I can’t say how reliable this method is, but the graphs obtained poorly can be correlated with my expectations and with the graphs obtained using SpectralWorkbench. , but I still will not argue that the technique described by me is 100% correct (I did not particularly delve into the author's instructions).
In view of the uncertainty in the quality and not particularly convenient for obtaining the results of spectral analysis obtained earlier, I turned to my talented friend and colleague DrZugrik for help .
And this golden man with straight arms gathered me a wonderful spectroscope.
He took as a basis the development of the PublicLab.org project (assembly instructions), which was previously mentioned on the open spaces of Habr.
The only thing for my convenience, he modified this design with a USB video camera, it turned out like this:
I must say right away that this modification saved me from having to use a mobile phone’s camera, but there was one drawback: the camera could not be calibrated for the settings of the Spectral Worckbench service (which will be discussed below). Therefore, I was not able to capture the spectrum in real time, but to recognize already collected photographs completely.
So let's say you bought or assembled a spectroscope according to the instructions above.
After that, create an account in the PublicLab.org project and go to the SpectralWorkbench.org service page. Next I will describe to you the spectrum recognition technique that I used.
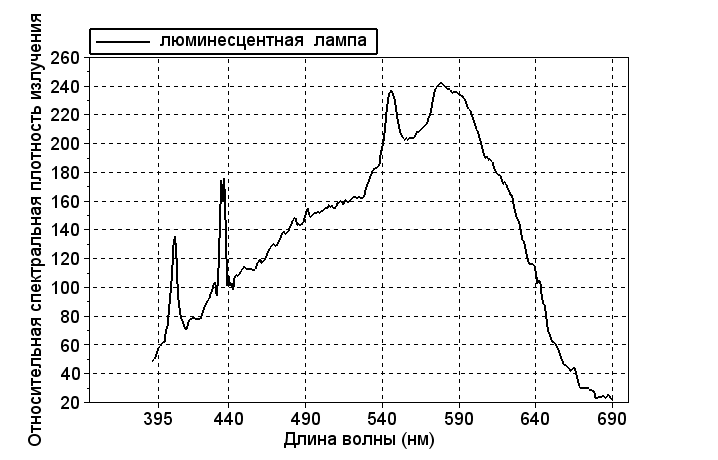
To begin with, we will need to calibrate our spectrometer. To do this, you will need to get a snapshot of the spectrum of the fluorescent lamp, preferably a large ceiling, but an energy-saving lamp is also suitable.
1) Press the Capture spectra button
2) Upload Image
3) Fill in the fields, select the file, select new calibration, select the device (you can choose a mini spectroscope or just custom), choose which spectrum you have vertical or horizontal, so that the spectra in the previous screenshot are clear programs - horizontal
4) A window with charts will open.
5) We check how your spectrum is rotated. On the left there should be a blue range, on the right - red. If it’s not so, select the more tools - flip horizontally button, after which we see that the image has rotated and the graph is gone, so click more tools - re-extract from foto, all the peaks correspond to the real peaks again.
6) Click the Calibrate button, click begin, select the blue peak directly on the chart (see screenshot), click LMB and the popup window opens again, now we need to click finish and select the extreme green peak, after which the page will refresh and we will get calibrated by wavelength image.
Now you can fill in the other studied spectra as well, when requesting calibration, you must specify the graph already calibrated by us earlier.
Attention! Calibration assumes that in the future you will take pictures on the same apparatus that calibrated the change in the resolution apparatus of the pictures, a strong shift of the spectrum in the photo relative to the position in the calibrated example can distort the measurement results.
Honestly, I slightly corrected my pictures in the editor. If where there was a flare, it darkened the environment, sometimes the spectrum was slightly rotated to get a rectangular image, but once again I repeat the file size and the location relative to the center of the image of the spectrum itself is better not to change.
With other functions like macros, auto or manual brightness adjustment, I suggest you figure it out on your own, in my opinion they are not so critical.
The resulting graphs can then be conveniently transferred to CSV, with the first number being a fractional (probably fractional) long wave, and the average relative value of the radiation intensity separated by a comma. The values obtained look beautiful in the form of graphs constructed for example in Scilab
. SpectralWorkbench.org has applications for smartphones. I did not use them. therefore, I can’t appreciate it.
Have a wonderful day in all colors of the rainbow, friends.
UPD: At the request of DrZugrik , I will additionally write that the option with SpectralWorckbench equipment is one of the most budgetary, some additional modules of the spectrometer for arduino can cost 500 units forever.
How do you still not have your spectrometer? It’s not a problem if we go under the cut and correct this misunderstanding.
Attention! This article does not pretend to be a full-fledged tutorial, but it is possible within 20 minutes after reading it you will expand your first radiation spectrum.
Man and spectroscope
I will tell you in the order in which I went through all the stages myself, we can say from worst to best. If someone is aimed immediately at a more serious result, then half of the article can be safely skipped. Well, for people with crooked hands (like mine) and just curious it will be interesting to read about my ordeals from the very beginning.
A lot of materials are walking on the Internet on how to assemble a spectrometer / spectroscope yourself from improvised materials.
In order to acquire a spectroscope at home, in the simplest case, you will not need much at all - a CD / DVD disc and box.
This material prompted me to my first experiments in studying the spectrum - Spectroscopy
Actually, thanks to the author’s achievements, I assembled my first spectroscope from a transmission diffraction grating of a DVD disc and a cardboard box made of tea, and before that I had enough of a dense piece of cardboard with a slot and transmission gratings from a DVD disc.
I can’t say that the results were stunning, but I managed to get the first spectra, miraculously saved photos of the process under the spoiler
Photo spectroscopes and spectrum
The very first option with a piece of cardboard. The

second option with a box of tea.

And footage.

second option with a box of tea.
And footage.
Alternatively, you can do it differently , use a reflective layer or use a matchbox and blades.
From spectroscope to spectrometer
Well, suppose you already looked at the spectra of everything that shines in your house.
There is a logical development of the situation. How now to research what they got?
Here, again, several options will come to our aid at once. The first thing I found on the subject of spectral analysis was the development of a foreign scientist - Cell Phone Spectrophotometer, which suggests using the assembled spectroscope, a mobile phone camera and free software written by the author as an spectrometer. An interesting system, but due to the lack of components at hand, the system itself I did not begin to collect, but I used only the software and the previously captured spectra.
Oddly enough, but the use of software (CellPhoneSpec.exe) caused some difficulties for me and my colleague, for the most part I have empirically figured out how it works, I still hope that I understood correctly, in any case even if not, then at the end of the article I will give an option that works ironically. In the meantime, a little about CellPhoneSpec.
My instruction is more like dancing with a tambourine, but still.
To work with the program, we need a sample of the full spectrum and a photo of the captured experimental spectrum, well, and then in order:
0) It is advisable to put all the photos in one folder to the .exe file of the program for convenience
1) Open the program, select a picture with a full spectrum sample in the reference field , in the sample field, select a sample photo
2) Click on the extreme blue section of the reference dialog pops up - select “blue end”, click on the red end of the spectrum and select “red end”, respectively, well, we will do the same for the tab with the sample.
3) It would seem that’s all let's get the graphics going, but some error constantly pops up,
I treat it like this. In the spectrum parameters fields, delete the values after the point and the point inclusive, well, let's just do 720 from 720.0 and press enter and so on for all values, after that in the sample field I select the same figure again that I put in the beginning and then the Make Plot button lights up for a miracle
4) Click Make Plot to get the graphics of the three channels (RGB) and the total. Received data can be saved in CSV
Screenshot
Type of customized program

I can’t say how reliable this method is, but the graphs obtained poorly can be correlated with my expectations and with the graphs obtained using SpectralWorkbench. , but I still will not argue that the technique described by me is 100% correct (I did not particularly delve into the author's instructions).
Juice itself
In view of the uncertainty in the quality and not particularly convenient for obtaining the results of spectral analysis obtained earlier, I turned to my talented friend and colleague DrZugrik for help .
And this golden man with straight arms gathered me a wonderful spectroscope.
He took as a basis the development of the PublicLab.org project (assembly instructions), which was previously mentioned on the open spaces of Habr.
The only thing for my convenience, he modified this design with a USB video camera, it turned out like this:
photo spectrometer

The author of this man-made miracle asked to add a comment:
“Sorry, the blue electrical tape is over, I had to take a foreign analogue” :)
The author of this man-made miracle asked to add a comment:
“Sorry, the blue electrical tape is over, I had to take a foreign analogue” :)
I must say right away that this modification saved me from having to use a mobile phone’s camera, but there was one drawback: the camera could not be calibrated for the settings of the Spectral Worckbench service (which will be discussed below). Therefore, I was not able to capture the spectrum in real time, but to recognize already collected photographs completely.
So let's say you bought or assembled a spectroscope according to the instructions above.
After that, create an account in the PublicLab.org project and go to the SpectralWorkbench.org service page. Next I will describe to you the spectrum recognition technique that I used.
To begin with, we will need to calibrate our spectrometer. To do this, you will need to get a snapshot of the spectrum of the fluorescent lamp, preferably a large ceiling, but an energy-saving lamp is also suitable.
1) Press the Capture spectra button
2) Upload Image
3) Fill in the fields, select the file, select new calibration, select the device (you can choose a mini spectroscope or just custom), choose which spectrum you have vertical or horizontal, so that the spectra in the previous screenshot are clear programs - horizontal
4) A window with charts will open.
5) We check how your spectrum is rotated. On the left there should be a blue range, on the right - red. If it’s not so, select the more tools - flip horizontally button, after which we see that the image has rotated and the graph is gone, so click more tools - re-extract from foto, all the peaks correspond to the real peaks again.
6) Click the Calibrate button, click begin, select the blue peak directly on the chart (see screenshot), click LMB and the popup window opens again, now we need to click finish and select the extreme green peak, after which the page will refresh and we will get calibrated by wavelength image.
Now you can fill in the other studied spectra as well, when requesting calibration, you must specify the graph already calibrated by us earlier.
Screenshot
Type of customized program

Attention! Calibration assumes that in the future you will take pictures on the same apparatus that calibrated the change in the resolution apparatus of the pictures, a strong shift of the spectrum in the photo relative to the position in the calibrated example can distort the measurement results.
Honestly, I slightly corrected my pictures in the editor. If where there was a flare, it darkened the environment, sometimes the spectrum was slightly rotated to get a rectangular image, but once again I repeat the file size and the location relative to the center of the image of the spectrum itself is better not to change.
With other functions like macros, auto or manual brightness adjustment, I suggest you figure it out on your own, in my opinion they are not so critical.
The resulting graphs can then be conveniently transferred to CSV, with the first number being a fractional (probably fractional) long wave, and the average relative value of the radiation intensity separated by a comma. The values obtained look beautiful in the form of graphs constructed for example in Scilab
. SpectralWorkbench.org has applications for smartphones. I did not use them. therefore, I can’t appreciate it.
Have a wonderful day in all colors of the rainbow, friends.
UPD: At the request of DrZugrik , I will additionally write that the option with SpectralWorckbench equipment is one of the most budgetary, some additional modules of the spectrometer for arduino can cost 500 units forever.