What will we measure? How to choose the right ML-metrics for business tasks

Today, one of the main obstacles to the introduction of machine learning into business is the incompatibility of ML metrics and indicators used by top management. The analyst predicts an increase in profits? But you need to understand in what cases the cause of the increase will be machine learning, and in which - other factors. Alas, quite often, an improvement in ML metrics does not lead to an increase in profits. In addition, sometimes the complexity of the data is such that even experienced developers can choose incorrect metrics, which can not be guided.
Let's look at what ML metrics are and when they should be used. Let us analyze typical errors, and also tell you about which variants of problem statement may be suitable for machine learning and business.
ML-metrics: why so many of them?
Machine learning metrics are very specific and often misleading, showing a
What tasks are most often solved with the help of machine learning? First of all, it is regression, classification and clustering. The first two - the so-called learning with the teacher: there is a set of marked data, on the basis of some experience you need to predict the specified value. Regression is a prediction of some value: for example, how much the customer buys, what durability of the material, how many kilometers the car will travel before the first breakdown.
Clustering is the definition of a data structure using cluster allocation (for example, categories of clients), and we have no assumptions about these clusters. We will not consider this type of tasks.
Machine learning algorithms optimize (by calculating the loss function) a mathematical metric - the difference between the prediction model and the true value. But if the metric is the sum of the deviations, then with the same number of deviations in both directions, this sum will be equal to zero, and we simply will not know if there is an error. Therefore, the mean absolute (sum of absolute values of deviations) or mean square error (sum of squared deviations from the true value) is usually used. Sometimes the formula is complicated: take the logarithm or take the square root of these sums. Thanks to these metrics, one can estimate the dynamics of the quality of the model's calculations, but for this, the obtained result needs to be compared with something.
There will be no difficulties with this if there is already a built model with which you can compare the results obtained. What if you created the model for the first time? In this case, the coefficient of determination, or R2, is often used. The coefficient of determination is expressed as:
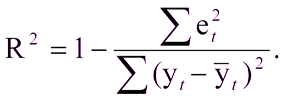
Where:
R ^ 2 is the coefficient of determination,
e t ^ 2 is the root mean square error,
y t is the correct value,
y t with the cover is the average value.
Unit minus the ratio of the mean square error of the model to the mean square error of the average value of the test sample.
That is, the coefficient of determination allows to evaluate the improvement of the prediction model.
Sometimes it happens that an error in one direction is not equivalent to an error in another. For example, if a model predicts an order for a product at a store warehouse, then it is quite possible to make a mistake and order a little more, the product will wait for its hour in the warehouse. And if the model makes a mistake in the other direction and orders less, then you can lose buyers. In such cases, a quantile error is used: positive and negative deviations from the true value are taken into account with different weights.
In the classification task, the machine learning model distributes objects into two classes: the user leaves the site or does not leave, the item will be defective or not, etc. Prediction accuracy is often estimated as the ratio of the number of correctly defined classes to the total number of predictions. However, this characteristic can rarely be considered an adequate parameter.

Fig. 1. Error matrix for the task of predicting the return of a client
Example : if 7 people out of 100 insured seek reimbursement, the model predicting the absence of an insured event will have 93% accuracy without any predictive power.
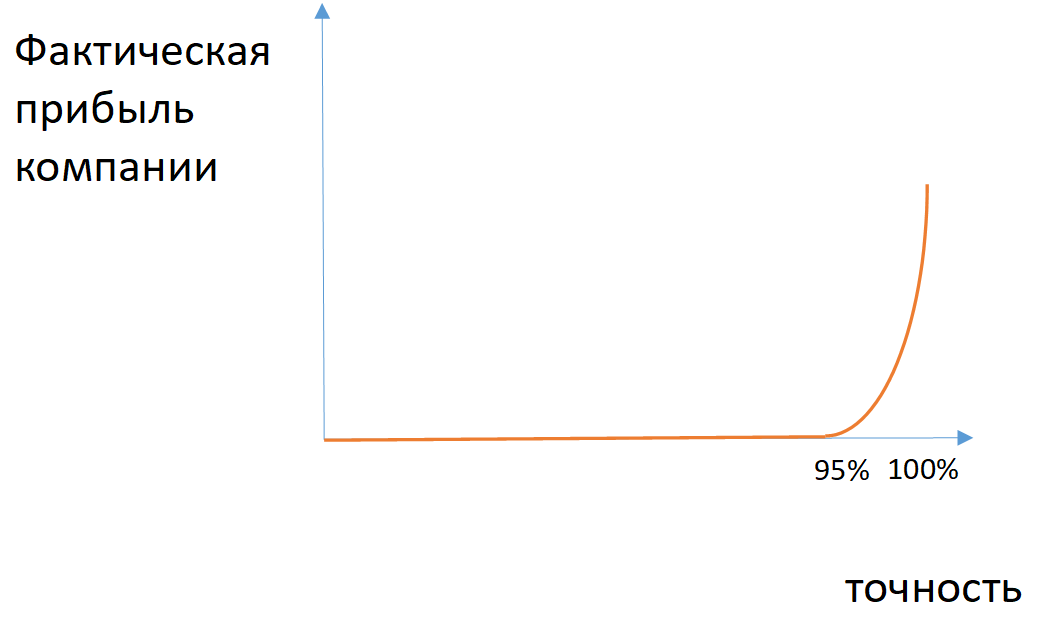
Fig. 2. An example of the dependence of the company's actual profit on the accuracy of the model in the case of unbalanced classes
For some tasks, you can apply metrics of completeness (the number of correctly defined class objects among all objects of this class) and accuracy (the number of correct certain class objects among all objects that the model has assigned to this class). If it is necessary to take into account both completeness and accuracy, then the harmonic mean between these values is applied (F1-measure).
With the help of these metrics it is possible to evaluate the partitioning performed by classes. However, many models predict the likelihood of a model’s relationship to a particular class. From this point of view, you can change the probability threshold for which elements will be assigned to one or another class (for example, if the client leaves with a probability of 60%, then it can be considered remaining). If a specific threshold is not set, then to assess the effectiveness of the model, you can plot the dependence of metrics on different threshold values ( ROC-curve or PR-curve ), taking as the metric the area under the selected curve.
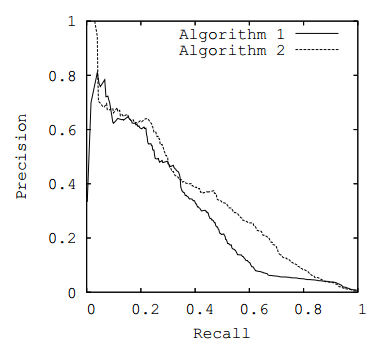
Fig. 3. PR curve
Business metrics
Allegorically, business metrics are elephants: they cannot be overlooked, and a large number of machine learning parrots can fit in one such “elephant”. The answer to the question of which ML metrics will increase profits depends on the improvement. In fact, business metrics are somehow tied to an increase in profits, but we almost never manage to directly associate profits with them. Intermediate metrics are usually used, for example:
- the duration of the goods in stock and the number of requests for the goods when it is not available;
- the amount of money from customers who are going to leave;
- the amount of material that is saved in the production process.
When it comes to business optimization with the help of machine learning, the creation of two models is always implied: predictive and optimization.
The first one is more complicated, the second one uses its results. Errors in the prediction model force a larger margin into the optimization model, so the optimized amount is reduced.
Example : the lower the accuracy of predicting customer behavior or the likelihood of industrial failure, the fewer customers can be retained and the smaller the amount of material saved.
The generally accepted metrics of business success (EBITDA, etc.) are rarely used when defining ML tasks. Usually we have to deeply study the specifics and apply the metrics adopted in the area in which we implement machine learning (average check, attendance, etc.).
Translation difficulties
Ironically, it is most convenient to optimize models using metrics that are difficult for business representatives to understand. How does the area under the ROC curve in the comment tonality model relate to a specific revenue size? From this point of view, the business faces two tasks: how to measure and how to maximize the effect of the introduction of machine learning?
The first task is easier to solve if you have retrospective data and at the same time other factors can be leveled or measured. Then nothing prevents to compare the obtained values with similar retrospective data. But there is one difficulty: the sample must be representative and at the same time as similar to the one with which we test the model.
Example: you need to find the most similar customers to find out if their average check has increased. But at the same time, the sample of clients should be large enough to avoid surges due to non-standard behavior. This task can be solved by first creating a large enough sample of similar clients and checking the result of their efforts on it.
However, you ask: how to translate the selected metric to the loss function (which the model minimizes) for machine learning. With the swoop, this task cannot be solved: the developers of the model will have to delve deeply into the business processes. But if, when teaching a model, to use a metric that depends on a business, the quality of the models immediately increases. For example, if a model predicts which customers will leave, then you can use a graph in the role of a business metric, where the number of customers leaving the model is postponed on one axis, and the total amount of funds of these clients on the other axis. With the help of this schedule, a business customer can choose a convenient point and work with it. If using linear transformations to reduce the graph to a PR curve (accuracy along one axis, completeness along the second),

Fig. 4. The curve of the monetary effect
Conclusion
Before setting a task for machine learning and creating a model, you need to choose a reasonable metric. If you are going to optimize the model, then one of the standard metrics can be used as an error function. Be sure to agree with the customer on the selected metric, its weights and other parameters, transforming business metrics into ML models. In terms of duration, this may be comparable to the development of the model itself, but without this it does not make sense to start work. If mathematicians are attracted to the study of business processes, then the probability of errors in metrics can be greatly reduced. Effective optimization of the model is impossible without an understanding of the subject area and joint statement of the problem at the level of business and statistics. And after all the calculations, you will be able to estimate the profit (or savings) depending on each improvement of the model.
Nikolay Knyazev ( iRumata ), the head of the Jet Infosystems machine learning group