What do the metrics mean for Agile teams?
Passing an interview for the Product Owner position, I realized that I have a serious gap on business metrics in the Agile project, since I work in the state structure. In the Russian segment, the information is rather scarce. In the English segment, I really liked the article Ashwinee Kalkura . Therefore, I decided to do a little free translation. Original article here .
Many are trying to understand what “best practice” in the industry is and impose it on their product in order to improve their own performance. For a while, I wondered if such a universal and effective solution existed.
Organizations tend to copy “what worked for others,” without even worrying about the limitations and conditions in which a particular metric worked on “others.”
Then what to measure? In my opinion, organizations that understand what and how much to measure in a product have survived and flourish to this day. They eventually became Agile organizations. When they have several products, they have different approaches for each of them. Some products will need a lot of statistics and data, while some only need a couple of metrics!
And then how to understand exactly what needs to be measured? For me, the closest guide is the 7th principle in Agile Manifesto - “working software is the best measure of progress.” If you can determine what is working software for you, it becomes easier to measure progress.
Again, everyone must define their “working” software in different ways. Therefore, it is very important to have a holistic view of who the customer is, who is the developer, who is the sponsor and who controls the process. Let's try to consider the process on the part of each of them.
In a functional Agile team, this role is primarily responsible for understanding the market and synthesizing data. PO has a “hypothesis” about what makes an organization profitable. When all you have is a hypothesis, it is very important to find the right metrics. The following indicators may be necessary:
The “Product” group should have a mechanism to understand and track the indicators that are important for Sponsors / Investors. This will ensure that the cycle is closed, and any Pivot clause is justified.
This group is interested in the same metrics that Business / Product Managers use before product launch. The following metrics are most important during and after product launch:
Unfortunately, most people are trying to measure the product here. While the metrics and metrics here give you the answer to the question “are we developing the product right?”, And do not guarantee that we are developing the right product. The metrics that are described in this section should always complement the indicators we talked about in the previous sections. These are the metrics that say that we applied the Agile methodology correctly. This group is focused on technology and, therefore, metrics are more technical in nature. Some of the indicators that could help you understand are “are we developing correctly”:
The person for whom we are creating the solution is also part of the system. Customers may understand and may not understand any numbers, measurements, and metrics. They want their problems to be solved easily, and they themselves do not want to delve deeply into this process. We should not stress them. Organizations or entrepreneurs who understand the above statement and are working on it most successful!
Summary:
In the real world, we can distinguish between different roles, as I did here, but we can not differentiate. Care must be taken to understand "what", "when" and "how much" and always take into account the circumstances and limitations in which the product works. Most metrics talked about the importance of being connected to a customer, and it is imperative that we accept this point of view from the first step we take to create a product or service.
About the author:
Ashwinee Kalkura's qualifications include SPC4, PMP, CSM, CSP, SA, SASM, SSM, ICP-ACC and SSGB professional certifications. He has been a progressive experience of 16 years in the field of Networking, Mobile and Retail industry and multiple methodologies. Ashwinee is currently working as an Agile & SAFe consulting at KnowledgeHut. He has delivered SAFe training for 450+ candidates in the APAC region.
What do the metrics mean for Agile teams?
Many are trying to understand what “best practice” in the industry is and impose it on their product in order to improve their own performance. For a while, I wondered if such a universal and effective solution existed.
Organizations tend to copy “what worked for others,” without even worrying about the limitations and conditions in which a particular metric worked on “others.”
Then what to measure? In my opinion, organizations that understand what and how much to measure in a product have survived and flourish to this day. They eventually became Agile organizations. When they have several products, they have different approaches for each of them. Some products will need a lot of statistics and data, while some only need a couple of metrics!
And then how to understand exactly what needs to be measured? For me, the closest guide is the 7th principle in Agile Manifesto - “working software is the best measure of progress.” If you can determine what is working software for you, it becomes easier to measure progress.
Again, everyone must define their “working” software in different ways. Therefore, it is very important to have a holistic view of who the customer is, who is the developer, who is the sponsor and who controls the process. Let's try to consider the process on the part of each of them.
Business / Product Owner / Product Manager
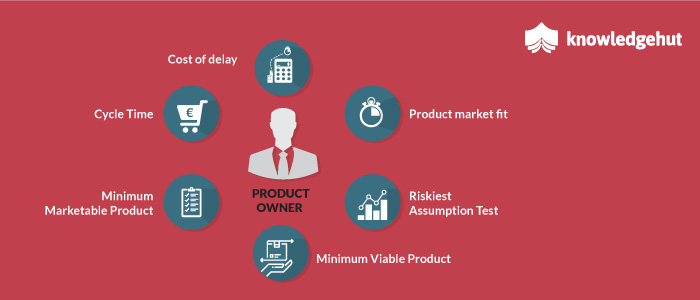
In a functional Agile team, this role is primarily responsible for understanding the market and synthesizing data. PO has a “hypothesis” about what makes an organization profitable. When all you have is a hypothesis, it is very important to find the right metrics. The following indicators may be necessary:
- Cost of Delay : This is the effect of time on the results we hope to achieve. This is the answer to the question: "What will we lose (what will it cost us) if we do it 1 month later?" Or, “what will we get if we do it 1 month earlier?”
- Product / Market Fit (PMF) : this is the product's compliance with the expectations of the target audience. When you have a product that meets the needs of a specific market, and without which your audience will lose a lot, this is called Product / Market Fit.
- Riskiest Assumption Test (RAT) : This is the test of the most risky assumption. There is no need to do anything more than is required to test your greatest risk. No need for perfect code or design. Only check risky assumptions with indicators. After its assessment, a decision is made whether to continue the project.
- Minimum Viable Product (MVP) : A new product version that allows a team to meet the maximum amount of customer needs with the least effort. It is a product with enough features to satisfy early customers, to provide feedback and to further develop the product.
- Minimum Marketable Product (MMP) : describes a product with the smallest possible set of functions that meets the needs of the original users (innovators and early users) and, therefore, can be sold. MMP is a tool to reduce time to market: it can be launched faster than a rich, multifunctional product.
- Cycle Time : cycle time - the total time since the start of work on a new feature, task, bug, and until its completion. The cycle time includes the time of the process itself and the delay time during which part of the work is spent waiting for the next action to be performed.
The “Product” group should have a mechanism to understand and track the indicators that are important for Sponsors / Investors. This will ensure that the cycle is closed, and any Pivot clause is justified.
Sponsor / Investor
This group is interested in the same metrics that Business / Product Managers use before product launch. The following metrics are most important during and after product launch:
- Employee Satisfaction : Happier and more motivated employees themselves make sure that the client is happy and involved in the process. Employee satisfaction is a terminology used to describe whether employees are satisfied and whether they fulfill their desires and needs at work. Employee satisfaction is a factor in motivating employees, achieving employee goals and positive employee morale in the workplace.
- Viral coefficient : this is a number that tells you how many customers each of your customers leads to your business. Thus, this means that if your viral coefficient is 2, then each of your current clients attracts 2 clients. This metric calculates an exponential circulation cycle, sometimes called virality, which accelerates the growth of a company. Virality is an essential incentive for customers to send friends or colleagues to your company.
- Sunk Costs : In economics and business decision making, non-refundable costs are costs that have already been incurred and cannot be recovered. The non-refundable costs are sometimes contrasted with the estimated costs, which represent future costs that may be incurred or changed if action is taken.
- Viral Cycle Time : The viral cycle time is the time it takes to complete one such cycle. In other words, the viral cycle time is the time it takes the user to invite another user.
- Net Promoter Score: (NPS) is a management tool that can be used to assess the loyalty of customer relations with a firm. It serves as an alternative to traditional customer satisfaction surveys and argues that they correlate with revenue growth. Net Promoter score is calculated based on the answers to one question: How likely is it that you would recommend our company / product / service to a friend or colleague? Scoring for this answer is most often based on a scale from 0 to 10. Those who answer with a score from 9 to 10 are called promoters. Those who respond with a score from 0 to 6 are labeled as “Detractors”. Answers 7 and 8 are indicated by liabilities, and their behavior rises in the middle of promoters and detractors. Net Promoter score is calculated by subtracting the percentage of customers who are Dractors from the percentage of customers who are Promoters.
- Customer Happiness Index (CHI) : instead of using NPS, an organization can also create its own customer happiness index, including parameters that it wants to measure. This approach is advantageous because the organization must “talk to the client” and can understand the parameters that are necessary for its context.
- % Paying Customers : understanding how many people use a paid product / service in a common customer base helps us better understand the market.
- C onversion Rate : The essence of a conversion funnel is that you start with potential customers, then they show interest, and then are converted into leads, which then turn into sales. Calculate the percentage conversion at each step. The overall conversion rate of the sales funnel is determined by the fact that the number of sales is divided by the number of potential customers and multiplied by 100.
- Customer Acquisition Cost : CAC can be calculated by simply dividing all the costs of acquiring a larger number of customers (marketing expenses) by the number of customers acquired during the period during which the money was spent. For example, if a company spent $ 100 on marketing per year and acquired 100 customers in the same year, their CAC is $ 1.
- Customer Stickiness . Customer stickiness is an increased chance of using the same product or service that was purchased in the last period of time.
Developer / Builder
Unfortunately, most people are trying to measure the product here. While the metrics and metrics here give you the answer to the question “are we developing the product right?”, And do not guarantee that we are developing the right product. The metrics that are described in this section should always complement the indicators we talked about in the previous sections. These are the metrics that say that we applied the Agile methodology correctly. This group is focused on technology and, therefore, metrics are more technical in nature. Some of the indicators that could help you understand are “are we developing correctly”:
- Health of CI / CD pipeline : are the assemblies correct? Are they fast enough for teams to experiment with them?
- Number of Green builds per day / week : Team discipline, daily code check, and build frequency. The team can work in small groups, because they know that the last logical piece of code they sent is working.
- % of green builds : not only the number of builds is important, but how many of them were of high quality. A good developer does not want others to get stuck because of him.
- Unit Test Coverage: Compliance with Agile Test Pyramid is the only way to get into the fast product development area. Unit tests should account for ~ 80% of all tests.
- Code Coverage : code coverage is a term for describing which code is executed by an application. To understand which code is claimed and which is not.
- Non-Functional Test Coverage . It is important to understand non-functional requirements, often referred to as “ility tests” (usability, accessibility, reliability, etc.), since the market or customer will not directly ask us about non-functional requirements.
- Benchmarking of NFR’s : Benchmarking is an important part of understanding what we can achieve. Usually, the “best” products and the marketing process used by direct competitors and firms operating in other similar areas are taken as a model for the company to identify possible ways to improve its own products and working methods.
- Defects found per unit of Unit / Functional / Integration Test : although the number of defects may not indicate anything significant, they slow us down when developing.
- Number of defects per feature from Production / UAT / Customer : in most cases, the feature is what the client pays for. Understanding the important functions and the belief that they are built with quality, makes system developers focus more on where it really matters.
- Defects that can be lived with : Not all defects are critical! Pay attention to the most important ones and spend as little time as possible with others. Often it is the operating release that is important and improvement is not always the right decision.
- Rework : we spend a lot of time on revision, time that can be used for "work". Practices such as Split-testing, Pair Work (for example, Dev-Test, Test-Documentation, etc.), separate environments, testing and correction by the developer can help teams avoid the cost of fixing subsequent defects.
Customer / User
The person for whom we are creating the solution is also part of the system. Customers may understand and may not understand any numbers, measurements, and metrics. They want their problems to be solved easily, and they themselves do not want to delve deeply into this process. We should not stress them. Organizations or entrepreneurs who understand the above statement and are working on it most successful!
Summary:
In the real world, we can distinguish between different roles, as I did here, but we can not differentiate. Care must be taken to understand "what", "when" and "how much" and always take into account the circumstances and limitations in which the product works. Most metrics talked about the importance of being connected to a customer, and it is imperative that we accept this point of view from the first step we take to create a product or service.
About the author:
Ashwinee Kalkura's qualifications include SPC4, PMP, CSM, CSP, SA, SASM, SSM, ICP-ACC and SSGB professional certifications. He has been a progressive experience of 16 years in the field of Networking, Mobile and Retail industry and multiple methodologies. Ashwinee is currently working as an Agile & SAFe consulting at KnowledgeHut. He has delivered SAFe training for 450+ candidates in the APAC region.