NetFlow, Cisco and traffic monitoring. It's time to figure it out
Good day to all! Understanding NetFlow, such a simple, convenient and often used protocol, I realized that it is not so simple, and there are enough pitfalls in its operation.
Under the cut, I collected everything that you first need to know about NetFlow and its settings on Cisco, paid tribute to eucariot, who writes excellent articles on networks, and ... Pictures, some funny pictures.
NetFlow is a proprietary open protocol developed by Cisco to monitor network traffic. Netflow provides session-level network traffic analysis by recording every TCP / IP transaction.
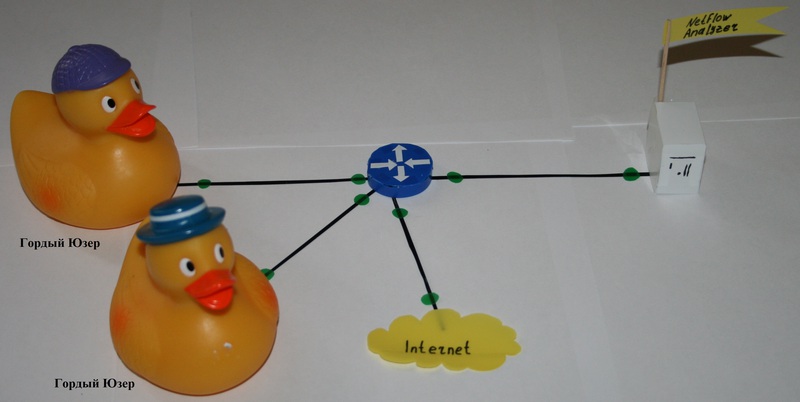
The architecture of the system is based on the sensor, collector and analyzer:
- The sensor collects statistics on the traffic passing through it. It makes sense to install sensors in the “nodal points” of the network, for example, on the boundary routers of network segments.
- The collector collects information from sensors. He dumps the received data into a file for further processing. Different collectors store data in various formats.
- The analyzer, or processing system, reads these files and generates reports in a form more convenient for humans. This system must be compatible with the data format provided by the collector [1] . In modern systems, the collector and analyzer are often combined into one system.
Typically, the collector and analyzer are parts of a single software package running on a server. There are many kinds of collector / analyzer software, both free and paid, for Windows and Unix systems.
In the article, I will not touch on this area; I will only consider the principles of NetFlow operation and sensor setup on Cisco.
You need to immediately understand - the collector and the analyzer behind it are "passive" elements of the system. The sensor sends traffic reports to the collector, the collector receives, the analyzer analyzes, and fills its database on the server. In fact, with the server up, we do not need to manually connect the devices that are monitored to the server. While the sensor sends reports, the collector receives them, the analyzer registers. If the sensor is turned off, it "disappears" from the current "on-line" statistics.
NetFlow uses UDP or SCTP to transmit traffic data to the collector. Typically, the collector listens on port 2055, 9555, or 9995 (or the one you specify when configuring the collector and sensor).
The sensor extracts flows from the passing traffic, characterized by the following parameters:
This is a very important point - when setting up the sensor, we decide for ourselves according to what parameters the information sent to the collector will be combined in the reports.
Let's analyze the sensor configuration when configuring on Cisco:
Finally it came to the interface:
Or
According to the basic setup, all useful links for more complete enlightenment [4] , [5] and [6].
“Other” traffic. As you know, many common applications have their own ports, consider
Figure taken from [7] .
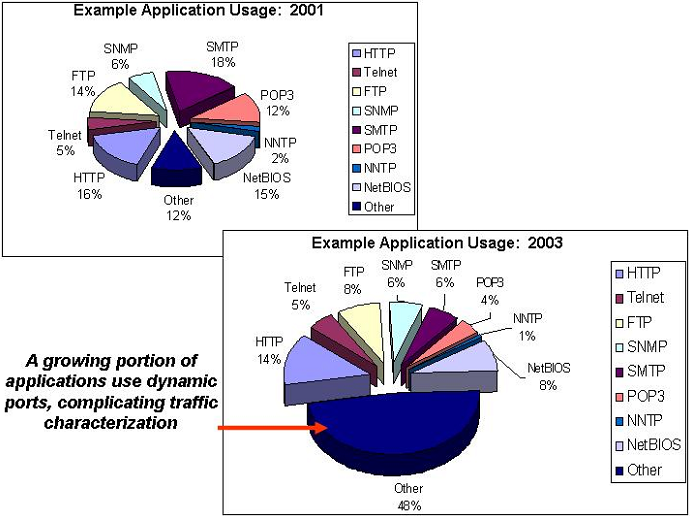
However, over time, the share of traffic falling into the “Other” section grows, due to the increase in the number of applications that use dynamic, randomly generated ports.
The document [8] , which reviews NetFlow, casually mentions a problem that is well illustrated in the figure.
Of course, I would like the most different traffic to be clearly described in the reports, for example:
Link to it [10] .
Progress does not stand still, technologies are moving forward, and theboss will receive a full report. Unrecognized traffic is solved in various interesting ways, for example, using NBAR technology.
During the search, a discussion [11] and an interesting presentation [12] were found . I won’t go further into the wilds, for he is young, ardent and inexperienced.
Under the cut, I collected everything that you first need to know about NetFlow and its settings on Cisco, paid tribute to eucariot, who writes excellent articles on networks, and ... Pictures, some funny pictures.
Let's define the basic concepts
NetFlow is a proprietary open protocol developed by Cisco to monitor network traffic. Netflow provides session-level network traffic analysis by recording every TCP / IP transaction.
The architecture of the system is based on the sensor, collector and analyzer:
- The sensor collects statistics on the traffic passing through it. It makes sense to install sensors in the “nodal points” of the network, for example, on the boundary routers of network segments.
- The collector collects information from sensors. He dumps the received data into a file for further processing. Different collectors store data in various formats.
- The analyzer, or processing system, reads these files and generates reports in a form more convenient for humans. This system must be compatible with the data format provided by the collector [1] . In modern systems, the collector and analyzer are often combined into one system.
Typically, the collector and analyzer are parts of a single software package running on a server. There are many kinds of collector / analyzer software, both free and paid, for Windows and Unix systems.
In the article, I will not touch on this area; I will only consider the principles of NetFlow operation and sensor setup on Cisco.
You need to immediately understand - the collector and the analyzer behind it are "passive" elements of the system. The sensor sends traffic reports to the collector, the collector receives, the analyzer analyzes, and fills its database on the server. In fact, with the server up, we do not need to manually connect the devices that are monitored to the server. While the sensor sends reports, the collector receives them, the analyzer registers. If the sensor is turned off, it "disappears" from the current "on-line" statistics.
Protocol Description
NetFlow uses UDP or SCTP to transmit traffic data to the collector. Typically, the collector listens on port 2055, 9555, or 9995 (or the one you specify when configuring the collector and sensor).
The sensor extracts flows from the passing traffic, characterized by the following parameters:
- Source Address
- Destination Address
- Source port for UDP and TCP;
- Destination port for UDP and TCP;
- Message Type and Code for ICMP;
- IP protocol number;
- Network interface (ifindex SNMP parameter);
- IP Type of Service.
This is a very important point - when setting up the sensor, we decide for ourselves according to what parameters the information sent to the collector will be combined in the reports.
Actually, the setting
Let's analyze the sensor configuration when configuring on Cisco:
Router_NF # conf tIn the configuration mode, specify the collector addresses and ports where to send statistics, indicate the version of the NetFlow protocol. In a complex network, you can have two collector interfaces if there are any routing restrictions between segments
Router_NF (config) # ip flow-export destination 192.168.0.1 9996
Router_NF (config) # ip flow-export destination 10.10.0.1 9996
Router_NF (config) # ip flow-export version 9
Router_NF (config) # ip flow-cache timeout active 1Specify how often to update the NetFlow cache with traffic data for an still active session
Router_NF (config) # ip flow-cache timeout inactive 15We indicate the time during which if data is not transferred in the existing stream, then it is closed, and information about it is written to the cache, and then transferred to the collector
Router_NF (config) # ip flow-export source FastEthernet 0/0Sources of traffic reports, statistics will be collected from them. On the analyzer side, the interface, VLAN, and Port-channel will be separately monitored
Router_NF (config) # ip flow-export source vlan4
Router_NF (config) # ip flow-export source Port-channel1.2
!Add ACLs for more harmonious feng shui
ip access-list standard iacl-snmp
remark ACL for SNMP access to device
permit 192.168.0.1
permit 10.10.0.1
deny any log
!
!We configure snmp to correctly recognize interface names.
snmp-server group snmp v1 access iacl-snmp
snmp-server group snmp v2c access iacl-snmp
snmp-server community ******** **** iacl-snmp
snmp-server ifindex persist
snmp-server trap-source Loopback0
snmp-server enable traps tty
!
Finally it came to the interface:
Router_NF (config) # interface FastEthernet 0/0We indicate what traffic will be taken into account, entering or leaving the interface? If outgoing, then ip flow egress, if incoming, then ip flow ingress
Router_NF (config-if) # ip flow egress
Router_NF (config-if) # ip flow ingress
Or
Router_NF (config-if) # ip route-cache flow"Ip route-cache flow" can only be used for the main interface, and "ip flow ingress" is an extension for use for subinterfaces. The functionality of NetFlow Subinterface Support allows you to enable NetFlow for each subinterface. In a scenario where your network contains many subinterfaces, and you need to collect records from only a few, you can fine-tune the collection of information only from certain subinterfaces [3]
What you can see on the sensor:
Router_NF # show ip cache flowTraffic Information Pending Collector
Router_NF # show ip cache verbose flowDetailed traffic information waiting to be sent to the collector
Router_NF # show ip flow interfaceNetFlow Sensor Interfaces
Router_NF # show ip flow exportsource and destination NetFlow reports, how many datagrams sent, how many errors
Router_NF # show ip flow top-talkersInformation about the champions is presented categorically, up to the most visited Internet resources.
According to the basic setup, all useful links for more complete enlightenment [4] , [5] and [6].
A spoon of tar
“Other” traffic. As you know, many common applications have their own ports, consider
show ip cache flow output part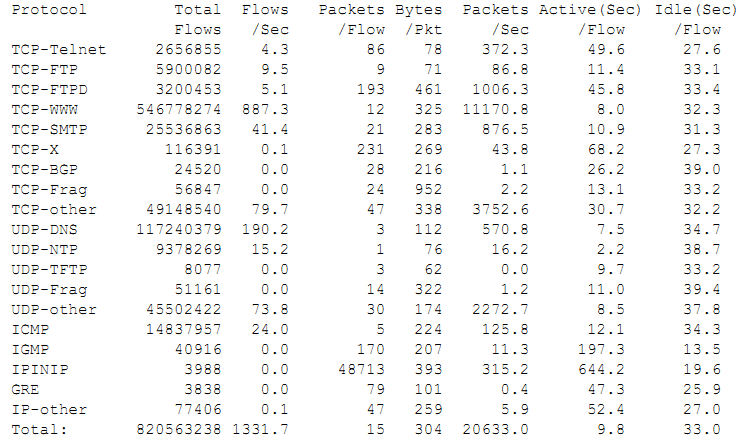
Figure taken from [7] .
However, over time, the share of traffic falling into the “Other” section grows, due to the increase in the number of applications that use dynamic, randomly generated ports.
The document [8] , which reviews NetFlow, casually mentions a problem that is well illustrated in the figure.
Of course, I would like the most different traffic to be clearly described in the reports, for example:
Excellent table, taken from the article, could not pass by
| Traffic category | Ports | Application layer protocol |
| 25, 109, 110, 113, 143 | smtp, pop2, pop3, ident, imap | |
| Web | 80, 8080, 443 | http, https |
| data | 20, 21, 3306, 66, 1521, 1526, 1524 | ftp, MySQL, sqlnet, Oracle, Ingres |
| Network management | 53, 137, 138, 139, 445, 161, 123, 783, 8200 | domain, netbios, snmp, ntp, spamassassin, GoToMyPC |
| Interactive | 22, 23, 513, 543 | ssh, telnet, rlogin, klogin |
| nntp | 119 | nntp |
| Chat | 194, 6891–6901, 1863, 5050, 5190 | irc, msn messenger, yahoo messenger, ICQ |
| streaming | 554, 1755, 1220, 8000–8005, 7070, 7071, 6970 | rtsp, ms-streaming, Apple quicktime, internet radio (shoutcast), Real Audio & Video |
| Malware & games | 1433, 1434, 666, 1999, 31337, 12345, 12346, 20034, 1024, 1025, 31338, 31339, 3127, 27015, 27016, 26000, 27001, 27960, 3724 | Ms-sql-s, ms-sql-m, backdoor, Back Ori fi ce, NetBus, netspy, myDoom, HalfLife, Quake, QuakeWorld, QuakeIII, WarCraft |
| p2p | 411, 412, 1214, 3531, 4111, 4661–4665, 4672, 6346, 6347, 6669.6881–6889, 23302, 32285, 59049, 41170, 57990 | Direct Connect, Fasttrack, Kazaa, eDonkey, Gnutella, Napster, BitTorrent, Ares, Mp2p, Azureus |
| Others | - | - |
Link to it [10] .
Progress does not stand still, technologies are moving forward, and the
During the search, a discussion [11] and an interesting presentation [12] were found . I won’t go further into the wilds, for he is young, ardent and inexperienced.
It is believed that the author of the post has a mess in his head, and he misses something!
PS
In the process of writing the article, I answered my questions as best I could, and I hope I didn’t put new ones, I wasn’t mistaken anywhere.
Thanks for attention!
Thanks for attention!