Don Jones. “Creating a unified IT monitoring system in your environment” Chapter 4. Monitoring: a look beyond the data center
- Transfer

This chapter will discuss how to combine external and internal monitoring. What to look for when building a system, what are the limitations. How not to miss the little things and get the opportunity to view the picture not only from bottom to top, but also from top to bottom.
Contents
Chapter 1. Managing your IT environment: four things that you do wrong
Chapter 2. Eliminating management practices for individual sites in IT management
Chapter 3. Connecting everything into a single IT management cycle
Chapter 4. Monitoring: looking beyond the data center
Chapter 5 : Turning Problems into Solutions
Chapter 6: Unified Management with Examples
Chapter 4: Monitoring: a look beyond the data center
IT has already gone beyond our own data centers and almost every organization has one or two services outsourced. Although we may always have our own home monitoring and control facilities, we need to understand that in most cases, monitoring should continue beyond our data center. This applies to the placement of remote services and to a more accurate understanding of what our users actually experience when working with such services.
Monitoring technical meters versus end-user experience (EUE)
I call the traditional approach in IT monitoring “from the inside out” (or the inside-out). It starts at the data center and gradually moves to the end user. Figure 4.1 shows how a typical monitoring system starts with a backend: DBMS servers, applications, web servers, cloud servers, and so on. The most reasonable argument in favor of such a structure is that we have the best control over the equipment installed in our data center. If everything works well inside the data center, then there is every reason to believe that the end users using the data center services should be completely happy.
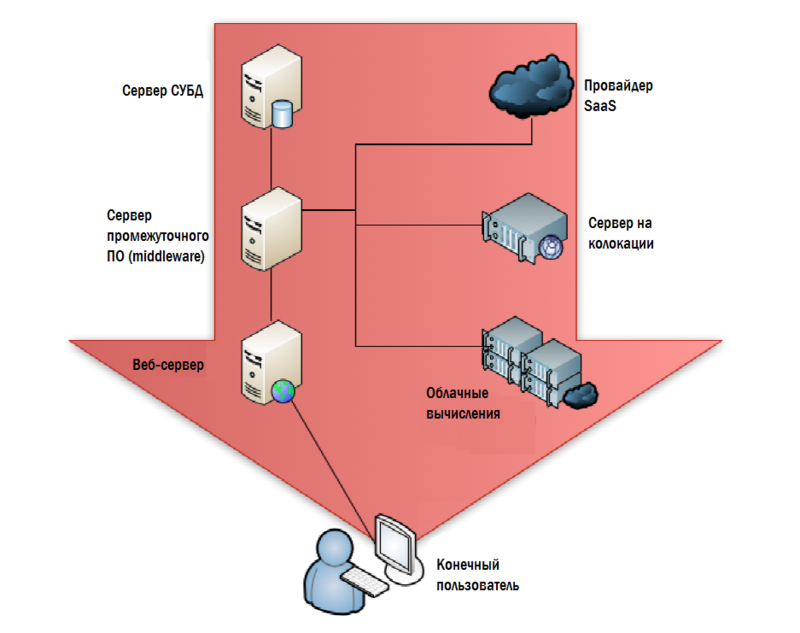
Figure 4.1: Monitoring from the data center.
Most SLAs are based on this approach. We prescribe a certain value of service availability in them, set threshold figures for metrics, information for which is collected in the data center: CPU, network, disk utilization, etc. We are also interested in low-level parameters: response time to requests, disk response time, network latency, and so on.
There is something deeply incorrect in the initial premises of this approach: if you got a beautiful brick during construction, it is not a fact that you will be able to build a house out of it that will not fall apart. In other words, what end users feel during their work is not a simple sum of technical data center metrics. If the data center works well, then users are usually satisfied, but this is not always the case.
Obviously, monitoring the key parameters of the data center is extremely important, but these are not the only things that need to be monitored and measured. Now in the industry there is an opinion that we need direct measurements of what the user is experiencing. In fact, “end-user experience” or EUE has become a commonly used term among advanced IT managers.
Another example can be given. Suppose you come to a restaurant: your steak does not seem to be cooked, you were brought the wrong side dish and a rude waiter. And the manager, who is standing in the kitchen, thinks that everything is in order: the steak is hot, the vegetables too, and the waiter smiles at him every time the manager sees him (her). He only thinks about the kitchen backend, and knows nothing about your unjustified expectations. In restaurants, this problem is solved by the fact that the manager periodically goes into the hall and asks guests, is everything all right? This is how the EUE is monitored: instead of evaluating the metrics of our inner kitchen, we have to go out into our heap of cubes - in the sense of a restaurant - and check for ourselves what is going on there.
How EUE makes SLA better
You set metrics for those values that in the EUE, in fact, will be very different: how many seconds are needed to complete such a transaction and so on. If this metric does not correspond to the real state of affairs, you can begin to understand the details of the infrastructure, why this is not so. And again we need to draw a traditional data center on the picture. But at the same time, instead of using the metric 'query execution time' or some other purely technical metric, we take the metric 'user perception' and use it to troubleshoot when the user believes that something is not working for us. Figure 4.2. shows how EUE monitoring is turning our model around.

Figure 4.2: Monitoring EUE.
You still have thresholds and other restrictions, but they are all set at the historical levels at which the EUE was executed. As shown in fig. 4.3., An inoperative EUE is your starting point from which you need to begin to understand the deeper and more technical measurement levels that can be used to determine what constitutes an end-user problem.

Figure 4.3: Tracking the cause of a bad EUE.
In real life, the emerging EUE problem is not always accompanied by tangible changes in the backend. The response time of the DBMS server is reduced by a millisecond or two, which leads to the fact that the application server needs additional half a second to process transactions, which entails a slowdown in seconds of the front-end server that displays the next page of information, and as a result, the user application fulfills two seconds more . Multiply these couple of seconds by the length of the working day, and you will find that an hour or more has been lost, and the user is forced to say to many customers of the company: "Sorry that for so long, the computer is slowing down today." In fig. 4.3., Slowly responding with a red flag are the DBMS server and the cloud computing service. Separately, not one of them triggers an alarm, but their joint work, causes a problem that is noticeable to the end user. Usually, a small fluctuation in the DBMS server does not trigger an alarm - a whole cascade of events leads to bad EUE. One thing we know for sure: if the EUE starts to deviate from the expected, this is an occasion to start an investigation of the reasons. Since we are lookingthe source of the problem , and not just doing regular monitoring, we will look more closely at small deviations in the operation of the infrastructure.
The ability to measure EUE allows you to create more realistic SLAs. Instead of saying to your users “We guarantee the system will respond to the request within 2 seconds”, you will say “Such and such a transaction will take no more than 3 seconds of processing time”. This means that the user can measure these things himself: "We press the input and count - one, two, three ... oh, it worked!". SLA of the type set frame correlated with the user and it understandable. They know when the system began to work slowly, because they measure the same things as you.
Ideally, you will know about a decrease in system performance before the user finds out, or very close to that, because you have a tool for measuring processes from the point of view of users.
How to do it: Synthetic transactions, transaction tracking, etc.
This type of monitoring is not always simple. Of course, it’s not so difficult to place monitoring agents on end-user computers, but what to do with a web application where the end-users are actually external clients of your company? They will not be delighted at all with the offer to install agent monitoring software, and only so that you have the opportunity to measure the performance of your application.
Instead, modern monitoring systems rely on transaction tracking. In this case, monitoring the components at your end allows you to see how a particular transaction goes through the whole system with an accurate measurement of the time from its beginning to completion. This can be done at various levels of detail. For example, tools that allow profiling of software performance can perform very detailed tracking of information through individual software modules. At the system management level, which is slightly higher, you can only track the start and end times of a transaction.
Often this approach in determining the real state of the system can be performed by inserting synthetic transactions into it.. The monitoring system pretends to be a client, places transactions in the system, and the result will not make any changes to the data and will be ignored. This enables the monitoring system to understand in more detail the actual execution time of various operations. This approach is illustrated in
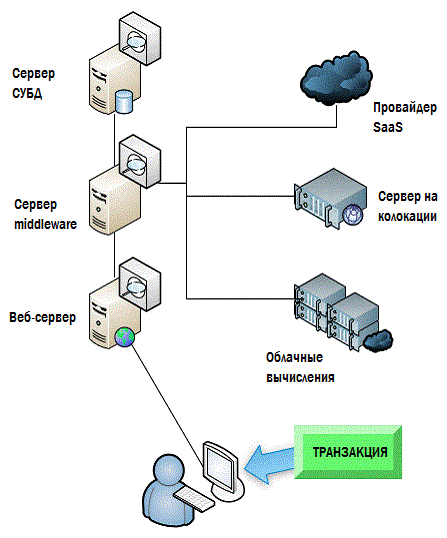
Figure 4.4 Figure 4.4: Using transaction tracking to monitor EUE.
There are a large number of variations of these methods, as well as specialized software with which this can all be implemented. To summarize, I would like to say that we must always remember that all this activity is aimed at measuring only one thing: EUE. From this point of view, you are not trying to understand the state of your system performance or find the main source of the problem. You are just trying to understand if there is a problem at all.
Top-down monitoring: from EUE to the root of all evil
EUE is considered an extremely high level diagnostic; she just says - "something went wrong," but what exactly - does not say. To understand the reasons, you need to return to the traditional monitoring system, which you always knew and loved, only this time, you will not look into the empty place: you will look for the source of the guaranteed existing problem.
By the way, this is not the samethe moment when you need to uncover special software - we discussed this in previous chapters. You still intend to use a monitoring system that allows you to see everything on one glass. However, this does not necessarily mean some kind of shell integrating specialized tools, it means a monitoring system that allows you to see each of your systems. If you have the right understanding of what performance should be at the level of each component, then such a system can quickly tell you where the problem is. And only now you can get a specialized tool and solve a particular problem - again, with knowledge of where the problem is and what component you are looking at,really is its source.
Where
does the EUE come from ? Why can't we just use a more careful selection of boundary values in your monitoring system that monitors the status of your backend, from which it can be understood that the EUE deviates from the expected values? The reason is that the EUE evaluates the performance of the entire system. The database may run slower, but its behavior does not affect the rest of the infrastructure. A slower router does not necessarily lead to a worsening of the EUE, although in combination with other factors it can be a watershed. That is why you need to look directly at how end users are doing, and only then look for the root of all evil.
Agent Monitoring vs. Agentless Monitoring
There are many arguments in favor of each of the best monitoring methods. Do you install agents? Some people do this and believe that agents provide the most detailed way to provide information. Others do not believe in the installation of agents and rightly point out that far from all environmental elements , agents can be installed in principle . Routers or services located outside of your responsibility usually do not send any information to the monitoring software, or support it with restrictions.
In one case, we can install agents, as shown in Figure 4.5.
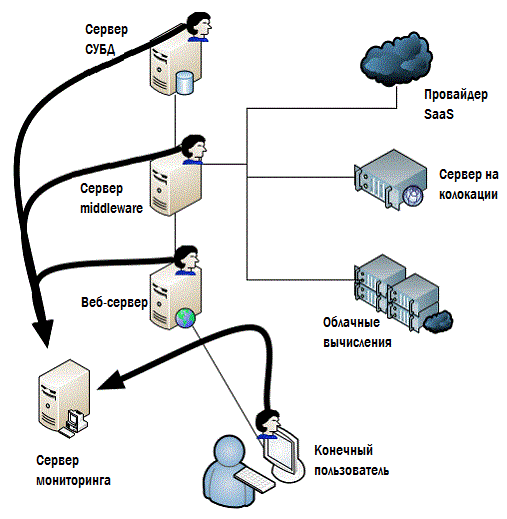
Figure 4.5: Monitoring through agents.
Typically, agents return information to a central monitoring system. Depending on the approach chosen, you can install these agents wherever they can be installed, in principle , perhaps even on user computers for spot monitoring (although they usually try not to)
Some monitoring solutions will allow you to do without installing agents on each system (it may not be necessary to do this everywhere). As shown in Figure 4.6, these solutions typically use external tools to evaluate system performance.
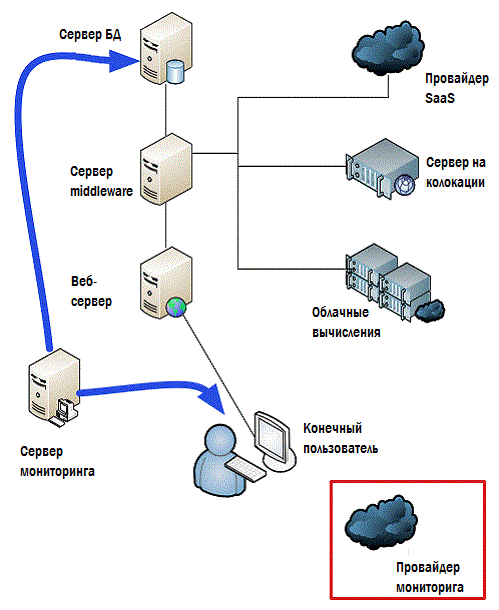
Figure 4.6: Agentless monitoring.
Whether agentless monitoring can collect a large amount of data, or in general all the data in principle, largely depends on the type of components on your network and what technologies are used. This is an important competitive point among many software manufacturers, and this must be given close attention.
The "monitoring provider" in Figure 4.6. is my starting point if we talk about modern applications. You almost always have to deploy hybrid systems that partially rely on agents and partially rely on agentless monitoring, if only because some of the monitoring objects will be located outside your data center.
Monitoring what does not belong to you
Equipment located outside our office and / or responsibility is the place where normal monitoring does not work. It is unlikely that Amazon will provide you with detailed statistics on the health of their Elastic Compute Cloud (EC2), it is unlikely that Microsoft will do the same for its Windows Azure. SalesForce.com is not going to send you DBMS response time values or CPU utilization parameters of its web servers. Even the hosting company where you host your servers is not going to show you detailed information about the percentage of lost packets on their routers and other statistics from their infrastructure.
But, actually, these numbers are importantfor you. If you have an application that depends on cloud computing components, colocation servers, SaaS solutions, or any other outsourced component, then the performance of these components will affect the performance of your applications and your EUE. In short, if Amazon has performance issues, your users will have the same thing. And here hybrid monitoring comes onto the scene . Figure 4.7 shows that it has the appearance of some external monitoring application that collects key performance information from most outsourced service providers for “cloud components”. The data collected is shown in red lines, the data that is transmitted to your central monitoring console is shown in green.
A lot of what I listed in the previous chapters begins to gather in one picture:
- You need your internal systems and external components displayed in a single view. There is no way to work with your subsystems as a system if you do not have the opportunity to assemble all the components into a single monitoring space.
- A key competitive feature for hybrid monitoring services is the number of external components that can be monitored. Make sure that the solution you choose is able to monitor everything you have, including outsourced services and equipment.
- Keeping track of EUE user expectations becomes important, because there can be large fluctuations between external services and your use of them. For example, you absolutely do not need to be aware of whether Azure responds slowly during periods when users do not use this service. You need to pay attention to it, and receive notifications about its status only if your users experience problems while working with it.

Figure 4.7: Hybrid monitoring.
In fact, this way of monitoring external outsourced components is a key point because most organizations feel that they cannot rely on cloud computing. “How will we manage this?” They ask themselves questions. “How will we monitor this?” In addition to data security, this is probably the most serious issue that arises when companies begin to consider adding “clouds” to their portfolio of IT solutions. They can be monitored in exactly this way.image: using specialized monitoring services that add a “cloud” to your single control screen. Tools like these place components that are placed outside the company at the same level of control as local components, and allow you to monitor them in a similar way.
An interesting way that some vendors choose when developing the architecture of such solutions. Many of them sell local solutions, which in many ways are similar to what is shown in Fig. 4.7. In fact, they monitor the cloud components on the provider side, but at the same time send this information to you; then their solution collects data from your local equipment and presents the information in a consolidated form.
But this is not the only way. In fig. 4.8. the scheme is givena hosted monitoring solution in which your internal performance information is sent to the cloud (shown by blue lines), then the cloud is combined with information about the health of your cloud components (red lines) and displayed in a single view on the web portal or in some other way.

Figure 4.8: External, hybrid monitoring.
This is a rather interesting model that relieves you of most of the responsibility for monitoring, which allows you to concentrate on the services provided to users. But one should not think that it will be the right model for any organization, although, as an option, it is worth considering.
Critical limits: When you need to control everything
The last important element of the puzzle is to make sure that you monitor everything. All-all-all !!! Take a look at Figure 4.9, with the infrastructure we used throughout this chapter. Anything missing from it? If we track each of the components shown, will monitoring be sufficient?
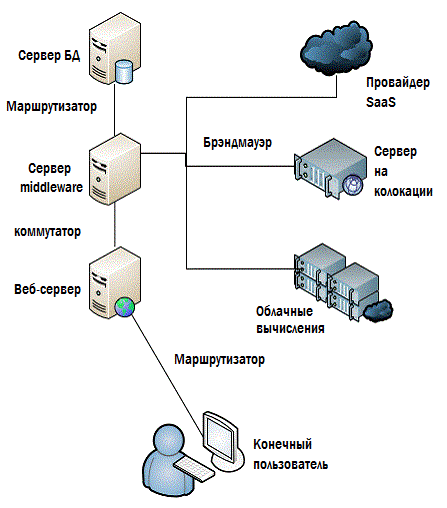
Figure 4.9: Is everything here that needs to be monitored?
Definitely not. There are many omissions in this scheme, and for the most part these are things that can have a significant impact on performance. Look at Fig. 4.10 - here everything is a little fuller and more detailed.
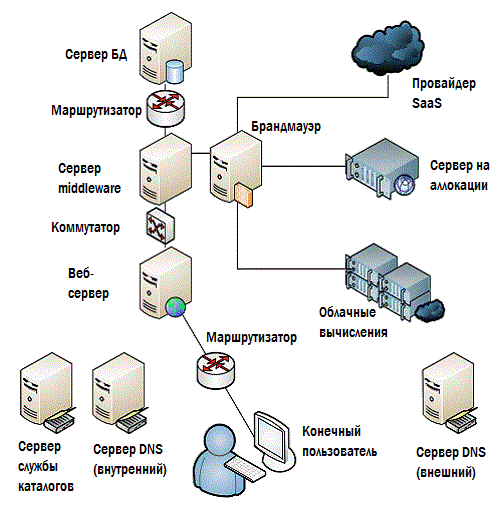
Figure 4.10: Make sure that you control everything.
Routers, switches, firewalls, directory service servers, DNS are both internal and external, and possibly much more. If your EUE starts to deviate from the usual values, then by luck, you should already look for the root of evil; but you can only do this if your monitoring solution can see any potential source of the problem.
For this reason, most monitoring solutions nowadays offer auto-detection, and besides, there is always the possibility of adding components yourself. Autodiscover can catch missed things, about which no one even assumed that they are also part of the overall system. Infrastructure elements, such as marshurizators and switches. Dependencies between directory services and DNS. Potential bottlenecks like firewalls and proxies. This is all important for normal operation, and it is necessary that everything be put together into a single picture, through which the general state of the system will be monitored.
Conclusion
Monitoring is a solution that allows us to manage the SLA, helps us find out where the problem is, and helps us keep the systems in a condition suitable for the business to fulfill its tasks. But traditional monitoring does not always mean the only or best way to meet business needs. More importantly, as businesses increasingly depend on components outside their local systems, traditional monitoring cannot collect all the necessary information into a single space. But these tasks are beyond the power of hybrid monitoring systems. Using a combination of traditional monitoring techniques, obtaining performance data from cloud systems, as well as other methods, we can collect information about the health of systems in a single view, a common panel of indicators and a complete picture.
In the next chapter ...
In the next chapter, we will address the fundamental problem that every organization has to deal with: repeatability . In other words, after the problem is solved, how do you manage to solve it faster if it suddenly happens again? We will look at how to turn problems into solutions and how we can improve service delivery in the future.
