The theory of happiness. Introduction to Merphology
I continue to acquaint Habr's readers with chapters from his book “The Theory of Happiness” with the subtitle “Mathematical foundations of the laws of meanness”. This is not yet a popular science book published, very informally telling how mathematics allows us to look at the world and life of people with a new degree of awareness. It is for those who are interested in science and for those who are interested in life. And since our life is complex and, by and large, unpredictable, the emphasis in the book is mainly on probability theory and mathematical statistics. Here theorems are not proved and the fundamentals of science are not given; this is by no means a textbook, but what is called recreational science. But it is this almost playful approach that allows us to develop intuition, brighten up with vivid examples lectures for students and, finally, explain to nemathematicians and our children,
This is one of the first chapters in which, using the example of a cyclist, we consider the tools we need to measure injustice: the Lorenz curve and the Gini index, as well as the notorious Pareto and the formidable inspector are mentioned.

In this book, we will focus on various troubles. Habitual, expected and so predictable that they received the status of laws. A lot of them have already been formulated: this is the law of a falling sandwich, and Murphy's law: " If any trouble can happen, it will happen. " And the laws of Chisholm on the topic: " When things are going well, something should happen in the very near future. "and observation to Ettore:" The next line always moves faster. "Most of them are quite trivial, but according to the law of Muir." When we try to pull out one thing, it turns out that it is connected to everything else."We will try to find a rational grain of these patterns, but not to deal with them, but for pleasure. And since we will use mathematics, the pleasure will be peculiar and useful, unlike the result itself. Well, if our the reasoning will lead us too far, we can adopt the Percig's postulate: " The number of reasonable hypotheses explaining any given phenomenon is infinite. "In the end, Grossman, quoting H.L. Menkin, correctly pointed out that" Difficult problems always have simple, easy to understand wrong solutions. "
Some troubles that happen to us are natural and deterministic, and some are stochastic, probabilistic in nature.
For example, if you lowered your salary by 10%, and then apologized and increased by 10%, then in the end you lost because Moreover, if the salary is raised first, and then, without even apologizing, it is reduced by the same 10%, the result will be the same, since it does not matter in what order to multiply the coefficients. It is very simple, insulting, but it has nothing to do with luck.
Another example of deterministic trouble is the magic that happens in our pockets with headphones: we put neatly folded headphones in our pocket, and after half an hour a miracle happens there, and we take out a wild knot of wires from our pocket. In 2007, a serious scientific article by two scientists from the sunny and serene San Diego “Spontaneous knot formation on an excited thread” was published., in which the entanglement of headphones in a pocket is analyzed and modeled in detail. Based on knot theory, probability theory, and physical experiments, the authors convincingly show that with the standard winding method, the headphones should really get confused, and after only a few seconds of shaking. However, this is what we are seeing, only the derived entanglement speed is unexpected here. This nuisance is quite possible to fight in a mathematical way: you need to change the way the headphones are folded — not the rings that tend to form knots, but a series of loops in a mutually opposite direction, as shown in the figure for example. With this method of folding loops mutually destroy each other and the nodes are not formed. For many years now I have been folding my headphones in this way, feeling like a cool topologist, and every time I am glad
 One way to fold the wires without causing them to become tangled. He is also good because along the way you put your fingers in the mudra of love.
But among the laws of stochastic nature, not all are equally interesting. For example, Buk's law: “You always find the keys in the last pocket.” Has no rational basis. A simple calculation shows that with an equal probability of finding keys for all pockets, the latter is no different from the others. Is that you will randomly check all the pockets, looking at them at random and several times. In this case, the probability function for the number of the pocket in which the keys will be will be forpockets are described by the eometric distribution : and the expected pocket number will be equal to . That is, in a sense, the law of Buk is executed. However, in this way we are looking for keys, unless it is very urgent for us to get to the restroom, and then this is a complete law of meanness.
We will be interested in the laws of paradoxical and instructive, laws that look like evil rock, choosing the most annoying and unpleasant of many options, in spite of intuition suggesting that this choice should not be the most likely.
I am a big enthusiast of cycling amateur sports. What could be better than rushing along the track early in the morning, through the chill, rolling down from a slight slope ... this feeling is worth it to overcome endless rises or resistance to headwind for it! However, sometimes it seems that the ascents seem to be more than descents, and the wind strives to be the opposite, wherever you turn. In the books on merphology in this connection the law of the cyclist is given :
Let's take a look at the law of the cyclist from the theory of probability. If I take a lot of selfies during my walk, and then I’ll get them out of the mixed pack without looking, then a significant part of the pictures will show me a bent figure in an orange helmet, meekly crawling uphill or against the wind. The probability of seeing a flying and shining cyclist in the picture, with an advertising picture, alas, will be only about 20%. And what will the statistics say? If we let out a large crowd of cyclists on a hilly track, wait a bit, and observe their density, we will see how the majority of athletes are crowding in difficult areas, and the probability of finding a serenely smiling face in the total mass will not be that great!
 The result of a simulation of the movement of the ensemble of cyclists on a hilly track. For each of the participants of the movement, its power is set, it determines its maximum speed, both on the ascent and on the descent (air resistance is taken into account). It can be seen as soon after the start of the movement, the majority of the entire ensemble focuses on the ascents.
Let's, as it was once at school, let us show on the graph the dependence of the movement of a cyclist on time, when driving on a symmetrical triangular hill. We will only do everything in an adult way, on our own scale of the task: we will measure the distance not in kilometers, but in fractions of a common path, and we will do the same with time of travel. The first half of the journey (cut) the cyclist moved slowly and for a long time - the whole time, and the second (segment ) overcome quickly - for of time.
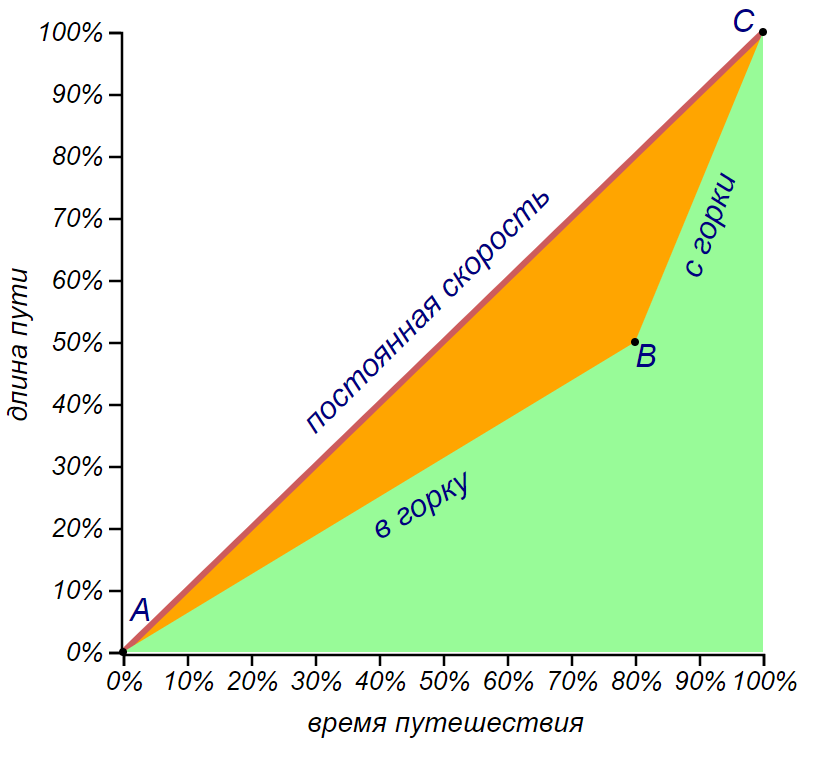
Schedule of movement of the cyclist in shares of the total path and time.
There is one quite universal way of judging the injustice of this world, adopted by econometricians, demographers, environmentalists, or marketers - the Lorenz curve and the associated Gini index. For the well-known distribution of something valuable, for example, money, in a certain population, it is possible, after sorting out the members of the set according to the level of wealth, to build a cumulative curve, normalizing the X axis to the population size, and the Y axis to its general welfare. The result will be a curve named after the American economist Max Otto Lorentz. When we plotted the movements of the cyclist, we essentially constructed the Lorenz curve for the distribution of speeds over segments of a track consisting of only two columns.
The distribution of the speed of the cyclist on the traversed path.
Of course, not every movement schedule can be perceived as a Lorenz curve. Before you build it, you need to sort the travel periods by speed, and then proceed to build. In other words, you first need to build a histogram of speeds, and then successively add the contributions of all the columns of the histogram, starting with the contribution of small values, ending with the largest. The result should be everywhere a concave curve that runs below the diagonal (). This diagonal is called the equality curve ; in our case, it corresponds to a constant (average) velocity all the way, or a histogram with one single bar (delta-like probability density function). And in the economic sense - the general equality of welfare. The more the Lorenz curve deviates from the equality curve, the less “fair” the distribution can be considered. If we study the laws of meanness and injustice of our world, it is reasonable to use the terminology and tools used for the study of justice.
The area under the Lorenz curve for any distribution other than delta-shaped will be less than the area under the equality curve. Their difference can serve as a formal characteristic of the inequality or “injustice” of the distribution. This characteristic reflects the Gini index . It is calculated as the doubled area of the figure formed by the equality curve and the Lorenz curve. For an ideal world, the Gini index is 0, in the most dreadful variant it tends to one. In the example we have considered, it is equal to 0.35. This is quite a good indicator. For example, the distribution of wealth among the population in Russia now has a Gini index of 0.39, in the US it is 0.49, in Austria and Sweden it does not exceed 0.3, and in 2017 it amounted to 0.66 for the whole World. So the situation with cyclists, of course, offensive and unfair, but quite tolerant.
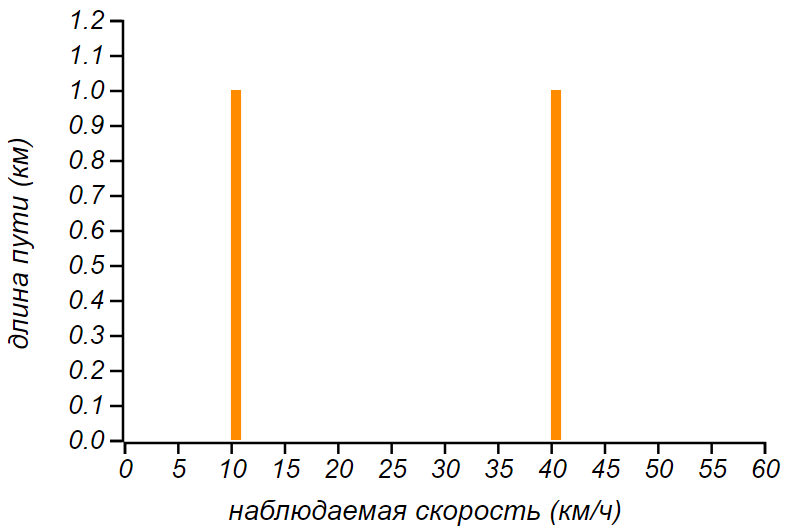
We considered the distribution of speeds by distance, and what would happen if we were given a distribution of speeds over time (divide the time of the journey into intervals and count the number of intervals with a given speed). Due to the dimensionlessness of the Lorentz diagram, we can again draw the corresponding curve, and even compare it with the previous result. For example, let half the travel time, say, an hour, a cyclist drive at a speed of 10 km / h, and an hour - at a speed of 40 km / h (it doesn’t matter in what order). Then at a low speed will have 1/5 of the way, and at high speed - 4/5. The Lorenz curve, in the case of a velocity distribution over time, will be a reflection of the Lorenz curve for the velocity distribution over a distance, relative to the diagonal perpendicular to the equality line. In this case, the Gini index will be the same, because when the curve is reflected, the area under it will not change. So, in terms of the level of injustice, these two different conditions turn out to be the same, although according to sensations, the second case is much nicer!

Schedule of movement (Lorenz curve) of a cyclist in the case of an equal following time with two different speeds.
Please note that with the help of some formal index we began to compare completely different and incomparable things, it is both tempting and dangerous. You need to be aware that formal indexes and criteria are always equal to something, regardless of whether it makes sense or not. We compare the distribution of wealth among the population of countries and the distribution of time spent on overcoming the path in terms of differences from some option that would be considered fair. While we conduct frivolous and, at times, hooligan conversations about the laws of meanness, perhaps this is a justified comparison, but in mathematics it is, of course, impossible to do. The Lorenz curve, and according to it the Gini index can be formally calculated for the histogram of the brightness of pixels in the picture or for the frequency of words in live speech, it will have nothing to do with justice, and there will be very little sense. Therefore, bearing in mind the Gini index for anything, we will call itmeanness index , so as not to mislead the reader by the scientific nature of terms.
The conclusion that the cyclist makes when puffing in low gear: “the world is unjust and most of the forces are taken away by the most foolish part of the work” are often referred to as the Pareto principle or the 80/20 principle. This is an absolute empiricism; nobody argued the Pareto principle, but it is so often quoted that it already gives the impression of truth. It is used as an excuse and as an instruction, it is found in various manifestations and sometimes it works, for example, the 80/20 principle corresponds to the meanness index of the order of 0.6 - as for the distribution of wealth throughout the world. Understanding that this is not the fate of fate, but the simplest mathematics, with which there is no sense to fight, one can learn to enjoy both the lengthy ups and tedious, but inevitable stages of work, at least by solving problems in the mind, or by meditating. Taoists sought to live forever, and correctly reasoned that, together with the work on the body, to achieve their goal, the preparation of the mind is required. After all, for eternal life you need not only the ability to let go of affection, but also patience,
The Pareto principle has a more rigorous generalization that is useful for understanding. The law of meanness, named after the nameless cyclist, has the official scientific title: Inspection Paradox . This well-known phenomenon is found in a variety of studies related to sociological surveys, testing in the theory of failures (the section of applied mathematics dealing with the reliability of complex systems), implicitly but systematically shifting the observed results towards more frequently observed phenomena.
We give a classic example, with a survey of passengers of public transport. Many buses operate on the line a day, during the relatively short rush hour the buses overflow, and the rest of the time they go almost empty. If we begin to interview passengers, then a significant part of them will be in a crowded bus (there are simply more people there), and we will get an expression of general discontent. If we interview the drivers, they will complain about the incompleteness of a significant part of the routes and the unreasonableness of the authorities who drive them to waste. A flexible schedule will smooth the situation, but, in any case, the Lorenz curve will deviate from the equality curve, which corresponds to the incredible situation of always the same number of passengers in all buses.
In the introductions to the theory of probability, a special opaque bag is often found, in which mathematicians put various objects, and then at random pull out, making, sometimes, very profound conclusions. The resolution of the paradox is that we analyze the passenger traffic system as a whole and put buses into the bag, and by conducting a survey, we extract passengers from it at random (inspect) and try to draw conclusions from their data. The picture shows the difference:
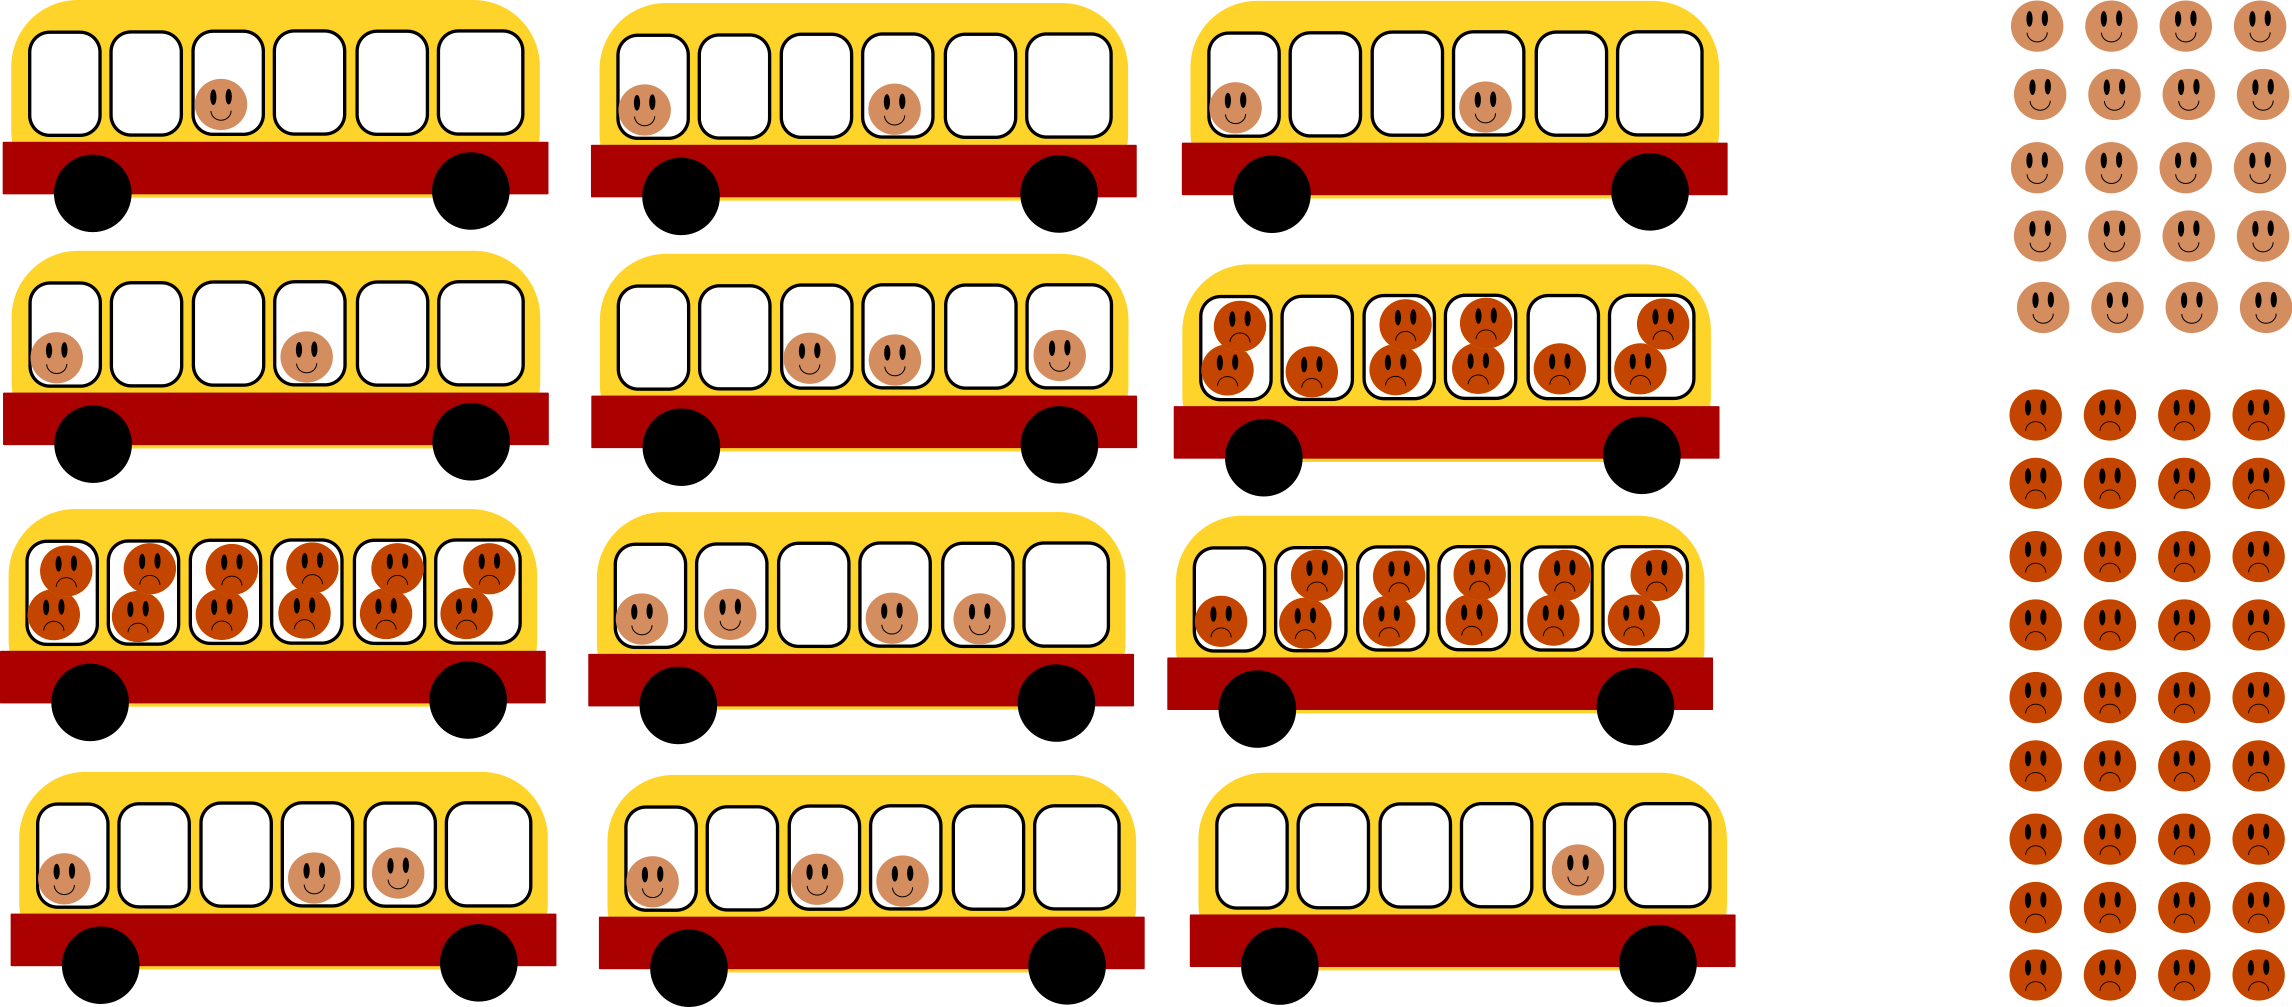 Statistics on buses says that 75% of them are free and it goes in vain. At the same time, a survey of passengers will find that 64% of the passengers who traveled that day were in a crowded vehicle.
Let's consider this situation by constructing the Lorenz curve, this time, real, for the number of passengers in the buses from the previous figure. To do this, sort the buses by the number of passengers and successively summarize the contribution of each of them to the total passenger traffic:
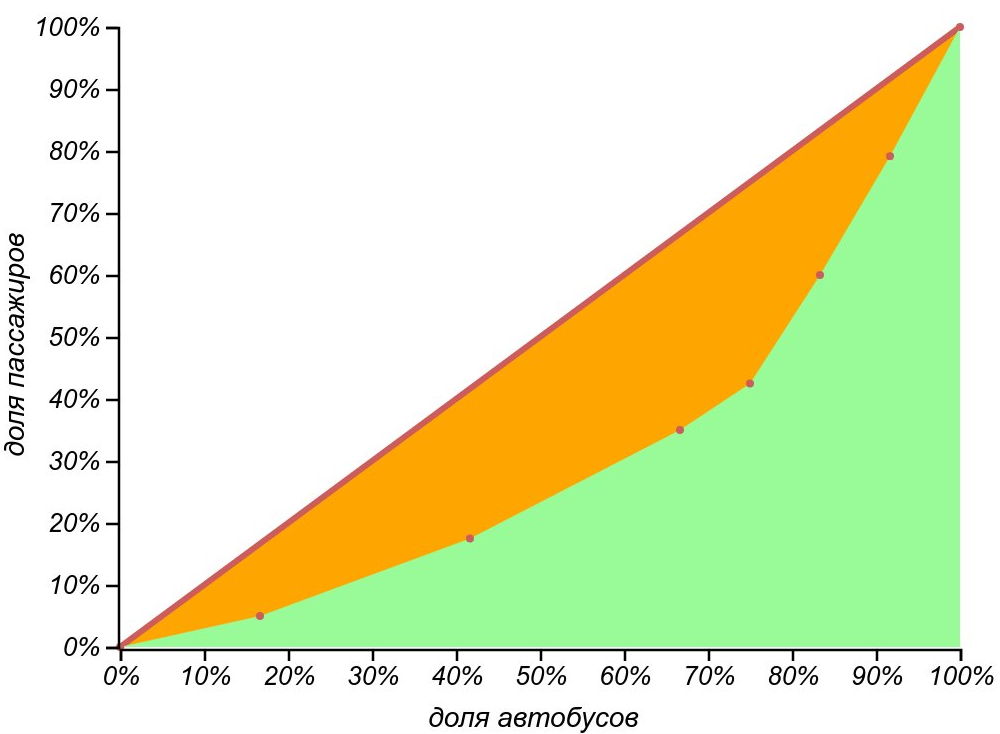
The Lorenz curve illustrates well the observed injustice of the bus situation: half of the buses carry only one fifth of the passenger traffic.
The Lorenz curve, in this case, shows how the quantiles of the distribution of the number of elements in some groups (the horizontal axis) are shifted when analyzing the distribution of elements according to group membership (vertical axis). This, in fact, is the inspection paradox: the picture that the inspector observes turns out to be distorted, because he analyzes not the groups, but the elements of the groups, while the observed mean and median are shifted towards a more “weighty tail” of the distribution.
By itself, our cyclist law is very simple, but now and then it will aggravate other laws of meanness, adding to them a sullen emotional tint. Reflecting on the laws of meanness, I like to think about the distortion of the perception of the world by the inspector in terms of changing the color curves of an image. In raster graphic editors, we use the Curves tool to change images by shifting the distribution of the number of pixels in brightness. For example, how the Lorenz curve, which we obtained for buses, changes the perception of reality. The picture of the world becomes darker, as we expect.
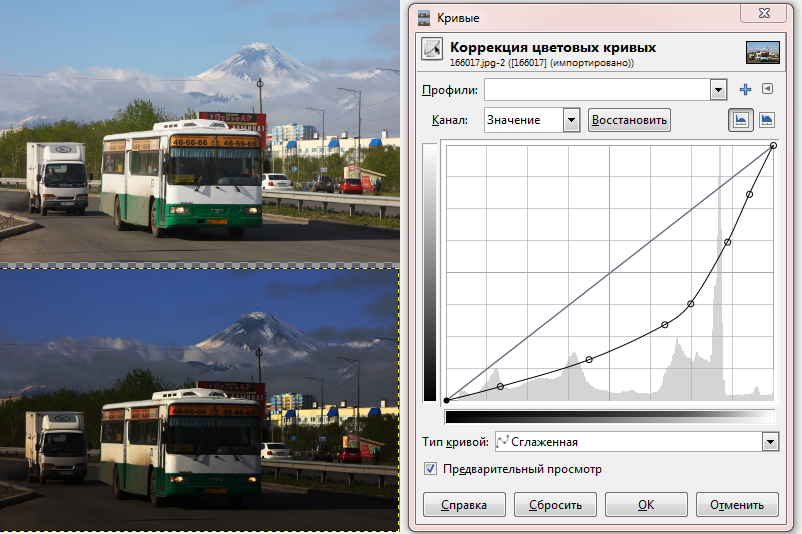
The Lorenz curve from the example, applied as the “Curve” filter in the raster graphic editor, makes the visible picture of the Kamchatka bus darker. Complaining that the buses are “always late” and “always full of people”, take comfort in the fact that this is just an illusion associated with the paradox of inspection!
The paradox of inspection can manifest itself in its extreme: if among the groups of elements placed in our theoretical bag, there are those whose elements are not just rare, but not observable at all, we get a systematic error of the survivor. This phenomenon is often told in various demotivating articles, for beginning businessmen and programmers, assuring them that the successful way described in the books is most likely not for them, because, they say, unsuccessful books do not write. However, this has nothing to do with the laws of meanness, so let's leave these arguments. By and large, the paradoxes described are methodological errors made when receiving and processing data, it is useful to know about them, but, unfortunately, they lead to a widespread opinion about statistics as dishonest manipulation of factual data among people very far from these methods.
We will meet the law of the cyclist and his influence more than once: standing in a queue or at a bus stop, observing the injustice of the distribution of wealth. And the Lorenz curves and the meanness index will allow us to compare outrageously different things boldly. Mathematics is an exact science, but nobody forbids hooliganism mathematicians. In his own circle, of course, and without fights.
The experience of publishing chapters on Habré turned out to be very useful: the comments of the readers allowed me to correct the wording, expand the set of examples and my own outlook. I would be pleased to tell you in the book about the help that our community rendered to its editing and to thank the creators and residents of Habr for participating in its writing.
Published chapters:
This is one of the first chapters in which, using the example of a cyclist, we consider the tools we need to measure injustice: the Lorenz curve and the Gini index, as well as the notorious Pareto and the formidable inspector are mentioned.
Law is law
In this book, we will focus on various troubles. Habitual, expected and so predictable that they received the status of laws. A lot of them have already been formulated: this is the law of a falling sandwich, and Murphy's law: " If any trouble can happen, it will happen. " And the laws of Chisholm on the topic: " When things are going well, something should happen in the very near future. "and observation to Ettore:" The next line always moves faster. "Most of them are quite trivial, but according to the law of Muir." When we try to pull out one thing, it turns out that it is connected to everything else."We will try to find a rational grain of these patterns, but not to deal with them, but for pleasure. And since we will use mathematics, the pleasure will be peculiar and useful, unlike the result itself. Well, if our the reasoning will lead us too far, we can adopt the Percig's postulate: " The number of reasonable hypotheses explaining any given phenomenon is infinite. "In the end, Grossman, quoting H.L. Menkin, correctly pointed out that" Difficult problems always have simple, easy to understand wrong solutions. "
Some troubles that happen to us are natural and deterministic, and some are stochastic, probabilistic in nature.
For example, if you lowered your salary by 10%, and then apologized and increased by 10%, then in the end you lost because Moreover, if the salary is raised first, and then, without even apologizing, it is reduced by the same 10%, the result will be the same, since it does not matter in what order to multiply the coefficients. It is very simple, insulting, but it has nothing to do with luck.
Another example of deterministic trouble is the magic that happens in our pockets with headphones: we put neatly folded headphones in our pocket, and after half an hour a miracle happens there, and we take out a wild knot of wires from our pocket. In 2007, a serious scientific article by two scientists from the sunny and serene San Diego “Spontaneous knot formation on an excited thread” was published., in which the entanglement of headphones in a pocket is analyzed and modeled in detail. Based on knot theory, probability theory, and physical experiments, the authors convincingly show that with the standard winding method, the headphones should really get confused, and after only a few seconds of shaking. However, this is what we are seeing, only the derived entanglement speed is unexpected here. This nuisance is quite possible to fight in a mathematical way: you need to change the way the headphones are folded — not the rings that tend to form knots, but a series of loops in a mutually opposite direction, as shown in the figure for example. With this method of folding loops mutually destroy each other and the nodes are not formed. For many years now I have been folding my headphones in this way, feeling like a cool topologist, and every time I am glad
But among the laws of stochastic nature, not all are equally interesting. For example, Buk's law: “You always find the keys in the last pocket.” Has no rational basis. A simple calculation shows that with an equal probability of finding keys for all pockets, the latter is no different from the others. Is that you will randomly check all the pockets, looking at them at random and several times. In this case, the probability function for the number of the pocket in which the keys will be will be forpockets are described by the eometric distribution : and the expected pocket number will be equal to . That is, in a sense, the law of Buk is executed. However, in this way we are looking for keys, unless it is very urgent for us to get to the restroom, and then this is a complete law of meanness.
We will be interested in the laws of paradoxical and instructive, laws that look like evil rock, choosing the most annoying and unpleasant of many options, in spite of intuition suggesting that this choice should not be the most likely.
If long, long, long, if long along the path ...
I am a big enthusiast of cycling amateur sports. What could be better than rushing along the track early in the morning, through the chill, rolling down from a slight slope ... this feeling is worth it to overcome endless rises or resistance to headwind for it! However, sometimes it seems that the ascents seem to be more than descents, and the wind strives to be the opposite, wherever you turn. In the books on merphology in this connection the law of the cyclist is given :
No matter where you go, it's uphill and upwind.I live in Kamchatka, in Petropavlovsk there are a lot of slides, and while riding around the city, they cannot be avoided. However, I should be reassured by the thought that, starting my way out of the house, I return home again, which means that the total descent should be equal to the total ascent. Especially honest is the radial route. Imagine a 2-kilometer highway consisting of one symmetrical slide: kilometer up, kilometer down. I can go up the slope for a long time at a speed of 10 km / h, and on the way down I try to keep the speed at 40 km / h (yes, I’m careful and I ride in a helmet). It means that I will spend four times more time on ascent than on descent, and the general picture will be like this: 4/5 of the journey time will go on a weighted ascent, and only 1/5 - on a pleasant descent. It turns out to be a shame - 80% of the time for walking are difficult parts of the way! If I roll out of our hilly city,
Let's take a look at the law of the cyclist from the theory of probability. If I take a lot of selfies during my walk, and then I’ll get them out of the mixed pack without looking, then a significant part of the pictures will show me a bent figure in an orange helmet, meekly crawling uphill or against the wind. The probability of seeing a flying and shining cyclist in the picture, with an advertising picture, alas, will be only about 20%. And what will the statistics say? If we let out a large crowd of cyclists on a hilly track, wait a bit, and observe their density, we will see how the majority of athletes are crowding in difficult areas, and the probability of finding a serenely smiling face in the total mass will not be that great!
Let's, as it was once at school, let us show on the graph the dependence of the movement of a cyclist on time, when driving on a symmetrical triangular hill. We will only do everything in an adult way, on our own scale of the task: we will measure the distance not in kilometers, but in fractions of a common path, and we will do the same with time of travel. The first half of the journey (cut) the cyclist moved slowly and for a long time - the whole time, and the second (segment ) overcome quickly - for of time.
Schedule of movement of the cyclist in shares of the total path and time.
There is one quite universal way of judging the injustice of this world, adopted by econometricians, demographers, environmentalists, or marketers - the Lorenz curve and the associated Gini index. For the well-known distribution of something valuable, for example, money, in a certain population, it is possible, after sorting out the members of the set according to the level of wealth, to build a cumulative curve, normalizing the X axis to the population size, and the Y axis to its general welfare. The result will be a curve named after the American economist Max Otto Lorentz. When we plotted the movements of the cyclist, we essentially constructed the Lorenz curve for the distribution of speeds over segments of a track consisting of only two columns.
The distribution of the speed of the cyclist on the traversed path.
Of course, not every movement schedule can be perceived as a Lorenz curve. Before you build it, you need to sort the travel periods by speed, and then proceed to build. In other words, you first need to build a histogram of speeds, and then successively add the contributions of all the columns of the histogram, starting with the contribution of small values, ending with the largest. The result should be everywhere a concave curve that runs below the diagonal (). This diagonal is called the equality curve ; in our case, it corresponds to a constant (average) velocity all the way, or a histogram with one single bar (delta-like probability density function). And in the economic sense - the general equality of welfare. The more the Lorenz curve deviates from the equality curve, the less “fair” the distribution can be considered. If we study the laws of meanness and injustice of our world, it is reasonable to use the terminology and tools used for the study of justice.
The area under the Lorenz curve for any distribution other than delta-shaped will be less than the area under the equality curve. Their difference can serve as a formal characteristic of the inequality or “injustice” of the distribution. This characteristic reflects the Gini index . It is calculated as the doubled area of the figure formed by the equality curve and the Lorenz curve. For an ideal world, the Gini index is 0, in the most dreadful variant it tends to one. In the example we have considered, it is equal to 0.35. This is quite a good indicator. For example, the distribution of wealth among the population in Russia now has a Gini index of 0.39, in the US it is 0.49, in Austria and Sweden it does not exceed 0.3, and in 2017 it amounted to 0.66 for the whole World. So the situation with cyclists, of course, offensive and unfair, but quite tolerant.
We considered the distribution of speeds by distance, and what would happen if we were given a distribution of speeds over time (divide the time of the journey into intervals and count the number of intervals with a given speed). Due to the dimensionlessness of the Lorentz diagram, we can again draw the corresponding curve, and even compare it with the previous result. For example, let half the travel time, say, an hour, a cyclist drive at a speed of 10 km / h, and an hour - at a speed of 40 km / h (it doesn’t matter in what order). Then at a low speed will have 1/5 of the way, and at high speed - 4/5. The Lorenz curve, in the case of a velocity distribution over time, will be a reflection of the Lorenz curve for the velocity distribution over a distance, relative to the diagonal perpendicular to the equality line. In this case, the Gini index will be the same, because when the curve is reflected, the area under it will not change. So, in terms of the level of injustice, these two different conditions turn out to be the same, although according to sensations, the second case is much nicer!
Schedule of movement (Lorenz curve) of a cyclist in the case of an equal following time with two different speeds.
Please note that with the help of some formal index we began to compare completely different and incomparable things, it is both tempting and dangerous. You need to be aware that formal indexes and criteria are always equal to something, regardless of whether it makes sense or not. We compare the distribution of wealth among the population of countries and the distribution of time spent on overcoming the path in terms of differences from some option that would be considered fair. While we conduct frivolous and, at times, hooligan conversations about the laws of meanness, perhaps this is a justified comparison, but in mathematics it is, of course, impossible to do. The Lorenz curve, and according to it the Gini index can be formally calculated for the histogram of the brightness of pixels in the picture or for the frequency of words in live speech, it will have nothing to do with justice, and there will be very little sense. Therefore, bearing in mind the Gini index for anything, we will call itmeanness index , so as not to mislead the reader by the scientific nature of terms.
The conclusion that the cyclist makes when puffing in low gear: “the world is unjust and most of the forces are taken away by the most foolish part of the work” are often referred to as the Pareto principle or the 80/20 principle. This is an absolute empiricism; nobody argued the Pareto principle, but it is so often quoted that it already gives the impression of truth. It is used as an excuse and as an instruction, it is found in various manifestations and sometimes it works, for example, the 80/20 principle corresponds to the meanness index of the order of 0.6 - as for the distribution of wealth throughout the world. Understanding that this is not the fate of fate, but the simplest mathematics, with which there is no sense to fight, one can learn to enjoy both the lengthy ups and tedious, but inevitable stages of work, at least by solving problems in the mind, or by meditating. Taoists sought to live forever, and correctly reasoned that, together with the work on the body, to achieve their goal, the preparation of the mind is required. After all, for eternal life you need not only the ability to let go of affection, but also patience,
The Pareto principle has a more rigorous generalization that is useful for understanding. The law of meanness, named after the nameless cyclist, has the official scientific title: Inspection Paradox . This well-known phenomenon is found in a variety of studies related to sociological surveys, testing in the theory of failures (the section of applied mathematics dealing with the reliability of complex systems), implicitly but systematically shifting the observed results towards more frequently observed phenomena.
We give a classic example, with a survey of passengers of public transport. Many buses operate on the line a day, during the relatively short rush hour the buses overflow, and the rest of the time they go almost empty. If we begin to interview passengers, then a significant part of them will be in a crowded bus (there are simply more people there), and we will get an expression of general discontent. If we interview the drivers, they will complain about the incompleteness of a significant part of the routes and the unreasonableness of the authorities who drive them to waste. A flexible schedule will smooth the situation, but, in any case, the Lorenz curve will deviate from the equality curve, which corresponds to the incredible situation of always the same number of passengers in all buses.
In the introductions to the theory of probability, a special opaque bag is often found, in which mathematicians put various objects, and then at random pull out, making, sometimes, very profound conclusions. The resolution of the paradox is that we analyze the passenger traffic system as a whole and put buses into the bag, and by conducting a survey, we extract passengers from it at random (inspect) and try to draw conclusions from their data. The picture shows the difference:
Let's consider this situation by constructing the Lorenz curve, this time, real, for the number of passengers in the buses from the previous figure. To do this, sort the buses by the number of passengers and successively summarize the contribution of each of them to the total passenger traffic:
The Lorenz curve illustrates well the observed injustice of the bus situation: half of the buses carry only one fifth of the passenger traffic.
The Lorenz curve, in this case, shows how the quantiles of the distribution of the number of elements in some groups (the horizontal axis) are shifted when analyzing the distribution of elements according to group membership (vertical axis). This, in fact, is the inspection paradox: the picture that the inspector observes turns out to be distorted, because he analyzes not the groups, but the elements of the groups, while the observed mean and median are shifted towards a more “weighty tail” of the distribution.
By itself, our cyclist law is very simple, but now and then it will aggravate other laws of meanness, adding to them a sullen emotional tint. Reflecting on the laws of meanness, I like to think about the distortion of the perception of the world by the inspector in terms of changing the color curves of an image. In raster graphic editors, we use the Curves tool to change images by shifting the distribution of the number of pixels in brightness. For example, how the Lorenz curve, which we obtained for buses, changes the perception of reality. The picture of the world becomes darker, as we expect.
The Lorenz curve from the example, applied as the “Curve” filter in the raster graphic editor, makes the visible picture of the Kamchatka bus darker. Complaining that the buses are “always late” and “always full of people”, take comfort in the fact that this is just an illusion associated with the paradox of inspection!
The paradox of inspection can manifest itself in its extreme: if among the groups of elements placed in our theoretical bag, there are those whose elements are not just rare, but not observable at all, we get a systematic error of the survivor. This phenomenon is often told in various demotivating articles, for beginning businessmen and programmers, assuring them that the successful way described in the books is most likely not for them, because, they say, unsuccessful books do not write. However, this has nothing to do with the laws of meanness, so let's leave these arguments. By and large, the paradoxes described are methodological errors made when receiving and processing data, it is useful to know about them, but, unfortunately, they lead to a widespread opinion about statistics as dishonest manipulation of factual data among people very far from these methods.
We will meet the law of the cyclist and his influence more than once: standing in a queue or at a bus stop, observing the injustice of the distribution of wealth. And the Lorenz curves and the meanness index will allow us to compare outrageously different things boldly. Mathematics is an exact science, but nobody forbids hooliganism mathematicians. In his own circle, of course, and without fights.
The experience of publishing chapters on Habré turned out to be very useful: the comments of the readers allowed me to correct the wording, expand the set of examples and my own outlook. I would be pleased to tell you in the book about the help that our community rendered to its editing and to thank the creators and residents of Habr for participating in its writing.