We put the Lucene index in RAM using the Azul Zing JVM
- Transfer
The entire Google search index has been in RAM for at least 5 years. Why not try the same thing with the search index for Lucene?
Recently, RAM has become quite inexpensive, so for highly loaded resources, it is reasonable to expect a serious performance improvement by placing the entire search index in RAM.
The obvious question is whether we should try to load the entire index into the class provided by Lucene
Unfortunately, this class is known for creating a very serious load on the garbage collector (GC): each file is represented as a list of fragments of the type
Despite these problems with the class
I recently learned about Java the Zing virtual machine developed by Azul , which provides a pause-free garbage collector, even for very large volumes of heap. Those. in theory, the heavy memory load generated by the class
By default, the utilities in the luceneutil kit measure the average response time, while discarding extremely interesting extreme values. This is done because these utilities are designed to test the algorithms and the effectiveness of the changes made, specifically ignoring random deviations introduced by extraneous delays at the level of the operating system, disk subsystem, garbage collector, etc.
But for real search applications, what really matters is the total response time for all search queries. Search is essentially an interactive process: the user sits and waits for the search result to return to him, and only then clicks on the links. If even 1% of requests takes a lot of time, then this is already a serious problem! Users are impatient, and very quickly move to competitors.
Therefore, I modified lucenutil to allocate a load client ( sendTasks.py ) into a separate module , which saves response time for all requests; as well as scripts ( loadGraph.py and responseTimeGraph.py ) for plotting response time graphs. The directly running script was also improved.responseTimeTests.py for executing a series of tests, with increasing load (requests / sec), automatically stopping testing when the load begins to exceed server performance. As a nice addition, this approach allows you to measure the real server performance, rather than extrapolating it from the averaged indicators.
For the most correct simulation of the time of sending real requests, the client sends them in accordance with the Poisson distribution. The testing script works in one thread, and if we send requests at a speed of 200 requests per second, and the server froze for 5 seconds for some reason, then the request queue will grow to 1000. Unfortunately, a lot of load tests behave differently, and start a separate client stream for each emulated client.
The client works (via ssh) on a separate machine, which is an important point, because the Lucene server (and not just the JVM) periodically sags in performance (for example, swap occurs), which can slow down the work of the load client and, thus, distort the results . Ideally, the client runs on a dedicated machine and does not experience any pauses. Additionally, the Python garbage collector is disabled on the client to eliminate its negative impact.
To test Zing, I indexed the full database of English Wikipedia as of 2.05.2012, having a volume of 28.78 GB of plain text representing 33.3 million documents, about 1KB in size, including built-in fields and term vectors. Thanks to this, I can highlight the results using the class
Each test was performed within an hour, the first 5 minutes necessary for warming up were excluded from the accounting. The maximum amount of heap was 140 GB (
I tested various levels of load (requests / sec), starting from 50 (minimum) to 275 (very large), and then plotted graphs illustrating percentiles of response time for various configurations. Used by default, parallel Oracle GC behaved terribly slowly (Dozens of seconds to clear memory), so I did not even include it in the resulting report. The new G1 collector turned out to be even slower both at startup speed (it took 6 hours to load the index into
At the minimum load (50 requests / sec), Zing showed good performance, providing minimal response time, even for the worst cases, while the CMS showed a rather long response time for a fairly large number of cases, even when using

To estimate the saturation limit of each configuration, I built a graph illustrating the response time for 99% of cases, and for different load levels:
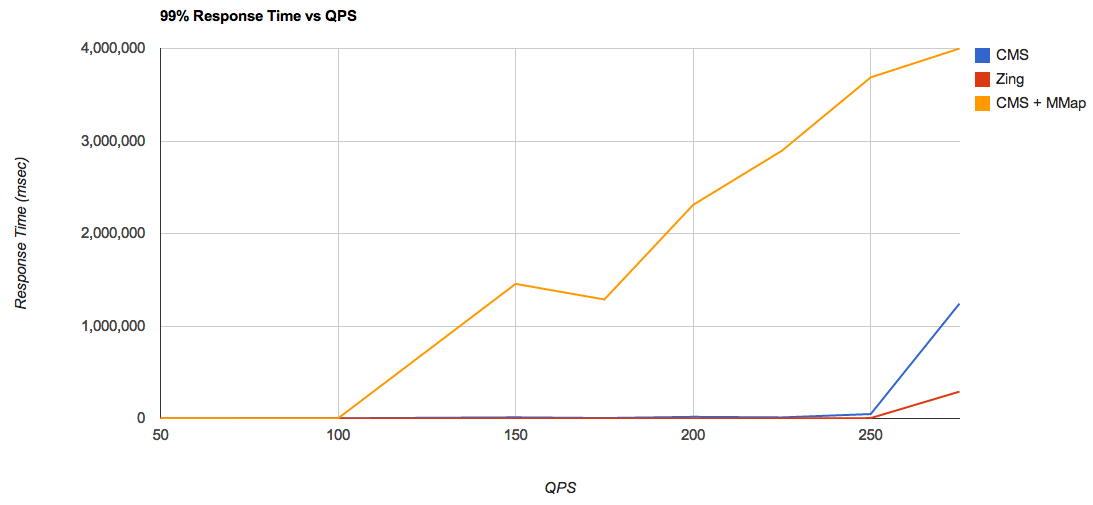
From this graph, we can conclude that for the
We construct the same graph, but without results for

For a percentile of 99%, Zing performance remains stable, while CMS starts to show a long response time, starting with a load of 100 requests / sec. Let's look at the indicators with a load of 225 requests / sec, which is closest to the saturation limit and when used in

time spent on pauses is already significantly longer than with a load of 50 requests / sec: Already starting with the percentile in 95%, response time becomes too long: 4479 ms or more.
These tests demonstrate that using the Zing garbage collector, a very short response time is achieved, even at extreme loads, when the application is allocated a heap of 140 GB, and the Lucene index has a capacity of 78 GB and is fully loaded into
Most notably, Azul recently announced the availability of JVM Zing for open-source developers, for use in development and testing.
Recently, RAM has become quite inexpensive, so for highly loaded resources, it is reasonable to expect a serious performance improvement by placing the entire search index in RAM.
The obvious question is whether we should try to load the entire index into the class provided by Lucene
RAMDirectory? Unfortunately, this class is known for creating a very serious load on the garbage collector (GC): each file is represented as a list of fragments of the type
byte[1024]. It also contains unnecessary synchronization mechanisms: if the application updates the index (i.e., it’s not only looking for it), the issue of how to save the changes RAMDirectorymade back to the disk is a separate problem . Start time also slows down significantly, due to the need to initially load the index into memory. Faced with this list of problems, Lucene developers often recommend using it RAMDirectoryonly for small indexes or for testing purposes, and in other cases rely on the memory management mechanisms of the operating system and access it using the class MMapDirectory. Despite these problems with the class
RAMDirectory, developers are working to improve it, and many users are already using it in their projects.I recently learned about Java the Zing virtual machine developed by Azul , which provides a pause-free garbage collector, even for very large volumes of heap. Those. in theory, the heavy memory load generated by the class
RAMDirectorywould not be a problem for Zing. Let's check it out! But first, let's make a little clarification about how important it is to test response times for all requests, rather than measure the average temperature in a hospital.Percentiles for search query response time
By default, the utilities in the luceneutil kit measure the average response time, while discarding extremely interesting extreme values. This is done because these utilities are designed to test the algorithms and the effectiveness of the changes made, specifically ignoring random deviations introduced by extraneous delays at the level of the operating system, disk subsystem, garbage collector, etc.
But for real search applications, what really matters is the total response time for all search queries. Search is essentially an interactive process: the user sits and waits for the search result to return to him, and only then clicks on the links. If even 1% of requests takes a lot of time, then this is already a serious problem! Users are impatient, and very quickly move to competitors.
Therefore, I modified lucenutil to allocate a load client ( sendTasks.py ) into a separate module , which saves response time for all requests; as well as scripts ( loadGraph.py and responseTimeGraph.py ) for plotting response time graphs. The directly running script was also improved.responseTimeTests.py for executing a series of tests, with increasing load (requests / sec), automatically stopping testing when the load begins to exceed server performance. As a nice addition, this approach allows you to measure the real server performance, rather than extrapolating it from the averaged indicators.
For the most correct simulation of the time of sending real requests, the client sends them in accordance with the Poisson distribution. The testing script works in one thread, and if we send requests at a speed of 200 requests per second, and the server froze for 5 seconds for some reason, then the request queue will grow to 1000. Unfortunately, a lot of load tests behave differently, and start a separate client stream for each emulated client.
The client works (via ssh) on a separate machine, which is an important point, because the Lucene server (and not just the JVM) periodically sags in performance (for example, swap occurs), which can slow down the work of the load client and, thus, distort the results . Ideally, the client runs on a dedicated machine and does not experience any pauses. Additionally, the Python garbage collector is disabled on the client to eliminate its negative impact.
Testing on Wikipedia
To test Zing, I indexed the full database of English Wikipedia as of 2.05.2012, having a volume of 28.78 GB of plain text representing 33.3 million documents, about 1KB in size, including built-in fields and term vectors. Thanks to this, I can highlight the results using the class
FastVectorHighlighter. As a result, an index of 78 GB was obtained. For each test, the server loads the full index into RAMDirectory, after which the client sends requests from the list of the 500 most severe ones (the most common terms in documents). At the same time, the server re-indexes the documents ( updateDocument) at a speed of about 100 documents per second (~ 100 Kb / s).Each test was performed within an hour, the first 5 minutes necessary for warming up were excluded from the accounting. The maximum amount of heap was 140 GB (
-Xmx 140G). To get a basic level of performance, I also tested MMapDirectory, with a maximum heap of 4 GB. The machine has 32 processor cores (64 with hyper-threading enabled) and 512 GB of RAM, the server is configured to operate in 40 threads.I tested various levels of load (requests / sec), starting from 50 (minimum) to 275 (very large), and then plotted graphs illustrating percentiles of response time for various configurations. Used by default, parallel Oracle GC behaved terribly slowly (Dozens of seconds to clear memory), so I did not even include it in the resulting report. The new G1 collector turned out to be even slower both at startup speed (it took 6 hours to load the index into
RAMDirectory, unlike 900 seconds, when using a competitive CMS collector), and during operation, requests experienced delays of more than 100 seconds, so I did not include its results in the report either (This turned out to be a surprise since G1 is positioned to work with large heap ) Thus, I tested three configurations: CMS, with its default settings and using the class MMapDirectoryas the base level, as well as CMS and Zing, using the class RAMDirectory. At the minimum load (50 requests / sec), Zing showed good performance, providing minimal response time, even for the worst cases, while the CMS showed a rather long response time for a fairly large number of cases, even when using
MMapDirectory:To estimate the saturation limit of each configuration, I built a graph illustrating the response time for 99% of cases, and for different load levels:
From this graph, we can conclude that for the
CMS + MMap link , peak performance falls at a level somewhere between 100 and 150 requests / sec, Whereas, when used RAMDirectory, this peak falls on a level somewhere between 225 and 250 requests / sec. This is an amazing performance boost! This result is all the more interesting because if you measure the average response time, then the difference in performance between RAMDirectoryand is MMapDirectoryfar from noticeable. We construct the same graph, but without results for
CMS + MMapDirectoryand also, we remove the results for a load of 275 requests / sec (since it clearly goes beyond the capabilities of our equipment): For a percentile of 99%, Zing performance remains stable, while CMS starts to show a long response time, starting with a load of 100 requests / sec. Let's look at the indicators with a load of 225 requests / sec, which is closest to the saturation limit and when used in
RAMDirectoryconjunction with CMS and Zing: The time spent on pauses is already significantly longer than with a load of 50 requests / sec: Already starting with the percentile in 95%, response time becomes too long: 4479 ms or more.
Zing works!
These tests demonstrate that using the Zing garbage collector, a very short response time is achieved, even at extreme loads, when the application is allocated a heap of 140 GB, and the Lucene index has a capacity of 78 GB and is fully loaded into
RAMDirectory. Moreover, application performance, measured in the number of queries per second, also increases significantly (approximately twice in the example considered), and also allows you to safely use it RAMDirectoryeven for large indexes if they are running Zing. Most notably, Azul recently announced the availability of JVM Zing for open-source developers, for use in development and testing.