Renewable Questions and Answers, Part 1
Renewable energy sources (RES) today are not only a “good business idea” and a source of unceasing hyip, propaganda and counter-propaganda. I will try to express my position on some recurring myths in the field of renewable energy sources.

Statement (U): “There is not enough land space to meet the needs of civilization with the help of renewable
energy sources” Answer (A): The Earth receives ~ 190 petawatts of thermal energy from the Sun (this is what reaches the surface), and civilization consumes 500 primary energy exajoules per year, i.e. The “power” of humanity is 0.015 petawatts, about one ten thousandth of the incoming energy. There is another elementary estimate based on the production of existing large solar power plants.- to provide the primary energy of civilization, there is enough space for large deserts. The main "but" in this reinforced concrete refutation of the myth is the uneven distribution of a convenient area for RES generation across countries. In general, “uneven distribution” is the main thing that people miss, generalizing the picture around RES in any way, and today this theme will sound like a refrain. For example, Japan is experiencing significant difficulties in finding a place for solar power plants, look at this photo sample of Japanese solar power plants and compare it with the American ones from the link a little higher.
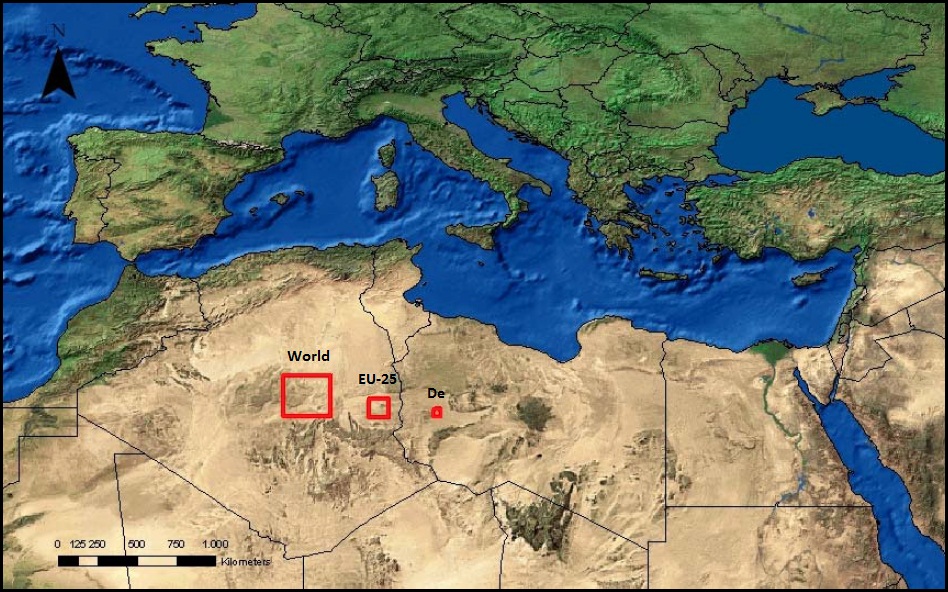
A vivid illustration of this thesis, although it relates only to electricity and does not take into account some losses, still gives an idea that, in theory, the Sahara desert is enough to provide humanity with energy.
Y: “The production of solar panels and wind turbines consumes more energy than they are able to produce during their life cycle (EROEI <1).”
O: This is complete nonsense, as more accurate measurements show. In 2016, once again this topic was raised in the work of Ferroni and Hopkirk 2016, where a slightly negative EROEI value was shown for a rooftop SES in Switzerland. However, the work is replete with errors, and the critically adjusted value is around 8. The value of EROEI from 5 to 15 is typical for various attempts to calculate EROEI silicon crystalline SB, the spread of values is explained both by the difference in the conditions in which the SES is located (between Norway and Saudi Arabia the difference in the production of the same panel is approximately 4 times), and the difference counting techniques. For other renewable energy sources, such as wind turbines, even higher values of EROEI are visible, from 15 to 50, i.e. here the criticism is completely past reality.
It should also be noted that the indicator EROEI itself, although it is used by scientists, is very imperfect. In its “expenditure part” there is an endless series of diminishing indicators that cannot be taken into account, but if you do it correctly (something like taking into account “the energy consumption for the construction of houses in which the workers lived, who built a factory for the production of machines for the production of silicon wafers for solar panels ”) we eventually arrive at low values of EROEI - and indeed, because all the energy received by civilization is consumed, the EROEI of humanity as a whole is about 3 (reverse efficiency of heat engines). This figure arises if one realizes that in the real world it is impossible to invest energy in the extraction of new energy without all of civilization. Eventually,

The installed capacity of the global wind power. The average global capacity factor of wind energy was 26%.

The installed capacity of photovoltaic batteries. It is useful to remember that photovoltaic power is indicated for “standard conditions” (light flux 1000 W / m ^ 2), and the actual power factor is from 6 to 33% depending on the region and the presence of solar panel drives.
Y: “The production of solar panels and batteries is very environmentally unfriendly, but since they are made mainly in China, they turn a blind eye to this.” A
: I have never seen at least some figures confirming this statement, it is understandable - there are dozens of pollutants, which it is desirable to express in the form of specific indicators (for example, in the form of "gram / kWh generated for the life of the panel"), also in different versions of the place of production of panels / batteries.
Of course, there are scientific publications that have done this extensive work, but first of all it is worth trying to evaluate some of the points yourself. By now, silicon polycrystalline panels have almost completely supplanted the technologies that had competed some time ago (silicon-single crystal, amorphous silicon, and thin-film CdTe and CIGS panels), although in 2018 they started talking about the return of silicon single-crystal. Polycrystalline silicon SATs use, on average, 2 grams of silicon per watt of installed capacity. In 2017, approximately 100 gigawatts were installedNew panels, which corresponds to the production of 200 thousand tons of purified silicon. Against the background of ~ 4 billion tons of cement, 1.5 billion tons of steel, 60 million tons of aluminum or 20 million tons of copper, none, even particularly dirty, semiconductor silicon production can lead its production to the leaders of anti-rating environmentalists simply due to a gap of thousands Scale with other base materials.
For lithium-ion batteries, which in 2017 produced about 100 GWh (funny coincidence), the characteristic value is 5 grams per watt * hour, i.e. about 500 thousand tons of materials were used.
There are more precision calculations., taking into account the emissions of metals or CO2 from all the total capacity involved in the production of solar panels. Given the fact that this work was done more than 10 years ago, it can be considered an estimate from above, as well as an amusing historical milestone on polycrystalline silicon competitors dying today.
An important caveat here, however there is. Modern science prefers to consider an almost unavoidable carbon footprint, i.e. in fact, energy costs for production, and not plums of toxic organic matter or chromium in rivers, considering that the latter is quite a removable effect if properly designed treatment facilities. Of course, China is famous for its non-ecological industries, and there this moment may not be respected. However, there are no fundamental obstacles to the fact that such low-tonnage production does not contribute to a negative environmental effect.
As a result, as it seems to me, the bike about the terrible non-ecological production of solar renewable energy sources and batteries is simply a mechanical transfer from the stereotype of non-ecological compatibility and harmfulness of chemical production in general. At the same time, the modern organization of such industries is able to ensure the absence of pollution emissions in principle.

The annual growth rate of various energy technologies in 2014-2017. The incredible rise of solar energy is gradually slowing down today, but the offshore wind energy is not accelerated.
W: "Renewable electricity has become cheaper than nuclear / coal / gas"
A: If previous myths were hotly debated mainly in previous years, then today (in 2017-2018) the most discussed is the cost of electricity. It is clear why - while the cost of renewable electricity was higher than its competitors, the driver of alternative energy development was mainly intangible factors - concern for the environment, progressiveness, things that cannot be measured, and besides, to some extent - the energy independence of countries introducing renewable energy. However, as the normalized cost of electricity (LCOE) comes from different sources, the situation is that the goal of subsidizing renewable energy sources has been achieved, and this technology will be further implemented on rational motives.
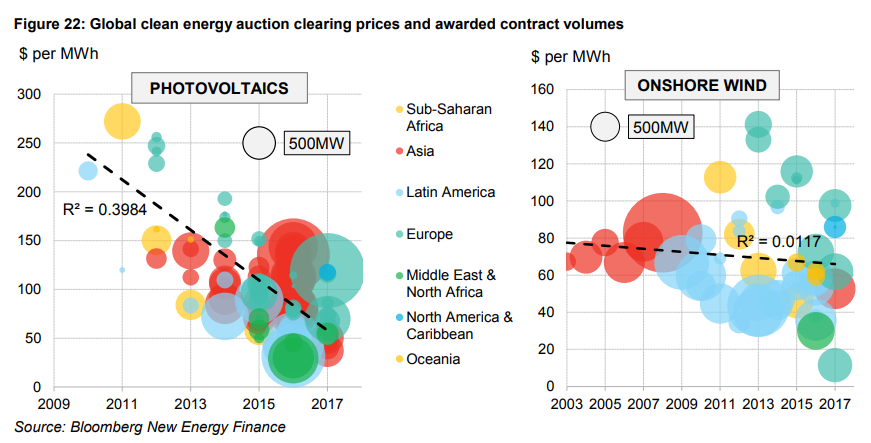
Graphic display of statistics on the unsubsidized price of electricity for a variety of renewable energy projects around the world in dynamics.
However, the reality here is complex and multifaceted. First of all, it should be remembered that the cost of renewable energy differs radically in different parts of the planet. This is easiest to illustrate with traditional renewable energy sources - hydroelectric power plants. You can, in principle, dig up an artificial river and block its hydroelectric station in a convenient place, or build high concrete walls along the river in order to move the hydropower station closer to consumers, but it is clear that the price of electricity with such solutions will be completely uncompetitive. It turns out that there are separate points where hydroelectric power plants are much more profitable than in other places.
Similarly, the "new" renewable energy sources exist in the world, say, the Arabian Peninsula, the Chilean deserts, the deserts of the southwestern United States - in which the standard panel provides significantly more (2-4 times) electricity per year than in Germany or Japan.
This means that if, in SES projects in these regions, LCOE has already dropped to $ 25 ... $ 50 per MW * h, this price cannot be automatically projected onto any region.
The costs for the construction of RES power plants are also unevenly distributed. This is defined as the difference in the cost of land, wages and the availability of industry construction of WPP or SES with extensive experience.
As a result, the cost of RES electricity for different projects in different parts of the globe is scattered 20 times for the sun and about 10 times for the wind.
As a result, the estimate of the cost of renewable electricity can be formulated as follows: in certain areas of LCOE, renewable electricity has become lower than traditional solutions and every year, as technology becomes cheaper, these territories become more and more.
However, the topic of the cost of renewable electricity and wider, competitiveness of renewable energy, can not be considered without two more questions: subsidizing of renewable energy and their variability as a source of electricity.
U: “RES power plants are completely subsidized, and in purely market conditions are not competitive”
A: As we have already discussed above, the competitiveness of renewable energy sources is almost entirely determined by the location of a particular station. Therefore, if, for example, to mechanically divide the volume of subsidies into output in kilowatts * hours - then this will give, at best, a reason for reflection, and not an accurate tool for assessing the “clean” competitiveness of renewable energy.
Nevertheless, it will be useful for understanding the extent of the distortion of electricity markets. To do this, it is worth separating grants for development and research from direct support of electric power generators. The first type of subsidies are not as large-scale and more or less uniform for different energy technologies.
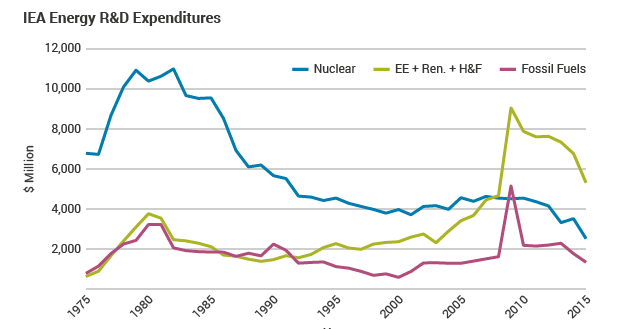
Statistics of subsidies for the development of energy technologies in the OECD countries - it is clear that 30-40 years ago, the atom was the absolute favorite.
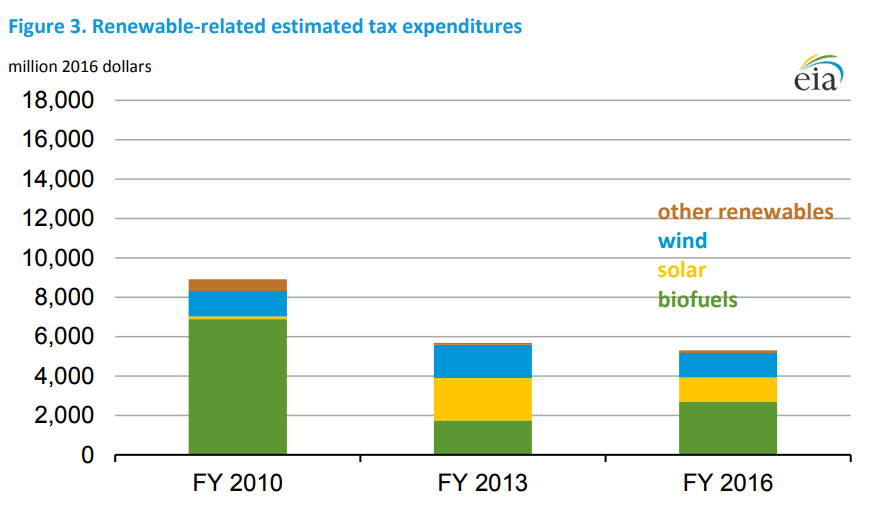
Direct support is also different in form: budget money for the purchase of renewable energy sources in China and the UK, tax deductions in the USA, a special component of the price of electricity distributed among RES generators in Germany, but all of it can be reduced to an easily comparable numerical indicator - cents subsidy per kilowatt * hour of RES production.
In 2015, for example, support for the four largest “RES-countries” looked like this: In China, $ 4,637.9 million was allocated (1,184 to the wind and 3,453.9 to the sun) to produce 187.7 TWh of electricity, on average 2.4 cents per kWh, in the UK - 4,285 million dollars at 40.1 TWh, an average of 10.7 cents per kWh, in the United States a little more than 2 billion dollars in tax credits were issued (exclusively for the Sun ) in the production of 115.7 TW * h (mainly by the wind), that is, 1.6 cents per kW * h, in Germany, 8821 million dollars were redistributed to 96.3 TW * h, i.e. 10.91 cents per kWh
It should be noted that the richest country from widely developing renewable energy sources - the USA, spends very little money on direct subsidizing of renewable energy sources, although there are other mechanisms - for example, in California there are legislatively established shares of "green" energy that must be purchased by networks from generators.
These figures have (unfortunately) a circumstance that still complicates understanding. For example, in Germany, support projects are dominated by old projects that have subsidies 5-10 times higher than the arithmetic average and received this right 10 or more years ago (FIT is assigned to the generation object for 20 years).
In addition, in 2016-2017, there was a significant reduction in the tariffs for subsidizing RES for significant countries, i.e. the figures from 2015 are already irrelevant today (support in China has decreased by 2 times, in Germany they went to auctions with the Strike price 2-3 times lower than the average FIT of 2015).
However, as in the previous question, the main thing is clear - the support varies greatly from one country to another. In Europe, price disproportions between renewables and hydrocarbon energy can reach 100% (one should also take into account the burden of coal generation with CO2 emissions taxes), but go down quickly, in China, India we are talking about 10..30% of support, in the US we can talk about market parity (although in the US it is no longer possible to drop development grants from the account - they are more direct support).
In fact, the situation with subsidies follows the expansion of areas of direct competitiveness of renewable energy sources as sources of electricity - the larger their size, the smaller the subsidy.
In the next part, we will examine the variability of renewable energy and its scale, energy storage, storage costs and various alternatives, demand management, trends and prospects for renewable energy in general. To be continued.
Statement (U): “There is not enough land space to meet the needs of civilization with the help of renewable
energy sources” Answer (A): The Earth receives ~ 190 petawatts of thermal energy from the Sun (this is what reaches the surface), and civilization consumes 500 primary energy exajoules per year, i.e. The “power” of humanity is 0.015 petawatts, about one ten thousandth of the incoming energy. There is another elementary estimate based on the production of existing large solar power plants.- to provide the primary energy of civilization, there is enough space for large deserts. The main "but" in this reinforced concrete refutation of the myth is the uneven distribution of a convenient area for RES generation across countries. In general, “uneven distribution” is the main thing that people miss, generalizing the picture around RES in any way, and today this theme will sound like a refrain. For example, Japan is experiencing significant difficulties in finding a place for solar power plants, look at this photo sample of Japanese solar power plants and compare it with the American ones from the link a little higher.
A vivid illustration of this thesis, although it relates only to electricity and does not take into account some losses, still gives an idea that, in theory, the Sahara desert is enough to provide humanity with energy.
Y: “The production of solar panels and wind turbines consumes more energy than they are able to produce during their life cycle (EROEI <1).”
O: This is complete nonsense, as more accurate measurements show. In 2016, once again this topic was raised in the work of Ferroni and Hopkirk 2016, where a slightly negative EROEI value was shown for a rooftop SES in Switzerland. However, the work is replete with errors, and the critically adjusted value is around 8. The value of EROEI from 5 to 15 is typical for various attempts to calculate EROEI silicon crystalline SB, the spread of values is explained both by the difference in the conditions in which the SES is located (between Norway and Saudi Arabia the difference in the production of the same panel is approximately 4 times), and the difference counting techniques. For other renewable energy sources, such as wind turbines, even higher values of EROEI are visible, from 15 to 50, i.e. here the criticism is completely past reality.
It should also be noted that the indicator EROEI itself, although it is used by scientists, is very imperfect. In its “expenditure part” there is an endless series of diminishing indicators that cannot be taken into account, but if you do it correctly (something like taking into account “the energy consumption for the construction of houses in which the workers lived, who built a factory for the production of machines for the production of silicon wafers for solar panels ”) we eventually arrive at low values of EROEI - and indeed, because all the energy received by civilization is consumed, the EROEI of humanity as a whole is about 3 (reverse efficiency of heat engines). This figure arises if one realizes that in the real world it is impossible to invest energy in the extraction of new energy without all of civilization. Eventually,
The installed capacity of the global wind power. The average global capacity factor of wind energy was 26%.
The installed capacity of photovoltaic batteries. It is useful to remember that photovoltaic power is indicated for “standard conditions” (light flux 1000 W / m ^ 2), and the actual power factor is from 6 to 33% depending on the region and the presence of solar panel drives.
Y: “The production of solar panels and batteries is very environmentally unfriendly, but since they are made mainly in China, they turn a blind eye to this.” A
: I have never seen at least some figures confirming this statement, it is understandable - there are dozens of pollutants, which it is desirable to express in the form of specific indicators (for example, in the form of "gram / kWh generated for the life of the panel"), also in different versions of the place of production of panels / batteries.
Of course, there are scientific publications that have done this extensive work, but first of all it is worth trying to evaluate some of the points yourself. By now, silicon polycrystalline panels have almost completely supplanted the technologies that had competed some time ago (silicon-single crystal, amorphous silicon, and thin-film CdTe and CIGS panels), although in 2018 they started talking about the return of silicon single-crystal. Polycrystalline silicon SATs use, on average, 2 grams of silicon per watt of installed capacity. In 2017, approximately 100 gigawatts were installedNew panels, which corresponds to the production of 200 thousand tons of purified silicon. Against the background of ~ 4 billion tons of cement, 1.5 billion tons of steel, 60 million tons of aluminum or 20 million tons of copper, none, even particularly dirty, semiconductor silicon production can lead its production to the leaders of anti-rating environmentalists simply due to a gap of thousands Scale with other base materials.
For lithium-ion batteries, which in 2017 produced about 100 GWh (funny coincidence), the characteristic value is 5 grams per watt * hour, i.e. about 500 thousand tons of materials were used.
There are more precision calculations., taking into account the emissions of metals or CO2 from all the total capacity involved in the production of solar panels. Given the fact that this work was done more than 10 years ago, it can be considered an estimate from above, as well as an amusing historical milestone on polycrystalline silicon competitors dying today.
An important caveat here, however there is. Modern science prefers to consider an almost unavoidable carbon footprint, i.e. in fact, energy costs for production, and not plums of toxic organic matter or chromium in rivers, considering that the latter is quite a removable effect if properly designed treatment facilities. Of course, China is famous for its non-ecological industries, and there this moment may not be respected. However, there are no fundamental obstacles to the fact that such low-tonnage production does not contribute to a negative environmental effect.
As a result, as it seems to me, the bike about the terrible non-ecological production of solar renewable energy sources and batteries is simply a mechanical transfer from the stereotype of non-ecological compatibility and harmfulness of chemical production in general. At the same time, the modern organization of such industries is able to ensure the absence of pollution emissions in principle.
The annual growth rate of various energy technologies in 2014-2017. The incredible rise of solar energy is gradually slowing down today, but the offshore wind energy is not accelerated.
W: "Renewable electricity has become cheaper than nuclear / coal / gas"
A: If previous myths were hotly debated mainly in previous years, then today (in 2017-2018) the most discussed is the cost of electricity. It is clear why - while the cost of renewable electricity was higher than its competitors, the driver of alternative energy development was mainly intangible factors - concern for the environment, progressiveness, things that cannot be measured, and besides, to some extent - the energy independence of countries introducing renewable energy. However, as the normalized cost of electricity (LCOE) comes from different sources, the situation is that the goal of subsidizing renewable energy sources has been achieved, and this technology will be further implemented on rational motives.
Graphic display of statistics on the unsubsidized price of electricity for a variety of renewable energy projects around the world in dynamics.
However, the reality here is complex and multifaceted. First of all, it should be remembered that the cost of renewable energy differs radically in different parts of the planet. This is easiest to illustrate with traditional renewable energy sources - hydroelectric power plants. You can, in principle, dig up an artificial river and block its hydroelectric station in a convenient place, or build high concrete walls along the river in order to move the hydropower station closer to consumers, but it is clear that the price of electricity with such solutions will be completely uncompetitive. It turns out that there are separate points where hydroelectric power plants are much more profitable than in other places.
Similarly, the "new" renewable energy sources exist in the world, say, the Arabian Peninsula, the Chilean deserts, the deserts of the southwestern United States - in which the standard panel provides significantly more (2-4 times) electricity per year than in Germany or Japan.
This means that if, in SES projects in these regions, LCOE has already dropped to $ 25 ... $ 50 per MW * h, this price cannot be automatically projected onto any region.
The costs for the construction of RES power plants are also unevenly distributed. This is defined as the difference in the cost of land, wages and the availability of industry construction of WPP or SES with extensive experience.
As a result, the cost of RES electricity for different projects in different parts of the globe is scattered 20 times for the sun and about 10 times for the wind.
As a result, the estimate of the cost of renewable electricity can be formulated as follows: in certain areas of LCOE, renewable electricity has become lower than traditional solutions and every year, as technology becomes cheaper, these territories become more and more.
However, the topic of the cost of renewable electricity and wider, competitiveness of renewable energy, can not be considered without two more questions: subsidizing of renewable energy and their variability as a source of electricity.
U: “RES power plants are completely subsidized, and in purely market conditions are not competitive”
A: As we have already discussed above, the competitiveness of renewable energy sources is almost entirely determined by the location of a particular station. Therefore, if, for example, to mechanically divide the volume of subsidies into output in kilowatts * hours - then this will give, at best, a reason for reflection, and not an accurate tool for assessing the “clean” competitiveness of renewable energy.
Nevertheless, it will be useful for understanding the extent of the distortion of electricity markets. To do this, it is worth separating grants for development and research from direct support of electric power generators. The first type of subsidies are not as large-scale and more or less uniform for different energy technologies.
Statistics of subsidies for the development of energy technologies in the OECD countries - it is clear that 30-40 years ago, the atom was the absolute favorite.
Direct support is also different in form: budget money for the purchase of renewable energy sources in China and the UK, tax deductions in the USA, a special component of the price of electricity distributed among RES generators in Germany, but all of it can be reduced to an easily comparable numerical indicator - cents subsidy per kilowatt * hour of RES production.
In 2015, for example, support for the four largest “RES-countries” looked like this: In China, $ 4,637.9 million was allocated (1,184 to the wind and 3,453.9 to the sun) to produce 187.7 TWh of electricity, on average 2.4 cents per kWh, in the UK - 4,285 million dollars at 40.1 TWh, an average of 10.7 cents per kWh, in the United States a little more than 2 billion dollars in tax credits were issued (exclusively for the Sun ) in the production of 115.7 TW * h (mainly by the wind), that is, 1.6 cents per kW * h, in Germany, 8821 million dollars were redistributed to 96.3 TW * h, i.e. 10.91 cents per kWh
It should be noted that the richest country from widely developing renewable energy sources - the USA, spends very little money on direct subsidizing of renewable energy sources, although there are other mechanisms - for example, in California there are legislatively established shares of "green" energy that must be purchased by networks from generators.
These figures have (unfortunately) a circumstance that still complicates understanding. For example, in Germany, support projects are dominated by old projects that have subsidies 5-10 times higher than the arithmetic average and received this right 10 or more years ago (FIT is assigned to the generation object for 20 years).
In addition, in 2016-2017, there was a significant reduction in the tariffs for subsidizing RES for significant countries, i.e. the figures from 2015 are already irrelevant today (support in China has decreased by 2 times, in Germany they went to auctions with the Strike price 2-3 times lower than the average FIT of 2015).
However, as in the previous question, the main thing is clear - the support varies greatly from one country to another. In Europe, price disproportions between renewables and hydrocarbon energy can reach 100% (one should also take into account the burden of coal generation with CO2 emissions taxes), but go down quickly, in China, India we are talking about 10..30% of support, in the US we can talk about market parity (although in the US it is no longer possible to drop development grants from the account - they are more direct support).
In fact, the situation with subsidies follows the expansion of areas of direct competitiveness of renewable energy sources as sources of electricity - the larger their size, the smaller the subsidy.
In the next part, we will examine the variability of renewable energy and its scale, energy storage, storage costs and various alternatives, demand management, trends and prospects for renewable energy in general. To be continued.