Zabbix 2.0 released
 Most recently, a new version of the Zabbix 2.0 monitoring system has been released. Compared with 1.8, many useful features have been added, design and performance have been significantly improved.
A few words about Zabbix
Zabbix is a free monitoring system for network infrastructure and various devices. It allows you to monitor the availability and performance of devices, visualize data, automatically send alerts and perform some actions in case of problems. In addition, Zabbix is able to monitor the operation of web applications, quickly assess the availability of services and organize distributed monitoring systems. Zabbix is fully configurable from a web interface that can be expanded using the API.
Zabbix is not only free, but also distributed under the GPL, which allows you to freely sharpen it to fit your needs.
Interesting? Then let's see what Zabbix 2.0 will please us with.
So what's new in 2.0?
Low-level discovery
Now Zabbix can not only automatically search for new hosts, but also new objects on the hosts themselves, such as disk partitions or network interfaces. For all found objects, Zabbix can create new data elements, triggers and graphs and automatically start monitoring them. If any of the objects becomes inaccessible, after some time Zabbix will delete it itself. This will help to save a lot of time when setting up monitoring of dynamic systems.

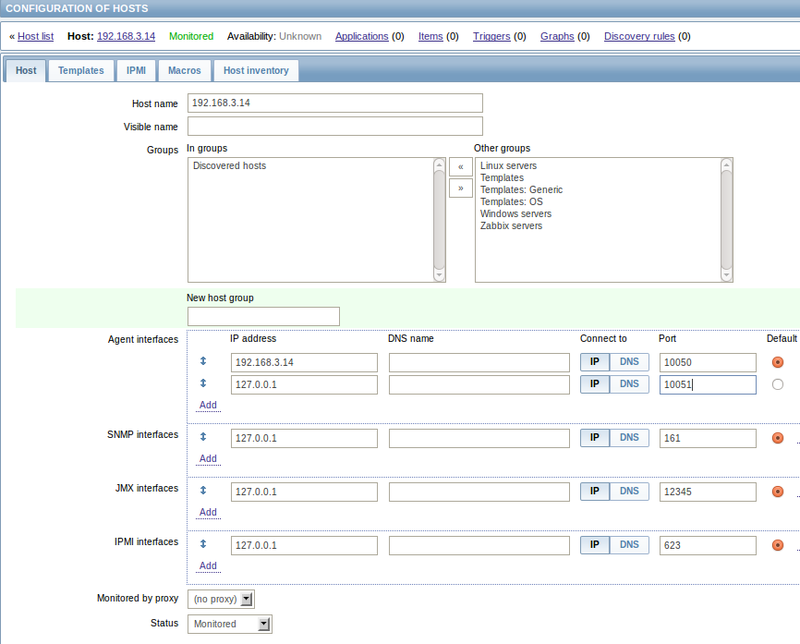
Support for multiple interfaces for hosts
For hosts, you can now add several interfaces of different types and mark which of them will be used for the corresponding data elements. If necessary, it will be possible to redefine the interfaces used for individual data elements.
Automated Inventory The
profile and advanced network profile were combined into inventory data, which can now be automatically populated based on information obtained from data elements. To do this, in the configuration form of the data elements, the field “Filling the inventory field of the host” was added in which you can specify in which field you want to save the information. Given that this data can now be used when creating maps, this is a pretty useful feature.
Native JMX support
Now you can monitor Java applications without having to install additional programs. It is enough to use a new type of data elements - the JMX agent, and Zabbix will do everything by itself.
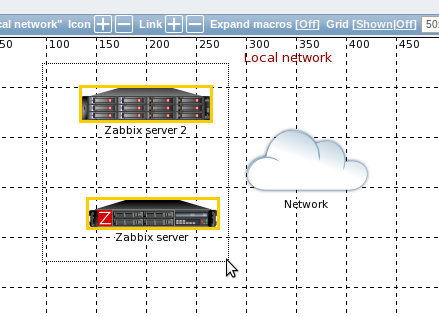
Improved map editor
The map editor has some nice new features. Multiple items can now be selected by mouse selection just like files. You can add multiple links for each item. Icons of elements can automatically change depending on the inventory data of the host (as I said, inventory data can now be really useful). Now on the map you can easily distinguish a simple working computer from a large server.
Advanced interface and design
In the end, Zabbix has become not only more functional, but also prettier. Forms have become cleaner and more beautiful, some sections, for example, “IT Services” have become simply more organized and understandable. The interface is overgrown with new fashionable controls, like drag'n'drop. Finally, a menu appeared for switching from the settings of host data elements immediately to triggers, or charts, without having to return to the list.
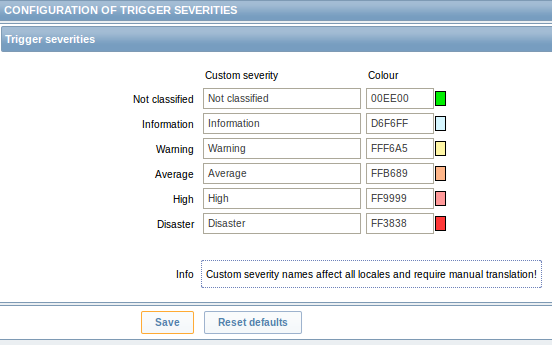
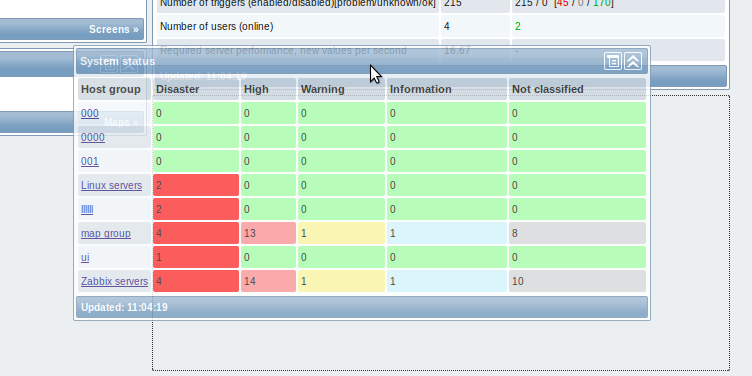
The location of widgets on the main page can now be changed as you like and you can change the colors of the importance of triggers to your taste.
Increased speed
The performance of the web interface and server has improved markedly, especially for systems with a large amount of data. Optimization of API methods positively affected both the speed of the API itself and the web interface. Using the cache for triggers and data elements, as well as improved algorithms for clearing the history and escalating events, significantly reduced the load on the database.
Of the smaller, but interesting innovations:
- New icons in maps;
- Support for a visible host name, which may differ from the "real" name;
- New macros
- Export events in CSV format;
- Ability to create dependencies between template triggers and hosts triggers.