PlantUML - all that business intelligence needs to create diagrams in software documentation
Introduction
I am a systems analyst, and my job is to design automated information systems. However, no, it is to write and write documents. For the third time I will not repeat the word “to write” - after all, not the “Iliad”. But the tediousness of the form with something definitely makes the project documentation related to an ancient Greek poem, especially when it comes to working with the state customer.
Charts - a breath of creativity in this sea of text. On the diagrams and will be discussed in this article. To be more precise - about PlantUML - from my point of view, the most adequate tool for creating them at the moment.
I'm sure many have heard of PlantUML, at least on GitHub it costs more than a thousand stars . The meaning of this tool is extremely simple, it only allows you to set diagrams (mostly in UML notation) in the form of text describing the elements and the connections between them. Graphic view is created automatically. The following is an example of an activity diagram.
start
:Вывалить мысли
в текст;
if (Бред?) then (Возможно)
    :Дать посмотреть коллеге;
    if (Сойдет?) then (Да)
    else (Нет)
        :Помедитировать над текстом;
    endif
    :Разместить на //Хабре//;
else (Точно)
    stop
endif
stop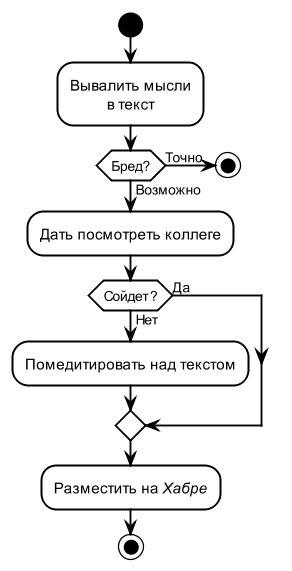
Despite popularity, on Habré there are very few articles telling about practical application of this tool. As it seems to me, PlantUML does not deserve such a lack of attention.
At the beginning I will tell you why I chose it as the main tool for visual modeling, and at the end I will give a number of recommendations that I myself would very much like to hear when I started using this tool.
Why PlantUML
From my point of view, when creating diagrams, it makes sense to focus on the following criteria: (1) the diagram should be less or less small, (2) the diagram should use more or less standard notation and (3) the diagram should be more or less convenient from the point of view of managing the project documentation .
In all three cases, the word "less" was used, because all these criteria in specific situations can be violated without prejudice to the case. There are many large diagrams created in self-made notation and perfected (the same metro map ). Another question is that the creation of such diagrams - projects that have spent significant resources. Not always (read, never) such resources are allocated for the creation of automated information systems. The customer needs a perfect system, not a perfect system diagram.
Nevertheless, for me, these criteria are the starting point from which you begin to invent a diagram. Next ... how it goes.
For a very long time, I considered the use of Microsoft Visio as the golden section for myself and drew diagrams there, trying to be reasonably close to UML. It used a standard set of components, because it gives more freedom than a specialized stencil for UML. Also, some charts for display on the projector were drawn in Microsoft PowerPoint.
Yes, you cannot manage such charts. If the name of an entity has changed, open each diagram and change it. But it turns out almost beautiful. And there is a certain flexibility in the formulation of thought.
I also tried specialized business modeling tools: Rational Rose, Aris, Enterpise Architect (Sparx Systems) - Rational Rose to the greatest extent. The problem is that the end result of my work is documents. And in this sense, if something serious changes in the requirements, you still need to manually go through the entire project and re-insert the diagrams in the right places of the text. It seemed to me that it was too difficult and not worth the effort to invent something in this part.
With the advent of PlantUML, the situation has changed completely.
Once diagrams are created as text, it means that in any text editor (I like Atom and Notepad ++) you can find the required text in the file set and even replace it. Refactoring the project is quite convenient. Also, the text format allows you to easily organize group work and track changes in the version control system.
In PlantUML, creating charts is faster than in any visual editors (at least for me). There are other opinions on this point , for example, it says here that creating a diagram in PlantUML takes longer than, say, Enterpise Architect (Sparx Systems). I think this is more a matter of taste and habit.
I even had a very successful experience when PlantUML was used instead of the board (it was not next to it), and with people very far from information technology.
PlantUML is quite flexible with the UML notation. Supporting all its main elements, it provides the user with many opportunities for their free use in a diagram. For example, it is very convenient to support the use of wiki markup in the contents of elements.
Moreover, the developers of PlantUML, apparently, see nothing wrong with breaking the notation. And this is a great advantage of this tool. Ultimately, the client does not need to know if UML is or not UML — he must understand the meaning of the diagram. Anything that leads to an improvement in the perception of meaning is good.
Nevertheless, PlantUML is UML, i.e. common notation, standard, and therefore for documentation, especially in government projects, is very suitable.
PlantUML does not allow for the creation of large diagrams. He distributes the elements independently and, naturally, with a large number of elements, the result begins to be doubtful. But this is not really a limitation. Usually, when PlantUML begins to produce an inadequate result, you realize that PlantUML is not bad, but the diagram is bad, and it is better to divide it or reduce the number of non-essential details.
PlantUML diagrams can be generated automatically. An example of such use is given here .
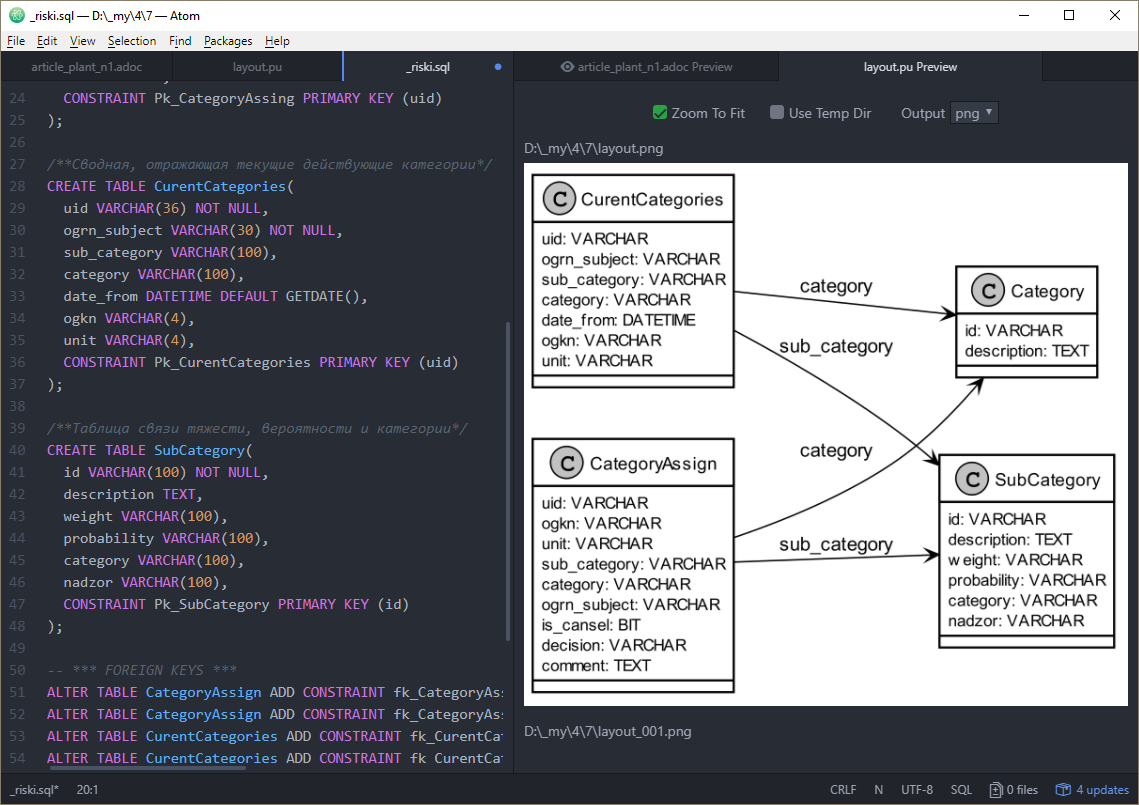
We use PlantUML to automatically generate a database schema. This generation function is built into the database structure management tool we use - 2bass . Thus, when assembling the documentation, the class diagram with the database structure is always up to date. The following figure shows a piece of the description of the database structure and an automatically generated chart.
PlantUML Tips
It seems to me that many do not use PlantUML, since they face certain difficulties at the initial stage, which they consider to be fundamentally insurmountable. Many are frightened by the use of text, because everyone is accustomed to graphic editors. This part of the article provides recommendations that I hope will allow you to quickly start using PlantUML in combat missions.
Where to create diagrams?
To begin, I would like to mention the PlantUML Web Server - part of the PlantUML project, where diagrams can be created online and shared with colleagues. This is a very convenient feature, but, of course, not when creating diagrams for project documentation.
Often PlantUML is used in wiki engines. Here, editing takes place in the standard way: the text is written, saved, and we get a picture on the page. But still, in most cases it is convenient for the result to be immediately displayed on the diagram: for example, the specification of the diagram is written in the left window, and its appearance is displayed in the right window. The finished text can already be inserted into the wiki.
The PlantUML site has many editors. I suspect that more than half of them are not suitable for work. What I like most is creating PlantUML diagrams using the PlantUML Preview plug- in in the Atom editor. In fact, there are several such plug-ins. I liked the PlantUML Preview because it not only shows the result, but immediately (or at the time of saving, depending on the settings) creates a graphic file whose name corresponds to the file with the specification of the diagram.
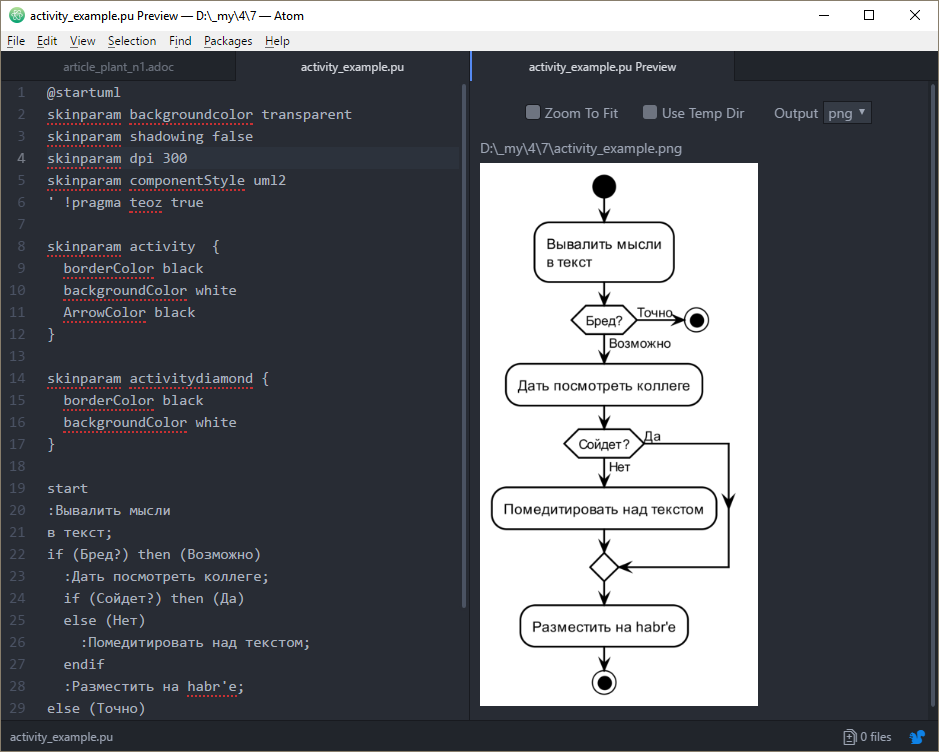
Those. each diagram always corresponds to two files, one text (with the text description of the diagram), and the other graphic (picture with diagram).
Since we have been doing all the documentation for a long time with the help of Asciidoctor (it's amazing how much Microsoft Word rejection can facilitate the work, but this is a topic for a separate article), then we insert pictures through links. To change a picture with such a technology, it is enough to open a text description, change it and save it. You do not need to do export or copy operations via the clipboard.
Please note that the PlantUML Preview plug-in in its settings requires specifying the location of the file planuml.jar, and PlantUML itself will not work, if GraphViz is not installed , both applications can be downloaded from the corresponding sites. In the latest versions of PlantUML there is a consistent rejection of the use of Graphviz, therefore, in the near future, this product will become more autonomous. This will simplify its use in systems for automatic assembly of software documentation.
Preparing Charts for Printing
For high-quality printing on a laser printer, you must specify the parameter skinparam dpi 300 . 300 dpi resolution provides high-quality image for printing on a laser printer. Otherwise, the pictures are created with the screen resolution and look rasterized. PlantUML also has the ability to use svg (vector format). But this format is supported much less than png, and there are much more problems with it. I used svg if it was necessary to bring the image to the mind with a vector editor (for example, using Inkscape ). But this, of course, is an extremely rare way to use PlantUML.
To remove the shadows, which usually also spoil the print view, the skinparam shadowing false parameter is used .
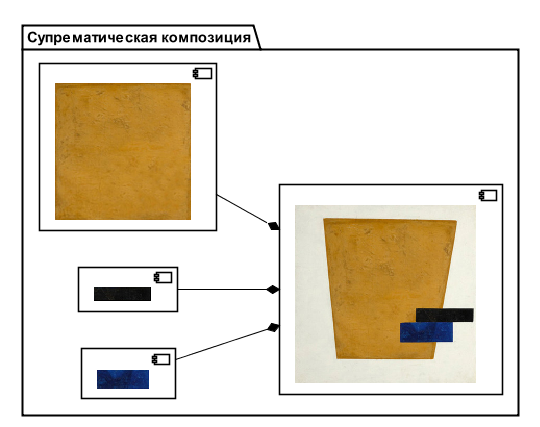
In addition, for printing charts on a black and white printer, it is desirable that it does not have halftones. A brown and yellow color scheme is usually not suitable for printing. Fortunately, PlantUML allows you to specify the colors used. The following parameters, for example, provide a display of component diagrams in a black and white palette. There is a special parameter for monochrome chart generation ( skinparam monochrome true ), but it only removes the color, halftones remain.
skinparam component {
  borderColor black
  backgroundColor white
  ArrowColor black
}
A list of most of the parameters is here . If you want to explore all the parameters, you can use the java -jar plantuml.jar -language command .
Relative position of elements
The parameter left to right direction causes the diagram elements to be drawn from left to right. Not very obvious, but, for example, for the component diagram, this means that the components will be assembled on the left, and the interfaces on the right.
component "Компонент 1" as c1
component "Компонент 2" as c2
interface "Интерфейс 1" as i1
c1 --() i1
c2 --( i1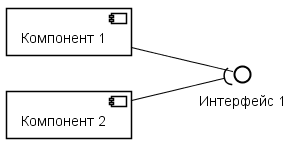
Grouping using higher level items.
In the following figure, PlantUML distributes the components so that there are fewer line intersections. This order of components may be undesirable if we want the components to be displayed in order.
component "Компонент 1" as c1
component "Компонент 2" as c2
component "Компонент 3" as c3
interface "Интерфейс 1" as i1
c1 --() i1
c2 --( i1
interface "Интерфейс 2" as i2
c1 --() i2
c3 --( i2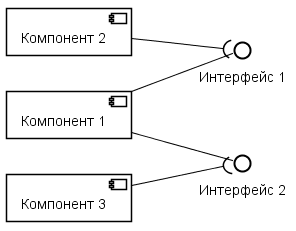
If we group the second and third components, then we will just ensure that the components are arranged in order.
component "Компонент 1" as c1
component "Модуль 1" {
component "Компонент 2" as c2
component "Компонент 3" as c3
}
interface "Интерфейс 1" as i1
c1 --() i1
c2 --( i1
interface "Интерфейс 2" as i2
c1 --() i2
c3 --( i2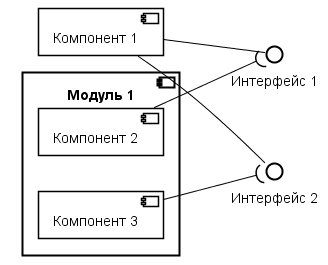
The order of the components. Quite a controversial approach, but it works. In the following example, the figure first shows Component 2, since in the specification it is listed first.
component "Компонент 2" as c2
component "Компонент 1" as c1
interface "Интерфейс 1" as i1
c1 --() i1
c2 --( i1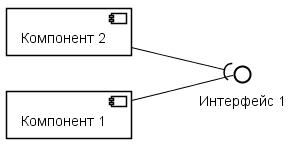
PlantUML has the ability to specify the direction of the arrow. For example, to indicate that the arrow goes from component 1 (c1) to interface 1 (i1) from left to right, you need to specify the letter “r” in the arrow specification: c1 -r- () i1 . The following example explicitly states that the arrow from component 1 to interface 1 goes from left to right, and from component two to the same interface from right to left.
component "Компонент 1"as c1
component "Компонент 2"as c2
interface "Интерфейс 1"as i1
c1 -r-() i1
c2 -l-( i1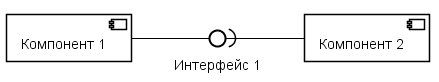
I think this is a harmful opportunity. It confuses the specification of the chart and the feature of interpreting the direction of PlantUML can be very exotic. In addition, when specifying the left to right direction parameter, the letter “r” starts to mean from top to bottom (due to a clockwise shift), which completely confuses the circuit.
Inscriptions in chart elements
Multiline text and wiki markup
PlantUML contains good tools for formatting text in elements.
When generating an element, a PlantUML diagram is based on the size of the text. Those. not the text flows depending on the size of the element, but the size of the element adjusts to the text.
The easiest way to create large text is to use the "\ n" symbol. In this case, you can also use text formatting symbols (bold, italics, etc.)
component "**Компонент 1** \n Не входит ни в один пакет \n //**Экспонирует**// \n* //Интерфейс// 1 \n* //Интерфейс 2//" as c1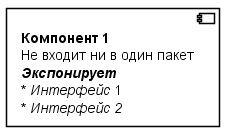
Sometimes there are no other options. But in most cases syntax is supported, which allows you to specify multi-line text. For example, in the previous example, you can use this syntax.
component c1 [
    **Компонент 1**
    ====
    Не входит ни в один пакет
    ..//**Экспонирует**//..
    * //Интерфейс// 1
    * //Интерфейс 2//
]
note left
    Тот же текст в примечании
    ....
    **Компонент 1**
    ====
    Не входит ни в один пакет
    ..//**Экспонирует**//..
    * //Интерфейс// 1
    * //Интерфейс 2//
end note
As we see, when using this syntax, it becomes possible to add dividing lines. Notice that a note has been added here that displays the same text as the component. In this case, in the note, the list is displayed as a list, and in the component, as text through the "*" symbol. Unfortunately, lists and tables do not work in components. Although they, for example, work in the elements that display the activity (in the activity diagram).
Using icons
PlantUML supports several ways to use icons. All of them have certain limitations.
The most popular, I think, was the technology of using so-called sprites. A sprite is a bitmap drawing that is specified using text. The biggest advantage of this technology is that PlantUML allows you to create external sprite libraries. There are several such libraries. I like the PlantUML Icon-Font Sprites library the most . it contains graphic images from Font Awesome .
Notice that the sprites in PlantUML are bitmap images, i.e. they have scaling restrictions. In this particular library, the resolution of the icons is 48 by 48 pixels. When using such an image for printing, it is undesirable to scale it to the size of more than 5 millimeters (which roughly corresponds to a resolution of 250 dpi). On many online resources describing the use of sprites, this is not taken into account and the examples provide elements of diagrams with large icons. On the screen, such charts look great, but when printed look rasterized.
The size of the icon in 4-5 millimeters is convenient to use inside signatures. For example, in the following figure, using icons, user roles are shown whose members translate the process from one state to another.
' Импорт иконок и создание удобных алиасов
!define ICONURL https://raw.githubusercontent.com/tupadr3/plantuml-icon-font-sprites/v2.0.0
!includeurl ICONURL/common.puml
!includeurl ICONURL/font-awesome-5/user_cog.puml
!includeurl ICONURL/font-awesome-5/user_check.puml
!define _CS scale=0.4
!define _user_cog <$user_cog{_CS}>
!define _user_check <$user_check{_CS}>
'Легенда
legend
  ..**Условные обозначения**..
  _user_cog — Сотрудник
  _user_check — Контролёр
endlegend
'Спецификация диаграммы состояний
state "Документ формируется"as prepare_doc
[*] --> prepare_doc
state "Документ на проверке"as check_doc
prepare_doc --> check_doc : _user_cog \n Передать \nна проверку
check_doc --> prepare_doc : _user_check \n Отправить \nна доработку
state "Документ проверен"as ready_doc
check_doc --> ready_doc: _user_check \n Установить отметку \n<U+00AB>Проверено<U+00BB>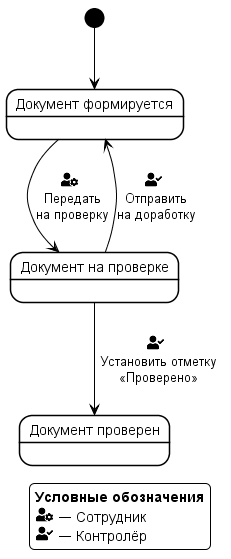
Some icons are embedded directly in PlantUML, but I prefer using external libraries. In particular, the icons from this example are contained in the Awesome v5 library, and in PlantUML at the time of writing the current article (version 1.2018.08) only the Awesome v4 library is embedded.
Using quotes
This seemingly simple question turned out to be almost blocking for me in the use of PlantUML. The absence of quotes looks unprofessional and funny.
PlantUML supports many ways to use quotes. But as a result of searches, I found only one, which always works, good old scrap: for opening Russian quotes - <U + 00AB>, for closing quotes - <U + 00BB>, for universal ones - <U + 0022>.
How not to get lost in the diagram
In the activity diagram, the syntax is so convenient that it is difficult to get lost in it, because it looks more like a description of the algorithm than a description of the diagram. But in other diagrams: states, components, deployment, use cases, classes, and others, it is quite easy to get confused.
Two simple rules help me not to get confused.
Enter all elements through keywords (do not use the simplified syntax). If an element allows, set an alias for it.
Specify the link immediately behind the element (of course, if the related element is already present in the diagram). The fact is that the element is always easy to find in the text. And communication can be found only by alias. If you use this rule, the connection can also be quickly found in the text.
Conclusion
PlantUML is not a toy. This is a high-quality, universal tool with which you can solve almost all the tasks associated with the description of business processes and architectural features of the designed systems.
PlantUML has a psychological barrier to entry: we are too used to visual editors and using text seems like a step backwards. But if thanks to this step back it turns out to increase the efficiency of its work, why not do it?
PlantUML has implementation holes: some functions work only for a part of the diagrams or graphics primitives. However, in practice, such restrictions can always be circumvented. PlantUML is a mature and stably working product that you can rely on in your work, without fear that it will ruin the diagram or cripple the font or throw out some other problem that will lead to a sleepless night before handing over the next project stage.