September 23, 2011 at 18:13
Pinba - real-time php monitoring
As stated on the official website -
And indeed it is. It will allow you to receive real-time statistics on a running application, while not slowing down the application itself.
What to do with statistics is up to you, for example, we output it to the zabbix and use it both for stability monitoring (no errors, few long requests), and for analytics.
It is surprising that about this really wonderful invention there has not been a single article on Habr.
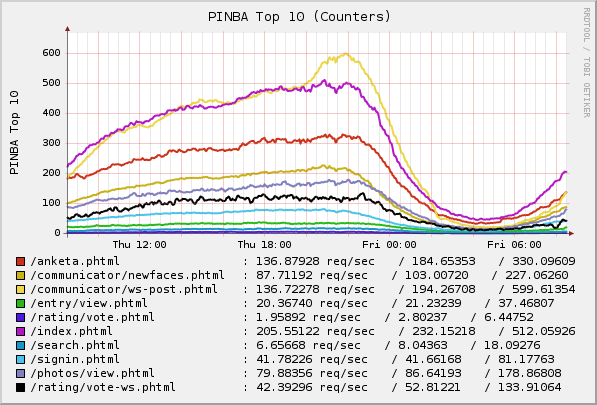
I wanted to do something good for this opensource project, and what could be better than a mention on the Habré;)
The pinba itself consists of two parts - this is php extention and engine (engine for mysql).
Both are supplied in the source code. The installation itself is quite trivial and well described in the reference manual .
Client (module)
On each server where php is running, you need to install the module and add the following lines to php.ini: After that, each php script, including cli, will send a report on udp to the specified address and port before shutting down. This completes the installation, the client is configured. Server (mysql engine). When I first read the documentation, I could not understand why pinba needed mysql. It turned out that everything is simple - mysql is the interface / entry point to the analytics system. This is very convenient, because there are already a bunch of solutions for this DBMS and everyone knows how to work with it. The pinba server is configured as a mysql engine. There are not many settings and their names are obvious:
See the documentation for more details .
After you install the server and enable the module on clients, the pinbu (mysql) will receive data about all the scripts that were executed with this module.
Data about all unique requests will appear in the request label. Groupings are also available to you:
report_by_hostname, report_by_hostname_and_script, report_by_hostname_and_server, report_by_hostname_server_and_script, report_by_script_name, report_by_server_and_script, report_by_server_name.
In general, this is mysql, so: I summarize - without setting up practically anything, we got the analytics system for all php in production. For example, we know the total number of hits (rps):
The same, but for each host (server selling):
And a large set of various reports. All reports will be updated quickly and contain the latest data.
This is not an analysis of apache logs, it is profiling and monitoring directly on production!
Now about the most delicious.
You can measure the duration of an event in scripts and tag it. This data will also be available for reporting.
For example, if you have a long selection of users from the database, then you can do this: I added timers directly to the framework that we use, and now, to one degree or another, I measure all requests to the databases, memcached, etc. Separately, I note that this data is easily accessible in the server interface. They can be selected either from raw data - see tables report, timer, timertag, or create tables in which data will already be in an aggregated state. Example (from the wiki ): NOTE : Comment on the table is important.
After creation, data on the group tag and server (server) will be automatically aggregated into this table (!).
We use it in production. She works ;)
I do not intend to make some kind of complete description of pinba, especially since I do not want to copy the manual.
If you use php in production, try pinba. She is really good!
References:
* wiki
* google
upd group : Meet the author of the current implementation - tony2001 !
Pinba is a realtime monitoring / statistics server for PHP using MySQL as a read-only interface.
And indeed it is. It will allow you to receive real-time statistics on a running application, while not slowing down the application itself.
What to do with statistics is up to you, for example, we output it to the zabbix and use it both for stability monitoring (no errors, few long requests), and for analytics.
It is surprising that about this really wonderful invention there has not been a single article on Habr.
I wanted to do something good for this opensource project, and what could be better than a mention on the Habré;)
Installation
The pinba itself consists of two parts - this is php extention and engine (engine for mysql).
Both are supplied in the source code. The installation itself is quite trivial and well described in the reference manual .
Principle of work and configuration
Client (module)
On each server where php is running, you need to install the module and add the following lines to php.ini: After that, each php script, including cli, will send a report on udp to the specified address and port before shutting down. This completes the installation, the client is configured. Server (mysql engine). When I first read the documentation, I could not understand why pinba needed mysql. It turned out that everything is simple - mysql is the interface / entry point to the analytics system. This is very convenient, because there are already a bunch of solutions for this DBMS and everyone knows how to work with it. The pinba server is configured as a mysql engine. There are not many settings and their names are obvious:
; configuration for php pinba module

extension=pinba.so

pinba.enabled=1

pinba.server=192.168.1.42:3300 ; адрес и порт сервера пинбы
[mysqld] pinba_port = 3300 # port pinba_address = 192.168.1.205 pinba_stats_gathering_period = 10000 # (microseconds) pinba_stats_history = 900 # (seconds) pinba_temp_pool_size = 10000 pinba_request_pool_size = 1000000 #* = pinba_tag_report_timeout = -1 #Default value is -1, i.e. keep the data updated forever.
See the documentation for more details .
After you install the server and enable the module on clients, the pinbu (mysql) will receive data about all the scripts that were executed with this module.
Data about all unique requests will appear in the request label. Groupings are also available to you:
report_by_hostname, report_by_hostname_and_script, report_by_hostname_and_server, report_by_hostname_server_and_script, report_by_script_name, report_by_server_and_script, report_by_server_name.
In general, this is mysql, so: I summarize - without setting up practically anything, we got the analytics system for all php in production. For example, we know the total number of hits (rps):
show tables;
mysql> select req_per_sec from report_by_server_name where server_name = 'ro.plus1.wapstart.ru';
+ ------------- +
| req_per_sec |
+ ------------- +
| 547.161 |
+ ------------- +
1 row in set (0.00 sec)
The same, but for each host (server selling):
mysql> select hostname, req_per_sec from report_by_hostname_and_server where server_name = 'ro.plus1.wapstart.ru';
+ ---------- + ------------- +
| hostname | req_per_sec |
+ ---------- + ------------- +
| a .... | 81.7561 |
| b .. | 59.0298 |
| c ... | 90.8049 |
| f .... | 54.5014 |
| f .... | 54.5122 |
| h ...... | 63.5664 |
| k ... | 54.5068 |
| s .... | 90.8211 |
+ ---------- + ------------- +
8 rows in set (0.00 sec)
And a large set of various reports. All reports will be updated quickly and contain the latest data.
This is not an analysis of apache logs, it is profiling and monitoring directly on production!
Timers and tags
Now about the most delicious.
You can measure the duration of an event in scripts and tag it. This data will also be available for reporting.
For example, if you have a long selection of users from the database, then you can do this: I added timers directly to the framework that we use, and now, to one degree or another, I measure all requests to the databases, memcached, etc. Separately, I note that this data is easily accessible in the server interface. They can be selected either from raw data - see tables report, timer, timertag, or create tables in which data will already be in an aggregated state. Example (from the wiki ): NOTE : Comment on the table is important.
$t = pinba_timer_start(array("group"=>"mysql", "server"=>"dbs2", "operation"=>"select"));

//работа с базой

pinba_timer_stop($t);
CREATE TABLE `tag_info_group_server` (

 `group_value` varchar(32) DEFAULT NULL,

 `server_value` varchar(32) DEFAULT NULL,

 `req_count` int(11) DEFAULT NULL,

 `req_per_sec` float DEFAULT NULL,

 `hit_count` int(11) DEFAULT NULL,

 `hit_per_sec` float DEFAULT NULL,

 `timer_value` float DEFAULT NULL

) ENGINE=PINBA DEFAULT CHARSET=latin1 COMMENT='tag2_info:group,server'
After creation, data on the group tag and server (server) will be automatically aggregated into this table (!).
Stability
We use it in production. She works ;)
I do not intend to make some kind of complete description of pinba, especially since I do not want to copy the manual.
If you use php in production, try pinba. She is really good!
References:
* wiki
upd group : Meet the author of the current implementation - tony2001 !