Debugger Canvas - a new way to debug code in Visual Studio
Debugger Canvas is an interesting way to debug applications (and not only). This plug-in for Visual Studio Ultimate gives a little, so far for me, an unusual way of step-by-step debugging in Visual Studio. After installing this extension in Visual Studio, you do not need to configure anything, and you can see its operation immediately after starting the application under the debugger and setting a breakpoint. Debugger Canvas will automatically open a separate tab in Visual Studio with its functionality. The idea of this extension is that it opens each debugged method in a separate area, allowing you to trace the call chain of methods (call stack) on one screen and, moreover, be able to view the values of local variables in previous methods in the chain if you passed them under the debugger. Under the cat in more detail about the functions and screenshots.
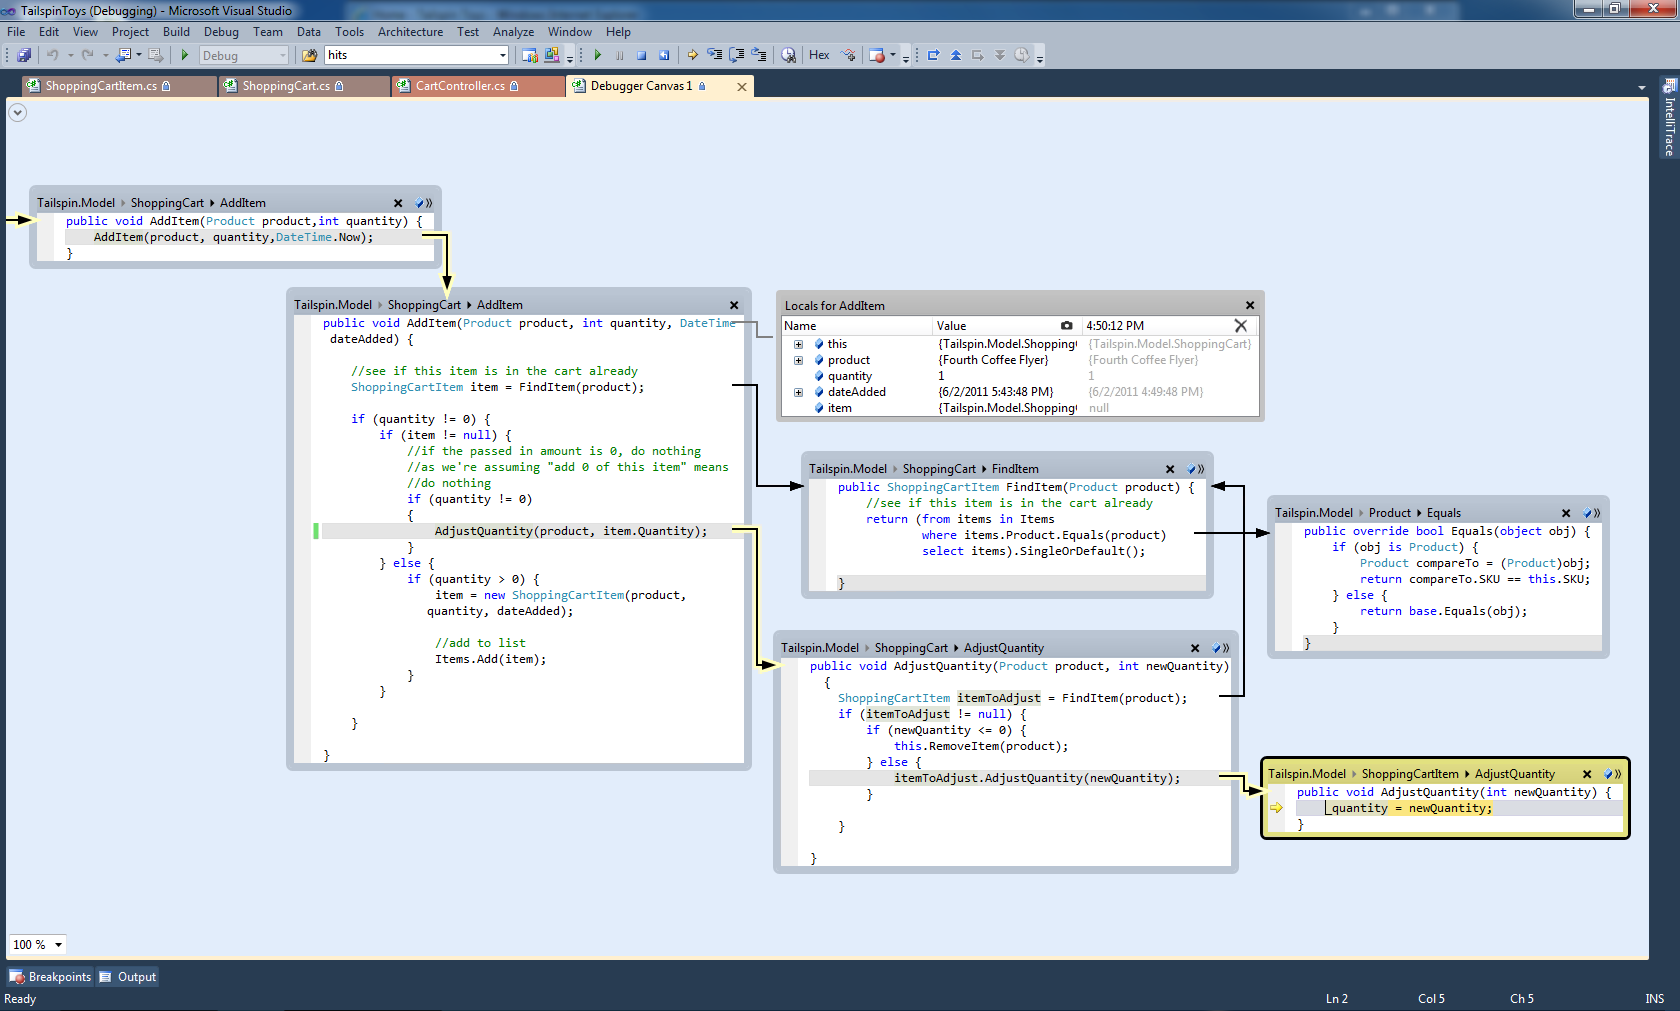
It will be more understandable by looking at a screenshot of the work of this extension for Visual Studio (the screenshot is taken from a blog on MSDN [1]): The idea of such debugging was developed in MS Research in collaboration with Brown University . This plugin for Visual Studio works so far well, but you need to consider that this is only the Alpha version, you should not expect stability from it. Currently working out of the box:


Moreover, Debugger Canvas is not going to limit this functionality to us, in the future two functions will be available: the ability to edit directly in these windows, as well as the ability to climb using the IntelliTrace data in Debugger Canvas. Editing in windows can be enabled now, but at your own risk, since this functionality can drop Visual Studio, you can enable it in the Debugger Canvas settings:

Undoubtedly, many Visual Studio users are upset because Debugger Canvas is available only in Ultimate edition. The thing is that the current version is implemented over Visual Studio Ultimate, or rather it uses Dependency Diagrams [1]. Still, there should be some buns in the Ultimate version.
UPDATE: If there are problems with this plugin or just have suggestions, then you can share this on the Debugger Canvas forums .
It will be more understandable by looking at a screenshot of the work of this extension for Visual Studio (the screenshot is taken from a blog on MSDN [1]): The idea of such debugging was developed in MS Research in collaboration with Brown University . This plugin for Visual Studio works so far well, but you need to consider that this is only the Alpha version, you should not expect stability from it. Currently working out of the box:
- Ability to export the current window to an XPS file. I will not say that it works perfectly. Let's just say it exports, but there are wishes. Functionality is available by right-clicking in the Debugger Canvas window.
- Ability to create Sticky Notes. To right-click in the Debugger Canvas window. This, apparently, was added so that it was possible to add meaningful comments when sending an XPS file to someone.
- Ability to do snapshots of local variable methods. Moreover, these snapshots of variable values are visible between sessions. It looks something like this (look at the last two columns of Locals for Do)
- Methods can be added to the Debugger Canvas window through Go To Defninition and Find All References.
Moreover, Debugger Canvas is not going to limit this functionality to us, in the future two functions will be available: the ability to edit directly in these windows, as well as the ability to climb using the IntelliTrace data in Debugger Canvas. Editing in windows can be enabled now, but at your own risk, since this functionality can drop Visual Studio, you can enable it in the Debugger Canvas settings:
Undoubtedly, many Visual Studio users are upset because Debugger Canvas is available only in Ultimate edition. The thing is that the current version is implemented over Visual Studio Ultimate, or rather it uses Dependency Diagrams [1]. Still, there should be some buns in the Ultimate version.
References:
- Debugger Canvas on DevLabs ( msdn blog)
- DevLabs: Debugger Canvas (official DevLabs page, I recommend watching the video, installing from there)
- Debugger Canvas (official site on Microsoft Research, another video)
UPDATE: If there are problems with this plugin or just have suggestions, then you can share this on the Debugger Canvas forums .