Monitoring radiation around Fukushima nuclear power plants and crowdsourcing
As you know, in Japan at the Fukushima nuclear power plant, an accident continues that caused a radiation leak that is now being liquidated. However, in addition to reports from news agencies, TEPCO and Japanese government agencies, citizens organize themselves and monitor the radioactive situation, as well as extract official radiation surveillance data and turn them into visual projects.
Next, I will consider several active projects right now.
1. Pachube
Literally from their website:
Store, share & discover realtime sensor, energy and environment data from objects, devices & buildings around the world. Pachube is a convenient, secure & scalable platform that helps you connect to & build the 'internet of things'.
In fact, this is a system of various sensors connected to the Internet and periodically publishing various indicators such as: radiation level, electricity and gas consumption, and many other devices. This is a very powerful project, with a large catalog of applications, actively developing and, in principle, making an impression.
By selecting the radiation sensors section - http://www.pachube.com/map/tags/sensor:type=radiation, you can get a complete list of them and, in particular, see the sensors in Japan around the Fukushima reactor.
Link - www.pachube.com
Screenshot of the main page:

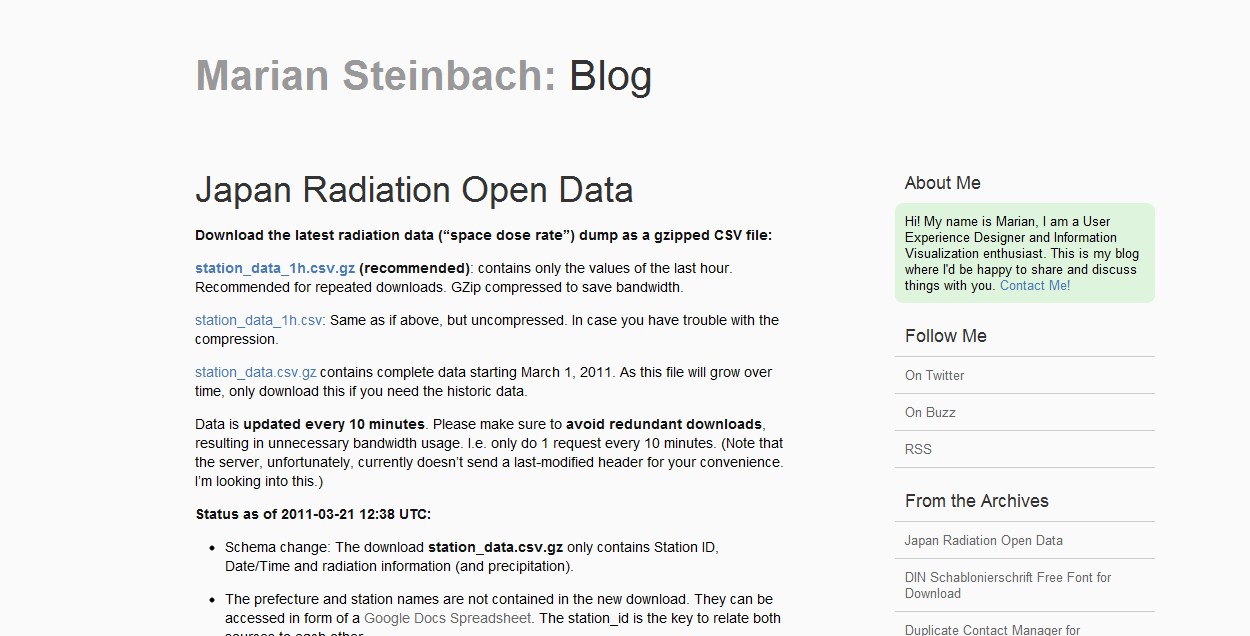
2. Japan Radiation Open Data
Marian Steinbach, an information designer from Germany, first monitored the radiation data manually, and then created a script that scraped the data from the websites of the responsible Japanese departments and published it in open data formats, in the form of CSV files.
Link - www.sendung.de/japan-radiation-open-data
Screenshot of the blog main page:
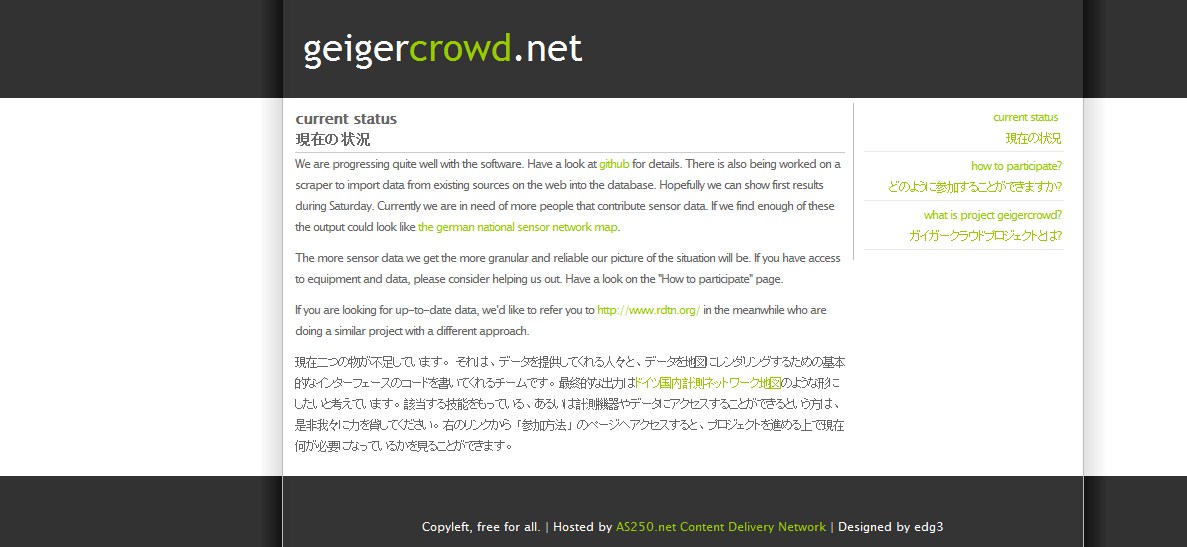
3. GeigerCrowd
This is an open source project with the goal of creating a network for monitoring radiation meter readings. So far, the results there are not as noticeable as on other projects, but the availability of source code allows you to use their best practices.
Link to the site - geigercrowd.net
Repository on GitHub - github.com/geigercrowd
Screenshot of the main page
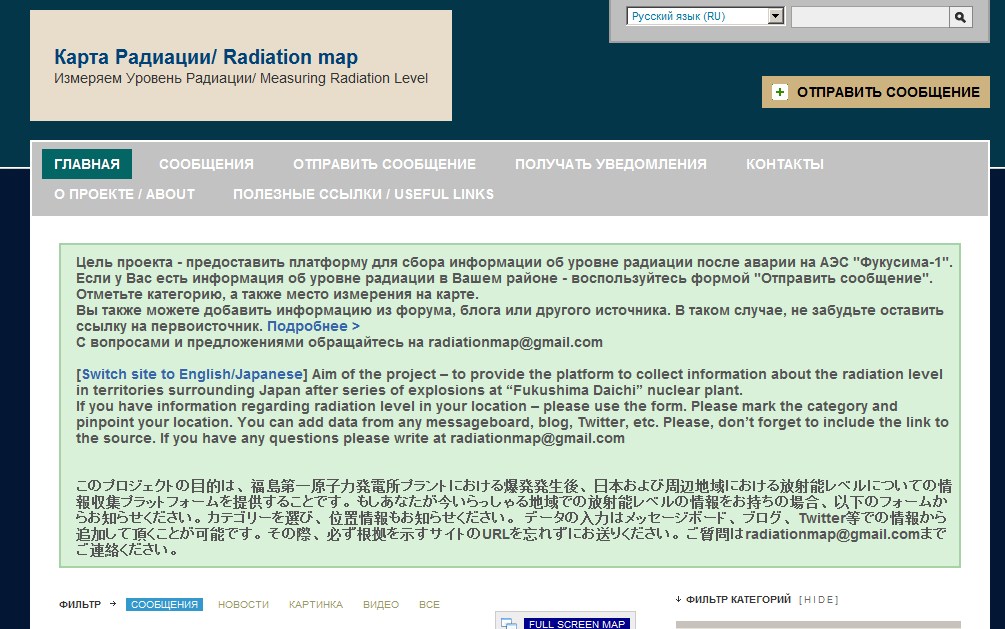
4. Radiation map (Crowdmap)
The radiation map is a thematic project within the Crowdmap service built on the Ushahidi platform
Screenshot of the main page:
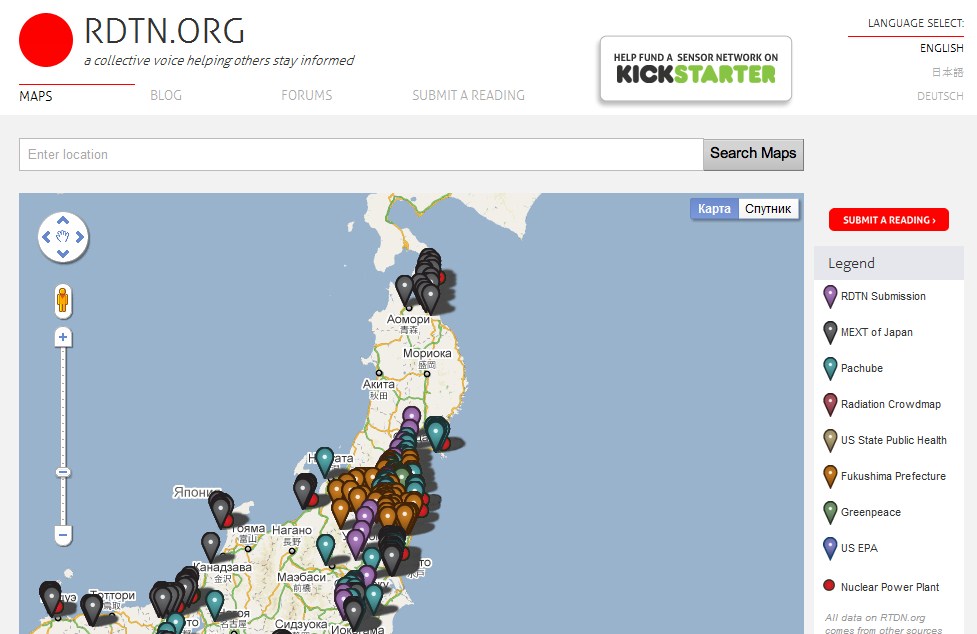
5. RDTN.org
RDTN is now the most comprehensive project for monitoring the radioactive situation. On the map, they display crowdsourcing information from citizens and counter indicators, including counters from Pachube.
Link - www.rdtn.org
Screenshot of the main page:
- I would especially like to mention the Pachube and Crowdmap projects since they are not just thematic, but are initially set up for the high efficiency of their creation. In Pachube it’s enough to add new sensors, and in Crowdmap make a new thematic project through their interface.
This greatly simplifies the response rate of citizens to emergencies.
And, of course, such projects are of great value if there is open state data to monitor the situation and when people try to convert inconvenient state data into open data, as Marian Steinbach does.
Next, I will consider several active projects right now.
1. Pachube
Literally from their website:
Store, share & discover realtime sensor, energy and environment data from objects, devices & buildings around the world. Pachube is a convenient, secure & scalable platform that helps you connect to & build the 'internet of things'.
In fact, this is a system of various sensors connected to the Internet and periodically publishing various indicators such as: radiation level, electricity and gas consumption, and many other devices. This is a very powerful project, with a large catalog of applications, actively developing and, in principle, making an impression.
By selecting the radiation sensors section - http://www.pachube.com/map/tags/sensor:type=radiation, you can get a complete list of them and, in particular, see the sensors in Japan around the Fukushima reactor.
Link - www.pachube.com
Screenshot of the main page:
2. Japan Radiation Open Data
Marian Steinbach, an information designer from Germany, first monitored the radiation data manually, and then created a script that scraped the data from the websites of the responsible Japanese departments and published it in open data formats, in the form of CSV files.
Link - www.sendung.de/japan-radiation-open-data
Screenshot of the blog main page:
3. GeigerCrowd
This is an open source project with the goal of creating a network for monitoring radiation meter readings. So far, the results there are not as noticeable as on other projects, but the availability of source code allows you to use their best practices.
Link to the site - geigercrowd.net
Repository on GitHub - github.com/geigercrowd
Screenshot of the main page
4. Radiation map (Crowdmap)
The radiation map is a thematic project within the Crowdmap service built on the Ushahidi platform
Screenshot of the main page:
5. RDTN.org
RDTN is now the most comprehensive project for monitoring the radioactive situation. On the map, they display crowdsourcing information from citizens and counter indicators, including counters from Pachube.
Link - www.rdtn.org
Screenshot of the main page:
- I would especially like to mention the Pachube and Crowdmap projects since they are not just thematic, but are initially set up for the high efficiency of their creation. In Pachube it’s enough to add new sensors, and in Crowdmap make a new thematic project through their interface.
This greatly simplifies the response rate of citizens to emergencies.
And, of course, such projects are of great value if there is open state data to monitor the situation and when people try to convert inconvenient state data into open data, as Marian Steinbach does.