100 thousand visits per day (debriefing and a new experiment)
 In my last article about the speed of working with GAE data, a graphical impression counter was integrated. Everyone could see the value of the counter and the consumed CPU resources. As I already said, the counter was quite “heavy”: the load it creates is equivalent to displaying 1000 records from a database on a page without using caching.
 The counter experiment turned out to be very useful, and its results are somewhat unexpected for me (different from requests from the same IP address). I want to share the results of the experiment and put in a new experiment, already taking into account the mistakes made. By the way, the source code of the new graphical counter is available to everyone and is given in the article.
Query Schedule
A maximum of 7 requests per second (as many open the main page of Habr in the evening). In the daytime, I think this figure rises to 10 requests per second.
CPU consumption
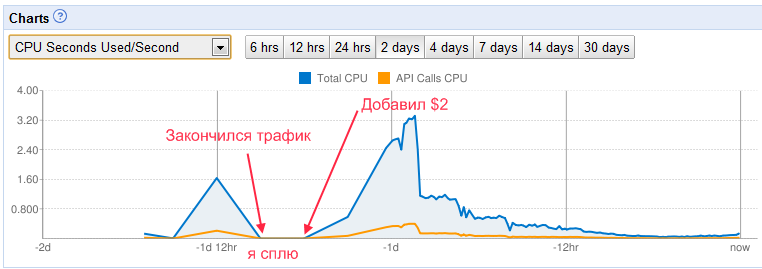
graph The graph captures such an unpleasant moment as the lack of activity. At this moment, the article was on the main page, but the pictures did not appear, since the free limit of resources had ended. In the morning, the situation was corrected.
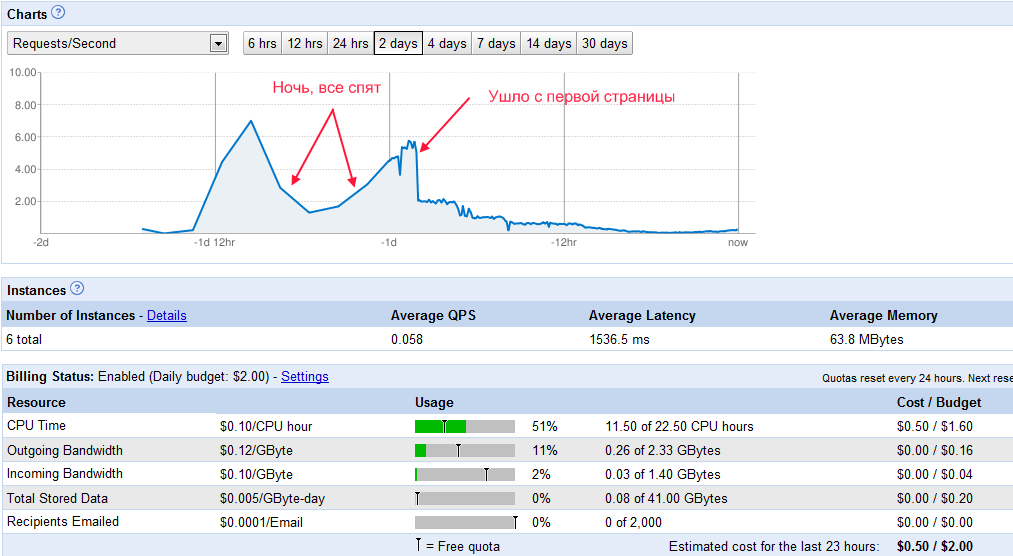
Resource consumption for the first day
There is no resource consumption on the graph until 10 a.m. MCK (since at 10 o'clock the resource counters are reset). Up to 10 hours, about the same was used up. A total of about 150 thousand requests and 500 MB of traffic (part of the requests for a static picture, but they are much smaller).
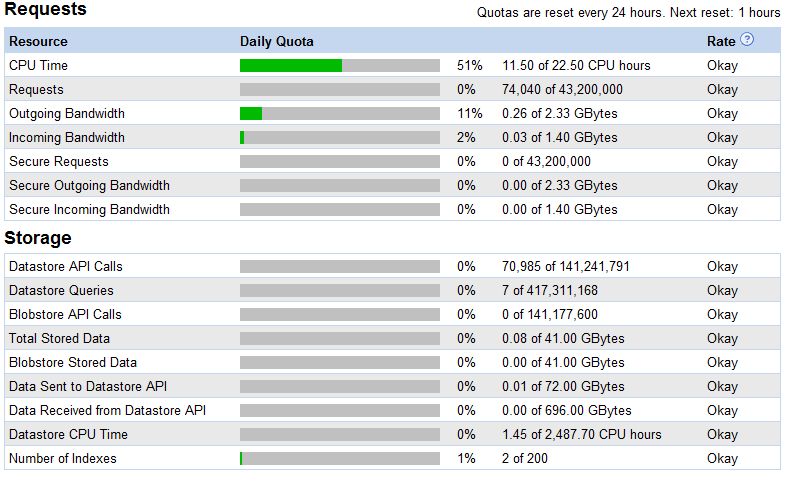
Number of running authorities
Unfortunately, by mistake I deleted the screen with running instances. With 6 visitors per second, 16 instances were launched (this is the maximum that I recorded).
Inhibited requests ???
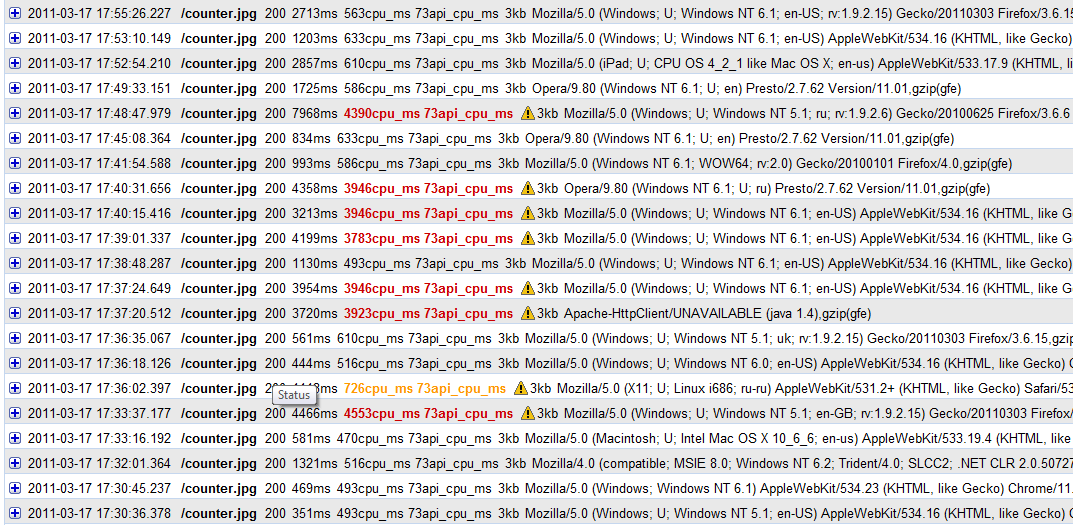
And here is the most interesting. After some time, a problem arose: approximately every 5th request began to be executed 5-10 times longer than the average (on average, the counter loaded for 0.5 seconds). At first, even with many visits, this was not observed. The situation has not changed until now, when there were very few visits.
How to explain these errors? Options:
1. Warm up request. No, since not enough time has passed for the instance to unload (for example, in this graph the time between 3 erroneous requests is less than a minute).
2.Simultaneous modification of the record in the repository with the same key. No, since more than 10 seconds passed between requests.
3. The application was limited as ineffective.
The last remains. This despite the fact that, on average, the request was completed in less than 1 second (about 0.5 sec). The algorithm for determining application inefficiencies was not disclosed, so it’s rather difficult to
say something specific ... Honestly, for me these errors remain a mystery.
Solution
If the problem is really that the application was limited as inefficient, then the problem will not be repeated with the new counter code (org.toyz.litetext was previously used), which runs about 7 times faster. The drawing is very simple, but quite effective (the code is below - you can use it on your website).
Second Edition:
public final class DynamicImage

{

  // Пакет с картинками

  private static final String FOLDER = "resources";


  private static Image backgroundImage;


  private static final Map imageTable = new Hashtable();


  static

  {

    try

    {

      backgroundImage = makeImage("appengine.png");


      imageTable.put("1",

        makeImage("1.png"));

      imageTable.put("2",

        makeImage("2.png"));

      imageTable.put("3",

        makeImage("3.png"));

      imageTable.put("4",

        makeImage("4.png"));

      imageTable.put("5",

        makeImage("5.png"));

      imageTable.put("6",

        makeImage("6.png"));

      imageTable.put("7",

        makeImage("7.png"));

      imageTable.put("8",

        makeImage("8.png"));

      imageTable.put("9",

        makeImage("9.png"));

      imageTable.put("0",

        makeImage("0.png"));


      imageTable.put("(",

        makeImage("leftBracket.png"));

      imageTable.put(")",

        makeImage("rightBracket.png"));

    }

    catch (IOException exception)

    {

      throw new RuntimeException(exception);

    }

  }


  public Image drawText(String text,

    Anchor anchor,

    long backgroundColor)

  {

    if (null == text)

      throw new ArgumentNullException("text");


    if (null == anchor)

      throw new ArgumentNullException("anchor");


    Collection compositeCollection = new ArrayList();


    // background

    compositeCollection.add(ImagesServiceFactory.makeComposite(backgroundImage,

      0,

      0,

      1f,

      Anchor.TOP_LEFT));


    int xOffset = 0;


    for (int pos = 0; pos < text.length(); pos++)

    {

      String symbol = Character.toString(text.charAt(pos));


      if (!imageTable.containsKey(symbol))

        continue;


      Image image = imageTable.get(symbol);


      compositeCollection.add(ImagesServiceFactory.makeComposite(image,

        xOffset,

        0,

        1f,

        anchor));


      xOffset += image.getWidth();

    }


    return ImagesServiceFactory.getImagesService().composite(compositeCollection,

      backgroundImage.getWidth(),

      backgroundImage.getHeight(),

      backgroundColor);

  }


  private static Image makeImage(String imageName)

    throws IOException

  {

    InputStream inputStream = null;

    ByteArrayOutputStream outputStream = null;


    try

    {

      String filePath = FOLDER + File.separatorChar + imageName;

      inputStream = DynamicImage.class.getResourceAsStream(filePath);


      if (null == inputStream)

        throw new IllegalStateException("filePath=" + filePath);


      outputStream = new ByteArrayOutputStream();


      int length;

      byte[] buffer = new byte[1024];


      while ((length = inputStream.read(buffer,

        0,

        buffer.length)) > 0)

      {

        outputStream.write(buffer,

          0,

          length);

      }


      outputStream.flush();


      return ImagesServiceFactory.makeImage(outputStream.toByteArray());

    }

    finally

    {

      if (null != inputStream)

        inputStream.close();


      if (null != outputStream)

        outputStream.close();

    }

  }

}


* This source code was highlighted with Source Code Highlighter.
I ask the community to participate in the experiment.
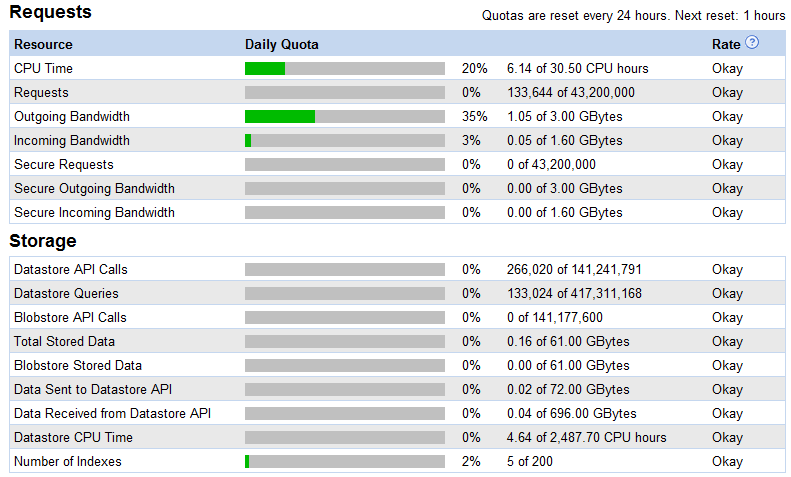
The results of the experiment made me happy! For half a day, the counter was opened by about 100 thousand people (as expected). At the same time, 1 GB of traffic was spent (well, at least I reduced the picture, otherwise it would not fit into the 3 GB limit):
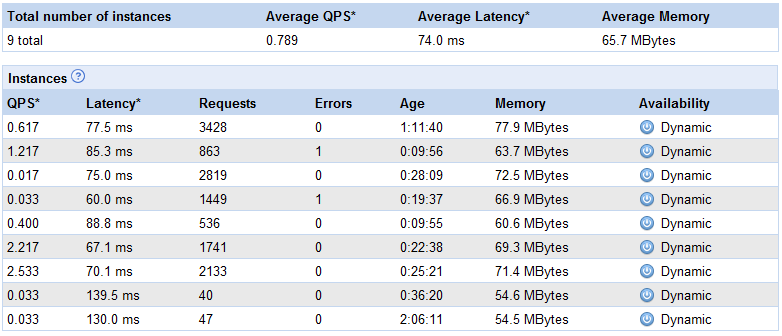
In this case, the maximum number of running authorities was 9 pcs. (at 8 requests per second):
And requests at this moment were executed without delay. Here is an excerpt from the log:
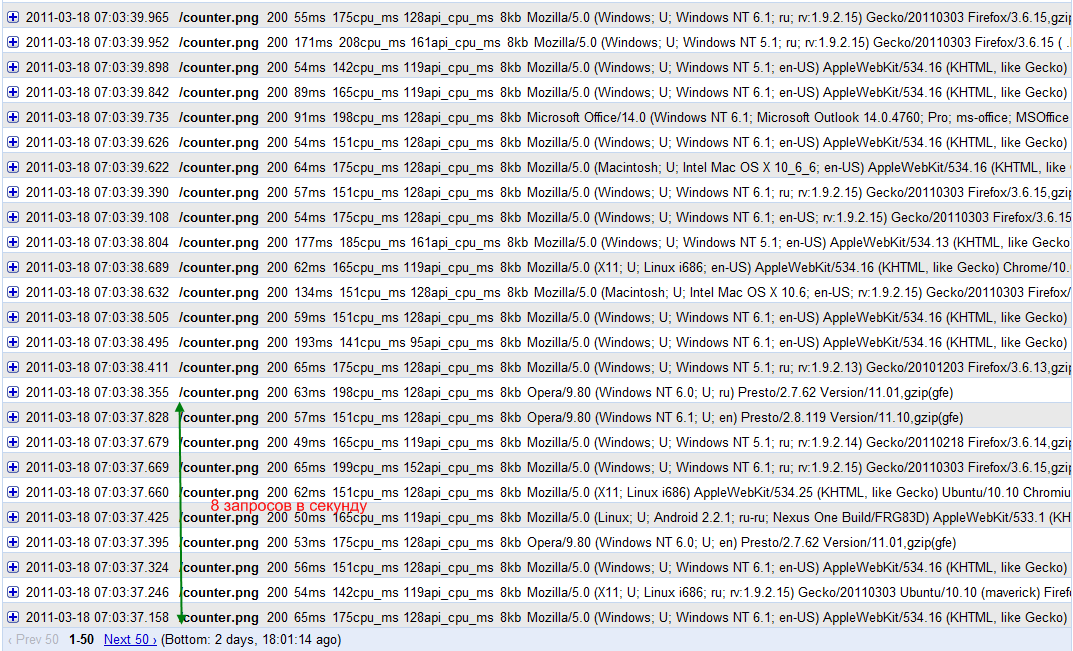
In this case, each request wrote to the database and checked the uniqueness of the IP address. It came out for FREE! Enough free resources!
Conclusion
With proper use, GAE can withstand a tremendous load. Google really did what many dreamed of: paying only for actually used resources (everything is fair: if you don’t use it, you don’t have to pay anything). We only need to create services that would attract so many visitors.