Approach to Online Analysis Processing
In the wake of this post.
Users of the system who are interested in processing and analyzing data should be given the opportunity to view specialized reports on changes in the system. Any user of the system that requires reporting information, obviously, uses it in that field of activity that is applied to the activity registered in the System. It follows that the System should be able to provide so many reporting forms so that each user can satisfactorily use some combination of them in their work.
This problem can be solved in two ways:
Obviously, the first method is very difficult in practice, because the probability of making a mistake at the stage of designing templates is very high. The disadvantages of the second method include a limited set of measurements by which analysis can be performed. Assuming that the task of the analysis is to minimize data sets that are inaccessible for reporting while satisfying the maximum needs of users, the solution to the problem is a combination of the two proposed methods. Moreover, given that the customer has expectations from the system a priori, then the majority of user requirements are covered with static templates. The OLAP mechanisms, in turn, will allow you to create dynamic reports for more “sophisticated” analysis conditions, describe the dynamics of filling the System and show the directions of the vectors of changes in the data.
In order to describe the technological solution with specific steps at the design stage, one should turn to database design methods. There are several of them, but in the cases described it is worth considering only two:
The first approach implies a “standard” database design, when several normalization rules are executed like “permissible abstraction - entity - table”. In this form, the System database is designed. It is ideal for storing data in view of its effective redundancy when a set of related data is in the database with a minimum of duplicate fields, and, as a result, takes a minimum of space, all other things being equal. This approach is the opposite of the second (OLAP), the imperative of which is the maximum allowable denormalization of data and the relationships between them.
The technology of OLAP data analysis is based on the creation of the so-called multidimensional OLAP cubes, which are nothing more than a function of many variables (or measurements), the discrete set of values of which (the so-called facts) describe some kind of qualitative state of the system. By specifying some of the dimensions of this function (i.e., a cube) as input parameters, you can obtain a set of data suitable for use in a dynamic report template. Obviously, in order to quickly obtain such a set of data, one should a priori know the finite set of values for each dimension. Thus, the redundancy of links and duplicate data in OLAP design is not a disadvantage in view of the goals achieved:
A common example of such measurements are:
The design of the OLTP database is designed in such a way as to minimize the excessive number of values for any of the valid dimensions, and, therefore, is not suitable as a data source for the cube. In order for the measurements to be sufficiently complete, the original database of the System should be converted to the so-called data warehouse - a specialized OLAP database that meets the conditions of the task. It will serve as a source of data used in reports.
From the foregoing, it follows that when solving the problem of data analysis, the following statements are true:
There are two drawbacks to this approach:
The indicated time intervals can be critical for users, because between them there is a state of the system, described as “data outdated”. This means that if the report was built at a certain point in time longer than the time of the last run of the denormalizing transformation and shorter than the time of the subsequent one, then it will show data that are irrelevant to the user. The out-of-date time for such data will be no more than the set launch interval.
Thus, the secondary task of data analysis is the task of minimizing time intervals with minimal complexity of the transforming function. System developers should give this task high priority.
For the most efficient use of denormalized data by the cube, the storage structure must satisfy the following conditions:
In practice, these four conditions will be characterized by the topology of the snowflake database tables:
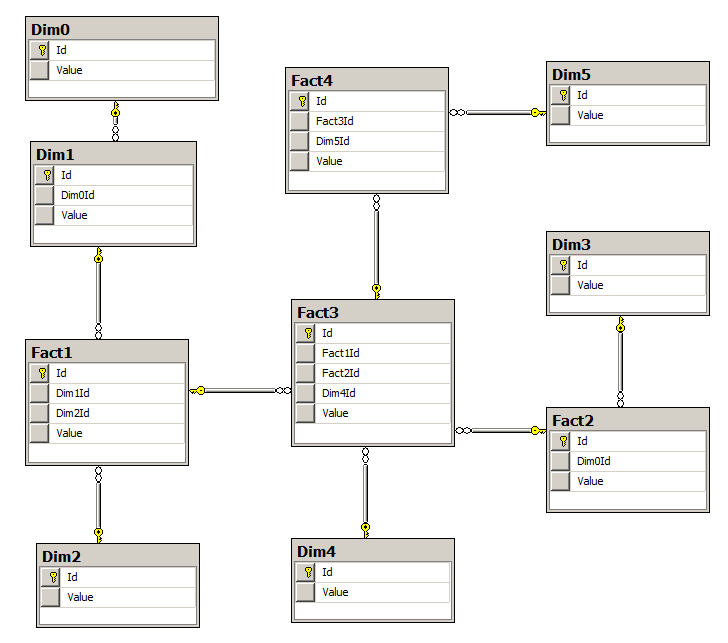
Figure 1: an example of the practical implementation of the snowflake database storage.
Here, Value is the value of measurements, facts.
In practice, a denormalizing transformation is specified in stored procedures and executed in JOB-like database processes at specified intervals.
Static report templates differ from dynamic templates only in the way they are received. In the dynamic version, the template is built by the user using a special program, while the static templates are not accessible to the user for editing and must be manually selected by the user from a fixed list.
Templates can be parameterized. In this case, such values are transferred to the cube through a special interface query language in the form of specialized parameters.
An example of an industrial solution to the problem of analysis and reporting is Microsoft Analysis Services and Microsoft Reporting Services.
Users of the system who are interested in processing and analyzing data should be given the opportunity to view specialized reports on changes in the system. Any user of the system that requires reporting information, obviously, uses it in that field of activity that is applied to the activity registered in the System. It follows that the System should be able to provide so many reporting forms so that each user can satisfactorily use some combination of them in their work.
This problem can be solved in two ways:
- At the design stage, plan all kinds of static (ready-made) reporting templates and fill them with data at the request of users.
- To develop a dynamic reporting model on the fly using OLAP (OnLine Analytical Processing) analysis technologies, then OLAP.
Obviously, the first method is very difficult in practice, because the probability of making a mistake at the stage of designing templates is very high. The disadvantages of the second method include a limited set of measurements by which analysis can be performed. Assuming that the task of the analysis is to minimize data sets that are inaccessible for reporting while satisfying the maximum needs of users, the solution to the problem is a combination of the two proposed methods. Moreover, given that the customer has expectations from the system a priori, then the majority of user requirements are covered with static templates. The OLAP mechanisms, in turn, will allow you to create dynamic reports for more “sophisticated” analysis conditions, describe the dynamics of filling the System and show the directions of the vectors of changes in the data.
In order to describe the technological solution with specific steps at the design stage, one should turn to database design methods. There are several of them, but in the cases described it is worth considering only two:
- Online Transaction Processing (OLTP)
- Online Analytical Processing (OLAP)
The first approach implies a “standard” database design, when several normalization rules are executed like “permissible abstraction - entity - table”. In this form, the System database is designed. It is ideal for storing data in view of its effective redundancy when a set of related data is in the database with a minimum of duplicate fields, and, as a result, takes a minimum of space, all other things being equal. This approach is the opposite of the second (OLAP), the imperative of which is the maximum allowable denormalization of data and the relationships between them.
The technology of OLAP data analysis is based on the creation of the so-called multidimensional OLAP cubes, which are nothing more than a function of many variables (or measurements), the discrete set of values of which (the so-called facts) describe some kind of qualitative state of the system. By specifying some of the dimensions of this function (i.e., a cube) as input parameters, you can obtain a set of data suitable for use in a dynamic report template. Obviously, in order to quickly obtain such a set of data, one should a priori know the finite set of values for each dimension. Thus, the redundancy of links and duplicate data in OLAP design is not a disadvantage in view of the goals achieved:
- Minimizing value calculations for the desired measurement
- Minimization of the calculation of the value of the state of the system (fact)
A common example of such measurements are:
- Time as measurement
- Entity Attributes as a Dimension
- Number of Entities as a Cube Value
The design of the OLTP database is designed in such a way as to minimize the excessive number of values for any of the valid dimensions, and, therefore, is not suitable as a data source for the cube. In order for the measurements to be sufficiently complete, the original database of the System should be converted to the so-called data warehouse - a specialized OLAP database that meets the conditions of the task. It will serve as a source of data used in reports.
From the foregoing, it follows that when solving the problem of data analysis, the following statements are true:
- Using a special conversion, it is necessary to fill the database data from the main database with data
- For reports (both static and dynamic), DB storage will be used, and for AWPs of the system and the rest of the equipment, the main DB of the System
- The resources consumed by the system when building reports and the rest of the work with the database will be distributed in parallel, thereby splitting into two independent execution processes and not interfering with each other
There are two drawbacks to this approach:
- It is required to create a data transformation that distills values from the main database to the storage
- Since the transformation is theoretically resource-intensive, it can be performed at certain intervals.
The indicated time intervals can be critical for users, because between them there is a state of the system, described as “data outdated”. This means that if the report was built at a certain point in time longer than the time of the last run of the denormalizing transformation and shorter than the time of the subsequent one, then it will show data that are irrelevant to the user. The out-of-date time for such data will be no more than the set launch interval.
Thus, the secondary task of data analysis is the task of minimizing time intervals with minimal complexity of the transforming function. System developers should give this task high priority.
Practical solution
For the most efficient use of denormalized data by the cube, the storage structure must satisfy the following conditions:
- The database consists of measurement tables and facts
- Fact is the calculated value of a multidimensional function (cube), which is a qualitative characteristic of the system.
- Facts themselves may be dimensions and vice versa
- Tables should be connected so that there is at least one algorithmic way to get a fact from given dimensions.
In practice, these four conditions will be characterized by the topology of the snowflake database tables:
Figure 1: an example of the practical implementation of the snowflake database storage.
Here, Value is the value of measurements, facts.
In practice, a denormalizing transformation is specified in stored procedures and executed in JOB-like database processes at specified intervals.
Static report templates differ from dynamic templates only in the way they are received. In the dynamic version, the template is built by the user using a special program, while the static templates are not accessible to the user for editing and must be manually selected by the user from a fixed list.
Templates can be parameterized. In this case, such values are transferred to the cube through a special interface query language in the form of specialized parameters.
An example of an industrial solution to the problem of analysis and reporting is Microsoft Analysis Services and Microsoft Reporting Services.