IntelliTrace or historical debugger in Visual Studio 2010
Probably one of the most intriguing innovations in Visual Studio 2010 is IntelliTrace, or as it was previously presented by historical debugger. And after the release of the new studio, you can add your opinion about this opportunity and its practical application or necessity - in general, to be brief, you need to decide - why do we need it
What is IntelliTrace? This is a new feature, and accordingly a new window for debugging, which combines the usual trace (output window in Visual Studio), debugger and call stack. Those. such a mix of already existing windows and, accordingly, capabilities - output + callstack + debugger = IntelliTrace.
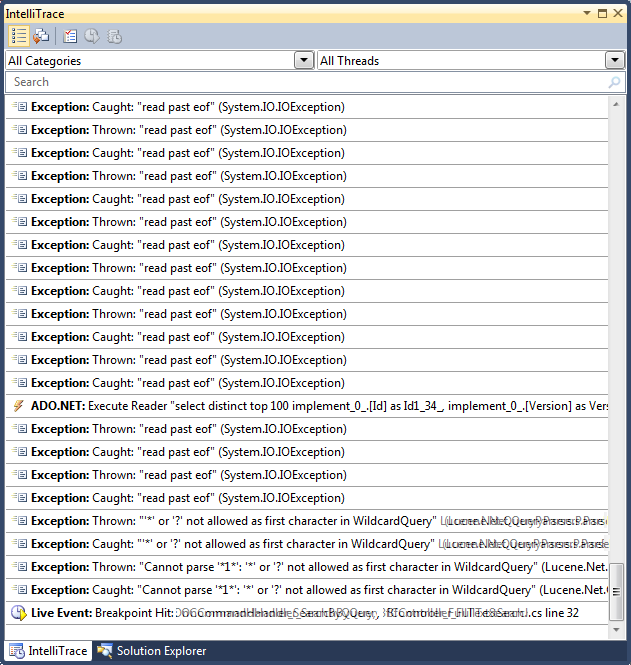
IntelliTrace is a window that appears during debugging or which can be displayed from Debug> Windows. When it gets into the code (breakpoint, the occurrence of expcetion, etc.), it shows all the events that it records, including exceptions, actions with controls, access to the database and many others (you can see / enable / disable them in Options> Tools> IntelliTrace> IntelliTrace events). The newest events are at the bottom of the list, and accordingly the oldest at the top. The Live event is where we are now "in code" at runtime.
By selecting a specific event, you can go to the place in the code where it occurred, view the call stack and even the values of the variables (if the IntelliTrace events and call information mode is selected).

There are two modes of operation:
- Event only
- Events and call information
In the latter mode, the values of the variables are fixed at the event point. You can switch between them in the options as shown in the screenshot:
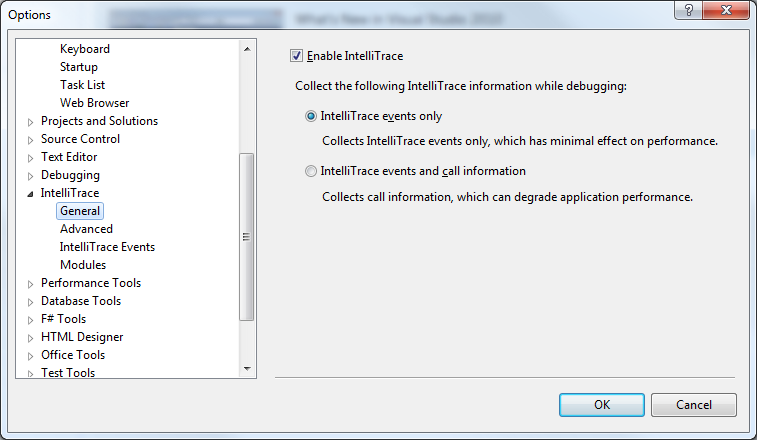
There, in the IntelliTrace events node, you can configure which events are worth responding to.
So, is IntelliTrace still needed? This is undoubtedly a fairly comfortable addition to the existing debugging capabilities, which can greatly simplify debugging, for example, UI event calls for controls, access to the database, everything can be easily seen and accessed in the code. IntelliTrace can greatly simplify debugging or make it more comfortable.

Performance can be improved slightly using Event only mode and only occasionally switching to Events and call information, since this can be done quickly from the IntelliTrace window. You can also specify from which specific modules to collect information. By default, there is the option to collect from all (collect data from all modules except following) except Microsoft, it can be changed to "collect only from the following" (collect data from only following modules).

IntelliTrace is also used in the new testing system - Microsoft Test And Lab Management. IntelliTrace are added to bugs and developers can later open them on their computer to reproduce the situation exactly. Which makes working with such a bug much more convenient. Moreover, even if the source code on the developer's machine is different from the record, it is possible, with the “pdb server” configured correctly, to debug the code of the version that is relevant to the bug.
To summarize the IntelliTrace. What we have?
Pros:
+ Debugging becomes more comfortable and more visual. It’s easier to intercept now, for example, extra calls to event handlers, calls to the database, escapes, etc., since the call stack and variable values are saved (in events and call information mode)
+ Testing. The interaction of the tester and the developer. Now it’s easier to debug bugs since we have additional information on hand in the form of events, their stacks and variable values. Integration with the studio and Microsoft Test And Lab Management. You can fumble iTrace files between developers, companies.
Cons:
- Available only in the most expensive studio edition - Ultimate
- Performance. On simple applications, debugging starts quickly, on complex ones for a long time. Therefore, you probably have to work out a mode of operation when we mainly debug without IntelliTrace or in lightweight events only mode and in exceptional cases turn on the heavy mode
- Only for x86 applications
- I would like to have more events and the ability to expand them with my own.
The main horse of IntelliTrace is just testing. This allows, in conjunction with Microsoft Test Manager and TFS, to create bugs and other work items in TFS with the IntelliTrace data written to an iTrace file. By doing this, Microsoft tried to get rid of bugs that are "not reproducible." In this regard, no doubt everything worked out. Perhaps in the future IntelliTrace will develop and get rid of some of its shortcomings. We will follow this up.
Here is such an IntelliTrace. How much the advantages are comparable with the disadvantages - this will already be decided by everyone based on their tasks and requirements. Developers still have to work out a style of working with it and each one will decide whether to use it, having weighed all the pros and cons.
What is IntelliTrace? This is a new feature, and accordingly a new window for debugging, which combines the usual trace (output window in Visual Studio), debugger and call stack. Those. such a mix of already existing windows and, accordingly, capabilities - output + callstack + debugger = IntelliTrace.
IntelliTrace is a window that appears during debugging or which can be displayed from Debug> Windows. When it gets into the code (breakpoint, the occurrence of expcetion, etc.), it shows all the events that it records, including exceptions, actions with controls, access to the database and many others (you can see / enable / disable them in Options> Tools> IntelliTrace> IntelliTrace events). The newest events are at the bottom of the list, and accordingly the oldest at the top. The Live event is where we are now "in code" at runtime.
By selecting a specific event, you can go to the place in the code where it occurred, view the call stack and even the values of the variables (if the IntelliTrace events and call information mode is selected).
There are two modes of operation:
- Event only
- Events and call information
In the latter mode, the values of the variables are fixed at the event point. You can switch between them in the options as shown in the screenshot:
There, in the IntelliTrace events node, you can configure which events are worth responding to.
So, is IntelliTrace still needed? This is undoubtedly a fairly comfortable addition to the existing debugging capabilities, which can greatly simplify debugging, for example, UI event calls for controls, access to the database, everything can be easily seen and accessed in the code. IntelliTrace can greatly simplify debugging or make it more comfortable.
Performance can be improved slightly using Event only mode and only occasionally switching to Events and call information, since this can be done quickly from the IntelliTrace window. You can also specify from which specific modules to collect information. By default, there is the option to collect from all (collect data from all modules except following) except Microsoft, it can be changed to "collect only from the following" (collect data from only following modules).
IntelliTrace is also used in the new testing system - Microsoft Test And Lab Management. IntelliTrace are added to bugs and developers can later open them on their computer to reproduce the situation exactly. Which makes working with such a bug much more convenient. Moreover, even if the source code on the developer's machine is different from the record, it is possible, with the “pdb server” configured correctly, to debug the code of the version that is relevant to the bug.
To summarize the IntelliTrace. What we have?
Pros:
+ Debugging becomes more comfortable and more visual. It’s easier to intercept now, for example, extra calls to event handlers, calls to the database, escapes, etc., since the call stack and variable values are saved (in events and call information mode)
+ Testing. The interaction of the tester and the developer. Now it’s easier to debug bugs since we have additional information on hand in the form of events, their stacks and variable values. Integration with the studio and Microsoft Test And Lab Management. You can fumble iTrace files between developers, companies.
Cons:
- Available only in the most expensive studio edition - Ultimate
- Performance. On simple applications, debugging starts quickly, on complex ones for a long time. Therefore, you probably have to work out a mode of operation when we mainly debug without IntelliTrace or in lightweight events only mode and in exceptional cases turn on the heavy mode
- Only for x86 applications
- I would like to have more events and the ability to expand them with my own.
The main horse of IntelliTrace is just testing. This allows, in conjunction with Microsoft Test Manager and TFS, to create bugs and other work items in TFS with the IntelliTrace data written to an iTrace file. By doing this, Microsoft tried to get rid of bugs that are "not reproducible." In this regard, no doubt everything worked out. Perhaps in the future IntelliTrace will develop and get rid of some of its shortcomings. We will follow this up.
Here is such an IntelliTrace. How much the advantages are comparable with the disadvantages - this will already be decided by everyone based on their tasks and requirements. Developers still have to work out a style of working with it and each one will decide whether to use it, having weighed all the pros and cons.