Graphics using Python
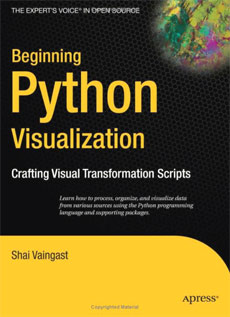
 Apress publishes Beginning Python Visualization: Crafting Visual Transformation Scripts , a book dedicated to visualizing data using Python and related tools. This is a unique work, because such things are rarely done on Python. The author of the book says that he himself was looking for such a guide for his work, but could not find it, and he had to figure it out on his own.
 The book provides several examples of how data can be visualized. For example, using Python, you can extract data from a GPS receiver through a serial port and process it on your computer as you please, including creating graphs and charts. The author shows all this with the example of a specific GPS receiver and PySerial module .
The most important thing in the book is a detailed demonstration of how to work with the well-known for visualization of mathematical and scientific data MatPlotLib , NumPy and SciPy , as well as with the PIL library (Python Imaging Library) for the simplest image processing.
You can browse the book in the Amazon store (at the link above).
