From High Ceph Latency to Kernel Patch with eBPF / BCC

Linux has a large number of kernel debugging tools and applications. Most of them adversely affect application performance and cannot be used in production.
A couple of years ago, another tool was developed - eBPF. It makes it possible to trace the kernel and user applications with a low overhead and without the need to rebuild programs and load third-party modules into the kernel.
There are already many application utilities that use eBPF, and in this article we will look at how to write our own profiling utility based on the PythonBCC library. The article is based on real events. We will go from the appearance of the problem to its correction to show how existing utilities can be used in specific situations.
Ceph is slow
A new host has been added to the Ceph cluster. After migrating some of the data to it, we noticed that the speed of processing write requests is much lower than on other servers.
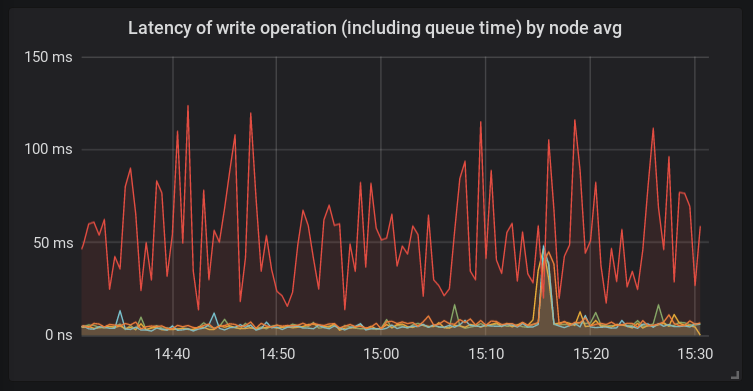
Unlike other platforms, bcache and the new linux 4.15 kernel were used on this host. A host of this configuration was used here for the first time. And at that time it was clear that theoretically anything could be the root of the problem.
Investigating the host
To begin with, let's see what happens inside the ceph-osd process. To do this, we use perf and flamescope (more about which can be read here ):
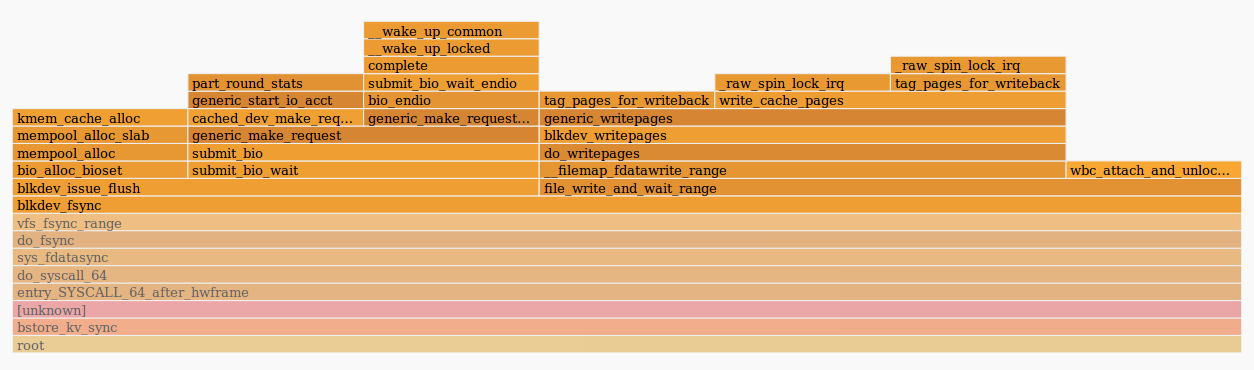
The picture tells us that the fdatasync () function spent a lot of time sending a request to the generic_make_request () function . This means that most likely the cause of the problems is somewhere outside the osd daemon itself. It can be either a kernel or disks. The iostat output showed a high latency in processing requests with bcache disks.
When checking the host, we found that the systemd-udevd daemon consumes a large amount of CPU time - about 20% on multiple cores. This is a strange behavior, so you need to find out its cause. Since Systemd-udevd works with uevents, we decided to look at them through udevadm monitor. It turns out that a large number of change events were generated for each block device in the system. This is quite unusual, so you will need to see what generates all these events.
Using the BCC Toolkit
As we already found out, the kernel (and the ceph daemon in the system call) spends a lot of time in generic_make_request () . Let's try to measure the speed of this function. The BCC is already a wonderful tool - funclatency . We will trace the daemon by its PID with an interval between information outputs of 1 second and output the result in milliseconds.
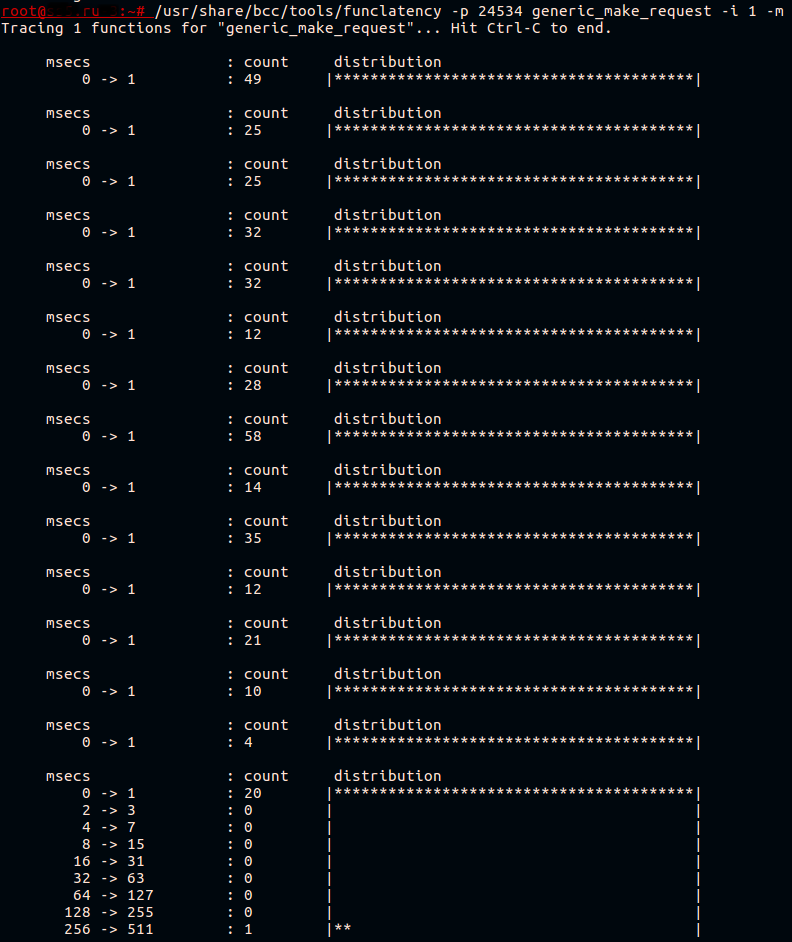
Usually this function is fast. All she does is send the request to the device driver queue.
Bcache is a complex device that actually consists of three disks:
- backing device (cached disk), in this case it is a slow HDD;
- caching device (caching disk), here it is one section of the NVMe device;
- bcache virtual device with which the application works.
We know that request transmission is slow, but for which of these devices? We will deal with this a bit later.
We now know that uevents are probably causing problems. Finding what exactly causes their generation is not so simple. Suppose this is some kind of software that runs periodically. Let's see what kind of software is launched on the system using the execsnoop script from the same set of BCC utilities . Run it and direct the output to a file.
For example, like this:
/usr/share/bcc/tools/execsnoop | tee ./execdump
We will not give the full output of execsnoop here, but one line of interest to us looked like this:
sh 1764905 5802 0 sudo arcconf getconfig 1 AD | grep Temperature | awk -F '[:/]' '{print $2}' | sed 's/^ \([0-9]*\) C.*/\1/'
The third column is the PPID (parent PID) of the process. The process with PID 5802 turned out to be one of the threads of our monitoring system. When checking the configuration of the monitoring system, erroneous parameters were found. The temperature of the HBA adapter was taken once every 30 seconds, which is much more often than necessary. After changing the verification interval to a longer one, we found that the delay in processing requests on this host has ceased to stand out from the rest of the hosts.
But it’s still not clear why the bcache device was so slow. We prepared a test platform with the same configuration and tried to reproduce the problem by running fio on bcache, periodically starting the udevadm trigger to generate uevents.
Writing BCC-Based Tools
Let's try to write a simple utility for tracing and displaying the slowest calls to generic_make_request () . We are also interested in the name of the drive for which this function was called.
The plan is simple:
- Register kprobe to generic_make_request () :
- We save the disk name accessible through the function argument;
- Save the time stamp.
- Register kretprobe to return from generic_make_request () :
- Get the current timestamp;
- We search for the saved timestamp and compare it with the current one;
- If the result is greater than the specified one, then we find the saved disk name and display it on the terminal.
The eBPF text inside the python script looks like this:
bpf_text = “”” # Here will be the bpf program code “””
To exchange data between functions, eBPF programs use hash tables . So will we. As the key, we will use the PID of the process, and as the value we define the structure:
struct data_t {
	u64 pid;
	u64 ts;
	char comm[TASK_COMM_LEN];
	u64 lat;
	char disk[DISK_NAME_LEN];
};
BPF_HASH(p, u64, struct data_t);
BPF_PERF_OUTPUT(events);
Here we register a hash table called p , with a key of type u64 and a value of type struct data_t . The table will be available in the context of our BPF program. The BPF_PERF_OUTPUT macro registers another table called events , which is used to transfer data to user space.
When measuring delays between a function call and return from it, or between calls to different functions, it should be borne in mind that the data received must belong to the same context. In other words, you need to remember about the possible parallel launch of functions. We have the opportunity to measure the delay between calling a function in the context of one process and returning from that function in the context of another process, but this is most likely useless. A good example here is the biolatency utility , where a pointer to a struct request , which reflects a single disk request , is set as a key in the hash table .
Next, we need to write the code that will be run when the function being investigated is called:
void start(struct pt_regs *ctx, struct bio *bio) {
	u64 pid = bpf_get_current_pid_tgid();
	struct data_t data = {};
	u64 ts = bpf_ktime_get_ns();
	data.pid = pid;
	data.ts = ts;
	bpf_probe_read_str(&data.disk, sizeof(data.disk), (void*)bio->bi_disk->disk_name);
	p.update(&pid, &data);
}
Here, the second argument of the called generic_make_request () function will be substituted as the second argument . After that, we get the PID of the process in which we are working, and the current timestamp in nanoseconds. We write all this in the newly allocated struct data_t data . We get the disk name from the bio structure , which is passed when calling generic_make_request () , and save it in the same data structure . The last step is to add an entry to the hash table that was mentioned earlier.
The following function will be called on return from generic_make_request () :
void stop(struct pt_regs *ctx) {
    u64 pid = bpf_get_current_pid_tgid();
    u64 ts = bpf_ktime_get_ns();
    struct data_t* data = p.lookup(&pid);
    if (data != 0 && data->ts > 0) {
        bpf_get_current_comm(&data->comm, sizeof(data->comm));
        data->lat = (ts - data->ts)/1000;
        if (data->lat > MIN_US) {
            FACTOR
            data->pid >>= 32;
            events.perf_submit(ctx, data, sizeof(struct data_t));
        }
        p.delete(&pid);
    }
}
This function is similar to the previous one: we recognize the process PID and timestamp, but do not allocate memory for the new data structure. Instead, we look in the hash table for an existing structure with the key == current PID. If the structure is found, then we will find out the name of the running process and add it to it.
The binary shift that we use here is needed in order to get the thread GID. those. The PID of the main process that started the thread in the context of which we are working. The bpf_get_current_pid_tgid () function we are calling returns both the GID of the thread and its PID in one 64-bit value.
When outputting to the terminal, now we are not interested in the stream, but in the main process. After comparing the received delay with a given threshold, we pass our data structureinto user space through the events table , after which we delete the record from p .
In the python script that will load this code, we need to replace MIN_US and FACTOR with the delay thresholds and time units, which we will pass through the arguments:
bpf_text = bpf_text.replace('MIN_US',str(min_usec))
if args.milliseconds:
	bpf_text = bpf_text.replace('FACTOR','data->lat /= 1000;')
	label = "msec"
else:
	bpf_text = bpf_text.replace('FACTOR','')
	label = "usec"
Now we need to prepare the BPF program through the BPF macro and register the samples:
b = BPF(text=bpf_text)
b.attach_kprobe(event="generic_make_request",fn_name="start")
b.attach_kretprobe(event="generic_make_request",fn_name="stop")
We will also have to define struct data_t in our script, otherwise we won’t be able to read anything:
TASK_COMM_LEN = 16	# linux/sched.h
DISK_NAME_LEN = 32	# linux/genhd.h
class Data(ct.Structure):
	_fields_ = [("pid", ct.c_ulonglong),
            	("ts", ct.c_ulonglong),
            	("comm", ct.c_char * TASK_COMM_LEN),
            	("lat", ct.c_ulonglong),
            	("disk",ct.c_char * DISK_NAME_LEN)]
The last step is data output to the terminal:
def print_event(cpu, data, size):
    global start
    event = ct.cast(data, ct.POINTER(Data)).contents
    if start == 0:
        start = event.ts
    time_s = (float(event.ts - start)) / 1000000000
    print("%-18.9f %-16s %-6d   %-1s %s   %s" % (time_s, event.comm, event.pid, event.lat, label, event.disk))
b["events"].open_perf_buffer(print_event)
# format output
start = 0
while 1:
    try:
        b.perf_buffer_poll()
    except KeyboardInterrupt:
        exit()
The script itself is available on GItHub . Let's try to run it on a test platform where fio is written in bcache and call udevadm monitor:
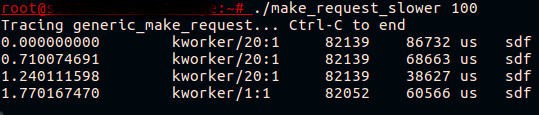
At last! Now we see that what looked like a braking bcache device is actually a braking call to generic_make_request () on a cached drive.
Dig into the kernel
What exactly slows down during the transmission of the request? We see that the delay occurs even before the start of the accounting of the request, i.e. accounting for a specific request for further statistics on it (/ proc / diskstats or iostat) has not yet begun. This can be easily verified by running iostat while reproducing the problem, or the BCC biolatency script , which is based on the beginning and end of the accounting of requests. None of these utilities will show problems for queries to the cached drive.
If we take a look at the generic_make_request () function , we will see that two more functions are called before the request is recorded . The first one, generic_make_request_checks () , checks the legitimacy of a request for disk settings. Second -blk_queue_enter () , which has an interesting call to wait_event_interruptible () :
ret = wait_event_interruptible(q->mq_freeze_wq,
	(atomic_read(&q->mq_freeze_depth) == 0 &&
	(preempt || !blk_queue_preempt_only(q))) ||
	blk_queue_dying(q));
In it, the kernel awaits the defrost of the queue. We measure the delay blk_queue_enter () :
~# /usr/share/bcc/tools/funclatency  blk_queue_enter -i 1 -m
Tracing 1 functions for "blk_queue_enter"... Hit Ctrl-C to end.
 	msecs           	: count 	distribution
     	0 -> 1      	: 341  	|****************************************|
 	msecs           	: count 	distribution
     	0 -> 1      	: 316  	|****************************************|
 	msecs           	: count 	distribution
     	0 -> 1      	: 255  	|****************************************|
     	2 -> 3      	: 0    	|                                    	|
     	4 -> 7      	: 0    	|                                    	|
     	8 -> 15     	: 1    	|                                    	|
It seems that we are close to a solution. The functions used to “freeze / unfreeze” the queue are blk_mq_freeze_queue and blk_mq_unfreeze_queue . They are used when it is necessary to change the settings of the query queue, which are potentially dangerous for the queries in this queue. When calling blk_mq_freeze_queue () function blk_freeze_queue_start () is incremented counter q-> mq_freeze_depth . After that, the kernel waits for the emptying of the queue in blk_mq_freeze_queue_wait () .
Waiting time to clear this queue is equivalent to disk latency, since the kernel waits for all queued operations to complete. As soon as the queue is empty, changes to the settings are applied. Then blk_mq_unfreeze_queue () is called , decrementing the counter freeze_depth .
Now we know enough to rectify the situation. The udevadm trigger command results in the application of settings for the block device. These settings are described in the udev rules. We can find out exactly which settings “freeze” the queue by trying to change them through sysfs or by looking at the kernel source code. We can also try the BCC trace utility , which displays the kernel stack and user space traces for each call on the terminalblk_freeze_queue , for example:
~# /usr/share/bcc/tools/trace blk_freeze_queue -K -U
PID 	TID 	COMM        	FUNC
3809642 3809642 systemd-udevd   blk_freeze_queue
    	blk_freeze_queue+0x1 [kernel]
    	elevator_switch+0x29 [kernel]
    	elv_iosched_store+0x197 [kernel]
    	queue_attr_store+0x5c [kernel]
    	sysfs_kf_write+0x3c [kernel]
    	kernfs_fop_write+0x125 [kernel]
    	__vfs_write+0x1b [kernel]
    	vfs_write+0xb8 [kernel]
    	sys_write+0x55 [kernel]
    	do_syscall_64+0x73 [kernel]
    	entry_SYSCALL_64_after_hwframe+0x3d [kernel]
    	__write_nocancel+0x7 [libc-2.23.so]
    	[unknown]
3809631 3809631 systemd-udevd   blk_freeze_queue
    	blk_freeze_queue+0x1 [kernel]
    	queue_requests_store+0xb6 [kernel]
    	queue_attr_store+0x5c [kernel]
    	sysfs_kf_write+0x3c [kernel]
    	kernfs_fop_write+0x125 [kernel]
    	__vfs_write+0x1b [kernel]
    	vfs_write+0xb8 [kernel]
    	sys_write+0x55 [kernel]
    	do_syscall_64+0x73 [kernel]
    	entry_SYSCALL_64_after_hwframe+0x3d [kernel]
    	__write_nocancel+0x7 [libc-2.23.so]
    	[unknown]
Udev rules change quite rarely and usually this happens under control. So we see that even the use of already set values causes a surge in the delay in transmitting the request from the application to the disk. Of course, to generate udev events when there are no changes in the disk configuration (for example, the device does not connect / disconnect) is not a good practice. However, we can help the kernel not do useless work and not freeze the request queue if this is not necessary. Three small commits correct the situation.
Conclusion
eBPF is a very flexible and powerful tool. In the article, we examined one practical case and demonstrated a small part of what is possible to do. If you are interested in developing BCC utilities, you should take a look at the official tutorial , which describes the basics well.
There are other interesting debugging and profiling tools based on eBPF. One of them is bpftrace , which allows you to write powerful single-line and small programs in awk-like language. Another one - ebpf_exporter , allows you to collect low-level high-resolution metrics directly into your prometheus server, with the ability to get beautiful visualization and even alerts in the future.