Redirecting printf () from STM32 to Qt Creator console
Often, when debugging a microcontroller software, it is necessary to display debug messages, logs, captured data and other things on the PC screen. At the same time, it would be desirable for the output to be faster, and for the lines to be displayed not anywhere, but directly in the IDE - without departing from the code, so to speak. Actually, this is the article - as I tried to printf () display and display inside my favorite, but not very microcontroller, Qt Creator environment.
In general, you can think of a huge number of ways to display textual information from the microcontroller. However, the most frequently used techniques are not so many:
- Semihosting
- Segger RTT
- USB-CDC
- UART
- ITM
Semihosting - rather slow, RTT - tied to Segger hardware and software solutions, USB - is not in every microcontroller. Therefore, usually, I prefer the last two - the use of UART and ITM. About them and will be discussed below.
And immediately some explanation on the software that will be used later. As an OS, I now have Fedora 28, and the current bundle of software for working with microcontrollers are:
- Qt Creator 4.8.1 (direct link to releases, pretty carefully hidden on the site)
- GNU Arm Embedded Toolchain 7
- OpenOCD 0.10.0 + dev
Redirect printf () to GCC
So, in order to redirect the output of printf () to GCC, you need to add to the linker keys
-specs=nosys.specs -specs=nano.specsIf you need to output floating-point numbers, then you need to not forget the key
-u_printf_floatAnd implement the _write () function. For example, something like this
int _write(int fd, char* ptr, int len)
{
    (void)fd;
    int i = 0;
    while (ptr[i] && (i < len)) {
        retarget_put_char((int)ptr[i]);
        if (ptr[i] == '\n') {
            retarget_put_char((int)'\r');
        }
        i++;
    }
    return len;
}
where retarget_put_char () is a function that will load the symbol directly into the desired interface.
printf () -> ITM -> Qt Creator
Instrumentation Trace Macrocell (ITM) is a block inside the Cortex-M3 / M4 / M7 core used for non-invasive output (tracing) of various types of diagnostic information. To implement printf () about ITM, you need to know the following:
- Uses the clock signal TRACECLKIN, the frequency of which is usually equal to the frequency of the core
- Has 32 pieces of so-called stimulus ports for data output
- CMSIS incorporates the ITM_SendChar () function, which loads a symbol into the stimulus port 0
- Data is output to the outside either via a synchronous bus (TRACEDATA, TRACECLK) or via an asynchronous single-wire line SWO (TRACESWO)
- The SWO line is usually multiplexed with JTDO, which means it only works in debug mode via SWD
- SWO output is carried out either using the Manchester code or NRZ (UART 8N1)
- The data is transmitted by frames of a specific format - you need a parser on the receiving side
- ITM is usually configured from the IDE or the corresponding utility (however, no one forbids setting it up in the program code - then the output in SWO will work without a raised debugging session)
The most convenient way to use ITM is to output via SWO using NRZ coding - thus, only one line is needed, and data can be received not only with a debugger with a special input, but also with a standard USB-UART adapter, albeit at a lower speed.
I followed the path using the debugger, and had to modify my Chinese STLink-V2 so that it would support SWO. Then everything is simple - we connect the JTDO / TRACESWO microcontroller to the corresponding pin of the debugger, and go to set up the software.
In openocd there is a command "tpiu config" - with the help of it you can configure the way of displaying trace information (in more detail in the OpenOCD User's Guide ). So for example, using arguments
tpiu config internal /home/esynr3z/itm.fifo uart off 168000000adjusts the output to the /home/esynr3z/itm.fifo file, using NRZ coding, and calculates the maximum transmission rate based on the TRACECLKIN frequency of 168 MHz - for STLink it is 2 MHz. And one more team
itm port 0 1will enable zero port for data transfer.
The OpenOCD source code includes the itmdump utility (contrib / itmdump.c) - it can be used to parse strings from the received data.
To compile we enter
gcc itmdump.c -o itmdumpWhen starting, specify the necessary file / pipe / ttyUSB * and the -d1 switch in order to output the received data bytes as strings
./itmdump -f /home/esynr3z/itm.fifo -d1And the last. To send a symbol via SWO, we supplement the _write () described above with the function
int retarget_put_char(int ch)
{
ITM_SendChar((uint32_t)ch);
return 0;
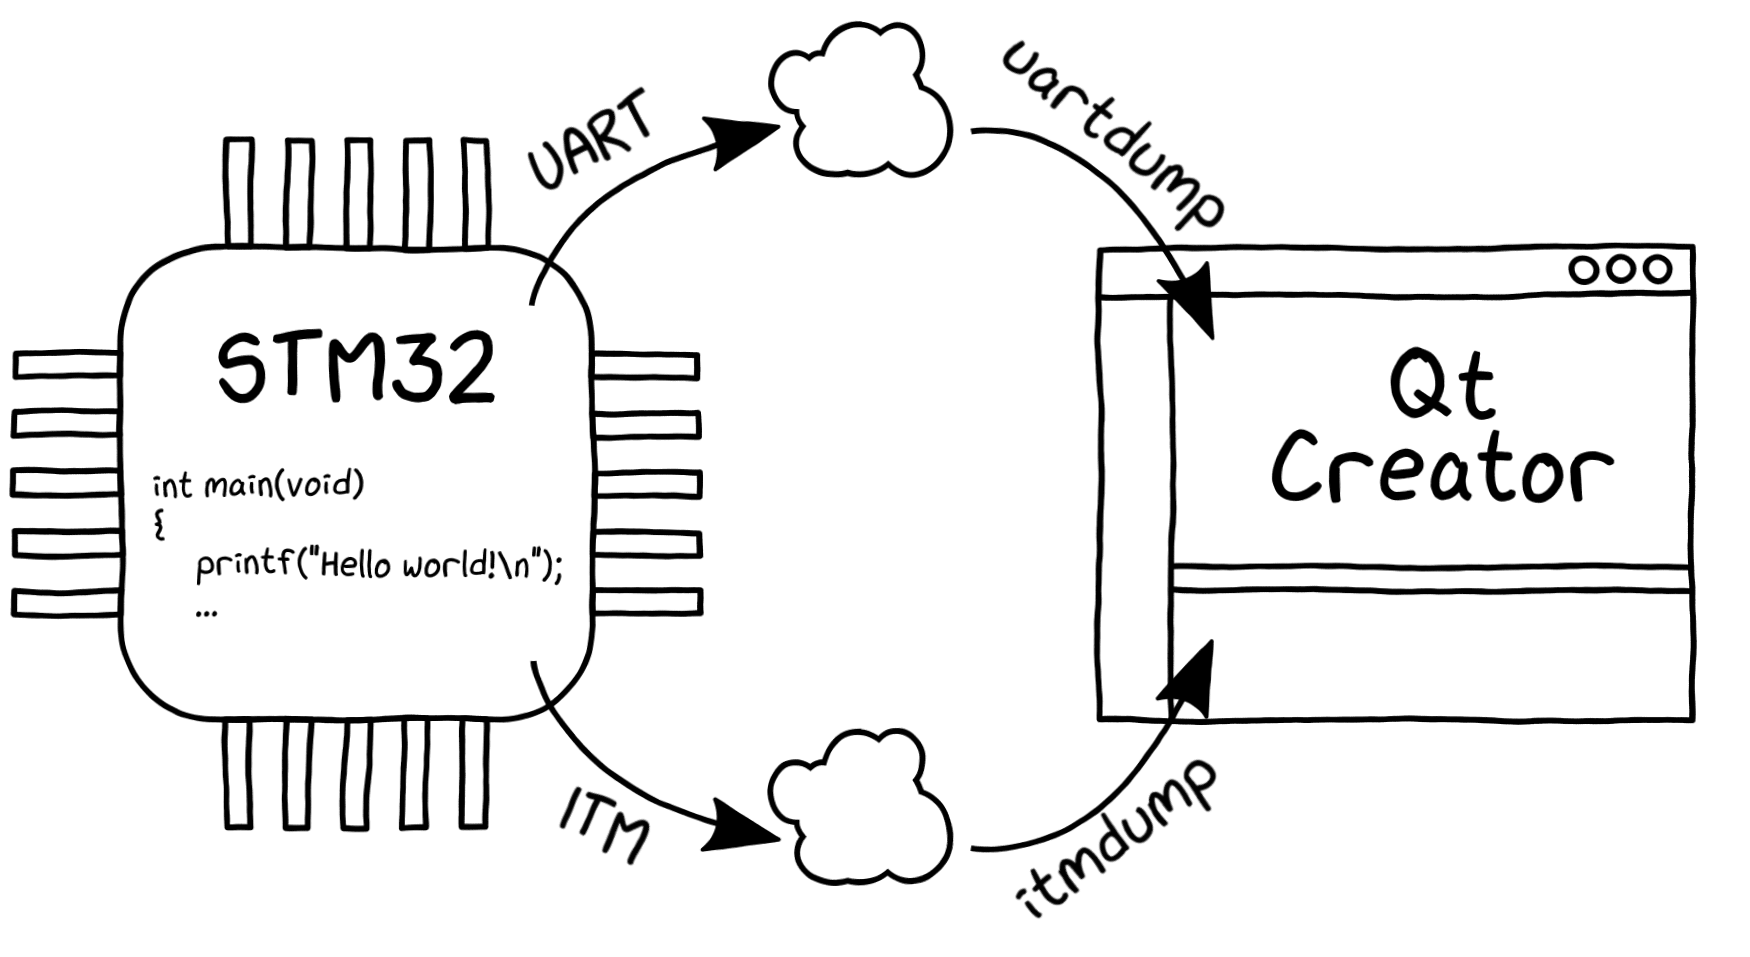
}So, the general plan is this: inside Qt Creator, we configure openocd to save all the received information on SWO into a previously created named pipe, and read the pipe, parse strings and display to the screen using itmdump, running as an External Tool. Of course, there is a more elegant way to solve the task - to write the appropriate plugin for Qt Creator. However, I hope that the approach described below will be useful to someone.
Go to the Bare Metal plugin settings (Tools-> Options-> Devices-> Bare Metal).
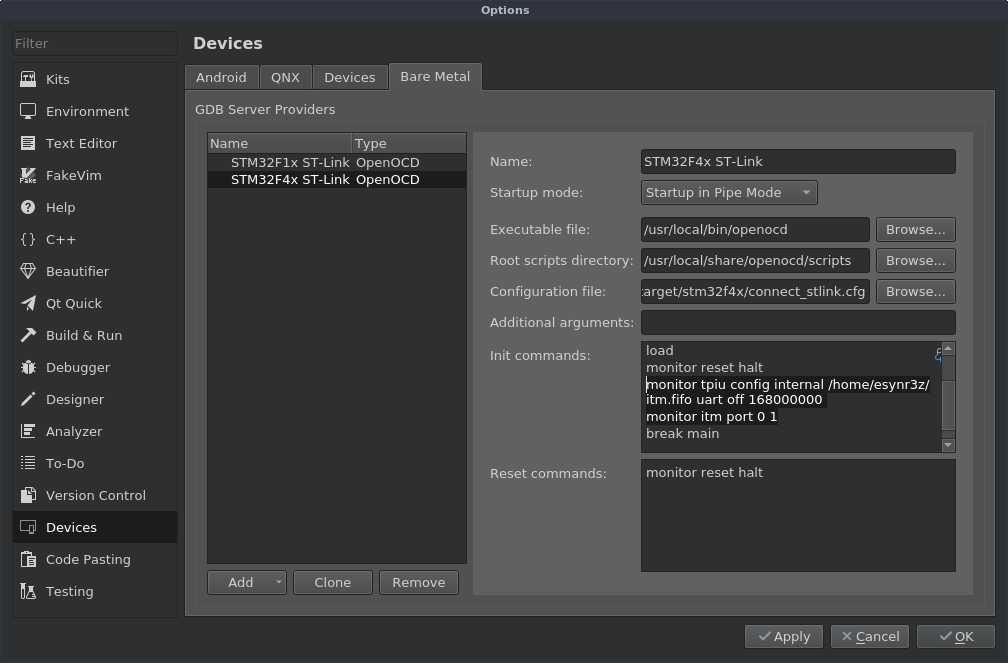
Select the used GDB server and add the line to the end of the list of commands for initialization
monitor tpiu config internal /home/esynr3z/itm.fifo uart off 168000000
monitor itm port 0 1
Now, just before the debugger puts the cursor at the very beginning of main (), the ITM setting will occur.
Add itmdump as External Tool (Tools-> External-> Configure ...).
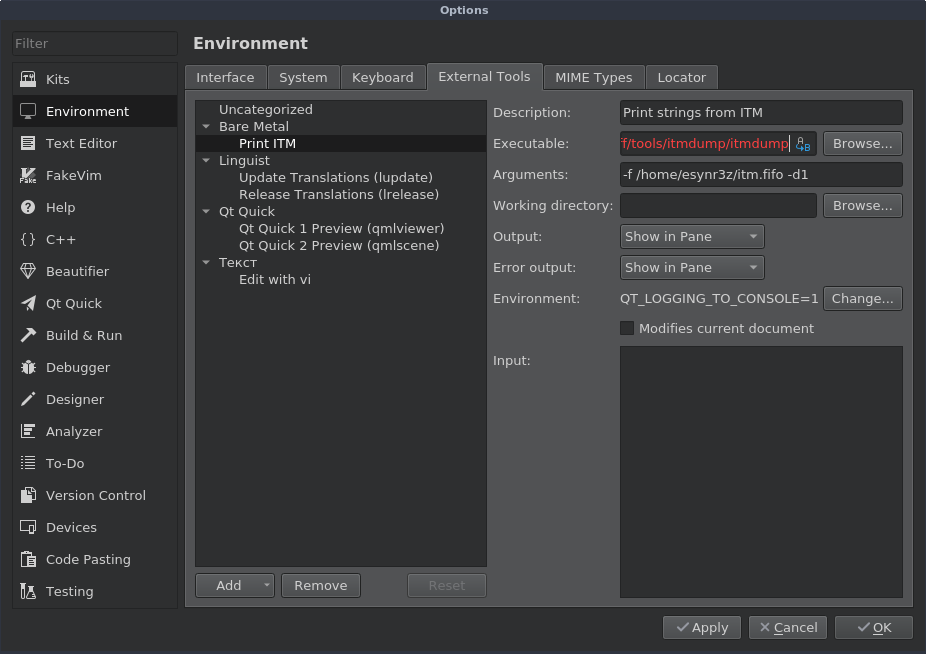
Do not forget to set the variable
QT_LOGGING_TO_CONSOLE=1to display the utility output in the Qt Creator console (7 General Messages panel).
Now turn on itmdump, activate debug mode, start code execution and ... nothing happens. However, if you interrupt debugging, the execution of itmdump will end, and all lines output via printf () will appear on the General Messages tab.
By a brief survey, it was found that the lines from itmdump must be buffered and output to stderr - then they appear in the console interactively, while debugging the program. I uploaded a modified version of itmdump to GitHub .
There is another nuance. Debugging at startup will hang on executing the "monitor tpiu config ..." command, unless itmdump is running. This happens because opening a pipe (/home/esynr3z/itm.fifo) inside openocd is write-blocking, and the debager will hang until pipe opens to read from the other end.
This is somewhat unpleasant, especially if at some point ITM is not needed, but you have to idle itmdump or constantly switch the GDB server or delete / add lines in its settings. Therefore it was necessary to pick openocd sources a little and find the place where you need to substitute a small crutch.
In the src / target / armv7m_trace.c file there is a line with the required opening procedure
armv7m->trace_config.trace_file = fopen(CMD_ARGV[cmd_idx], "ab");it needs to be replaced by
int fd = open(CMD_ARGV[cmd_idx], O_CREAT | O_RDWR, 0664);
armv7m->trace_config.trace_file = fdopen(fd, "ab");
Now our pipe will open immediately and not shine. So you can leave the Bare Metal settings alone, and itmdump only run when it is needed.
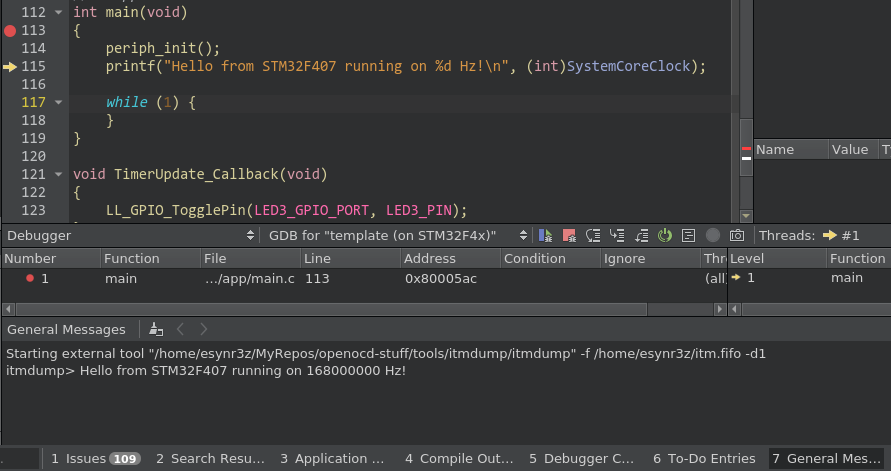
In summary, the output of messages during debugging looks like
printf () -> UART -> Qt Creator
In this case, everything is about the same:
- Add a UART initialization function to the code
- Implement retarget_put_char () where the character will be sent to the transceiver buffer
- We connect USB-UART adapter
- Add a utility to External Tools that will read lines from a virtual COM port and display them on the screen.
I have sketched such a utility on C - uartdump . The use is quite simple - you only need to specify the port name and baudrate.
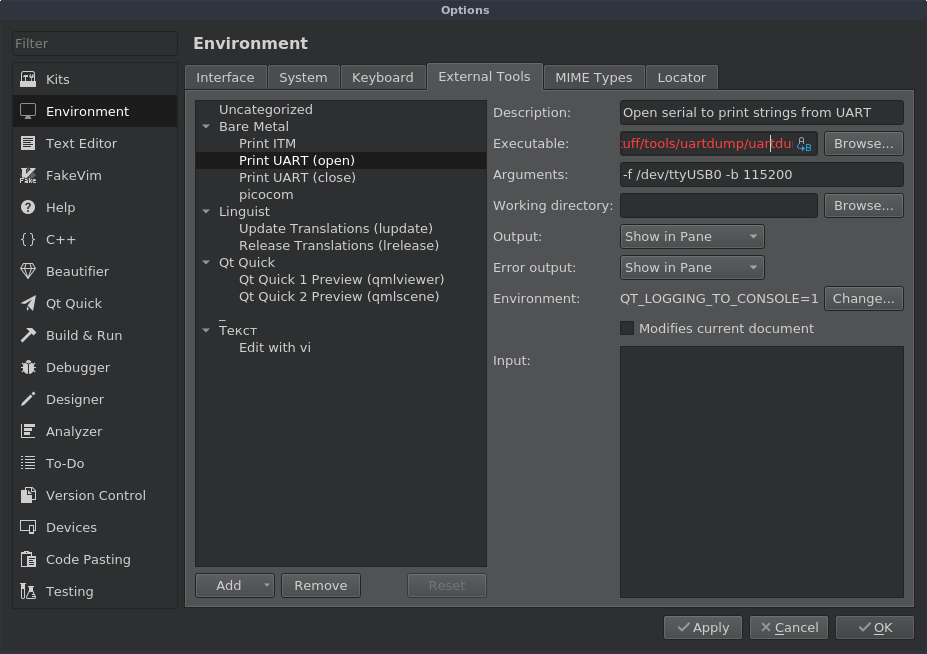
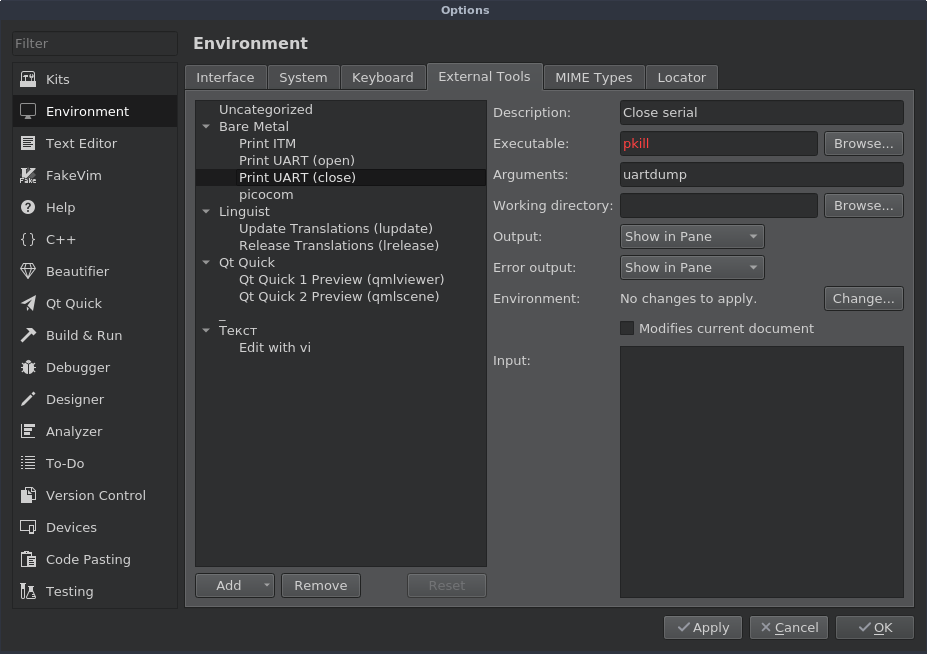
However, it is worth noting one feature. The operation of this utility does not depend on debugging, and Qt Creator does not offer any options for closing running External Tools. Therefore, to stop reading the COM port, I added another external tool.
Well and just in case I will attach the link to the CMake template of the project which appeared on screenshots - GitHub .