LogRock: Testing through Logging
- Tutorial

LogRock: Testing through Logging
For over 2 years we have been working on our Cleverbrush project . This is a software for working with vector graphics. Working with a graphical editor implies a huge number of application use cases. We are trying to save money and time, so we optimize everything, including testing. Covering the test cases with each option is too expensive and irrational, especially since it is impossible to cover all the options.
During development, a module for React JS applications was created - LogRock (github) .
This module allows you to organize modern logging applications. Based on the logs, we perform testing. In this article I will tell you about the intricacies of using this module and how to organize testing through logging.
What is the problem?
If you compare the program with a living organism, then a bug in it is a disease. The cause of this "disease" may be a number of factors, including the environment of a particular user. This is especially true if we are considering a web platform. Sometimes a causal relationship is very complex, and the bug that was found during testing is the result of a number of events.
As with human ailments, no one will explain their symptoms better than the patient, no tester will be able to tell what happened, better than the program itself.
What to do?
To understand what is happening, we need a list of actions that the user performed in our application.
So that our program itself can tell us what it “hurts”, we will take the LogRock module (github) and associate it with ElasticSearch, LogStash and Kibana.
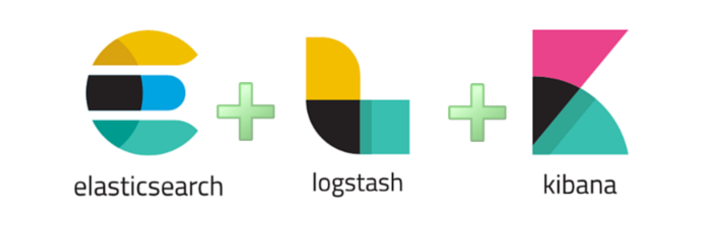
ElasticSearch is a powerful full-text search engine. You can watch ElasticSearch tutorial here .
LogStash is a system for collecting logs from various sources, which can send logs, including to ElasticSearch.
Kibana is a web interface to ElasticSearch with many add-ons.
How it works?

In case of an error (or just on demand), the application sends logs to the server where they are saved to a file. Logstash incrementally saves data in ElasticSearch - to the database. The user logs into Kibana and sees the saved logs.

It looks like a well-tuned Kibana. It displays data from ElasticSearch. Kibana can display data in the form of tables, graphs, maps, etc., which is very convenient for analyzing and understanding what is happening with our application.
In this article, I will NOT discuss setting up ElasticStack!
Creating a logging system
As an example, we will integrate the logging system in a one-page JS application written in React. It really doesn’t matter which framework your application will be written on. I will try to describe the approach of building a log system itself.
1. Customer
1.0 LogRock. Installation
Link to LogRock
To install, you must do:
npm install logrock
или
yarn add logrock
1.1 LogRock. Application setup
To get started, wrap our application in a component
import { LoggerContainer } from "logrock";
LoggerContainer is a component that responds to your application errors and forms a stack.
A stack is an object with information about the user's operating system, browser, which mouse or keyboard button was pressed and, of course, the actions subarray, where all the user actions that he performed in our system are recorded.
LoggerContainer has a number of settings, consider some of them
 {
        sendToServer(stack);
    }}
>
active - enables or disables the
limit logger - sets a limit on the number of recent user actions to save. If the user performs 21 actions, the first in this array will automatically be deleted. Thus, we will have the last 20 actions that preceded the error.
onError - the callback that is called when an error occurs. The Stack object comes into it, in which all information about the environment, user actions, etc. is stored. It is from this callback that we need to send this data to ElasticSearch or the backend, or save it to a file for further analysis and monitoring.
1.2 LogRock. Logging
In order to make high-quality logging of user actions, we will have to cover our code with log-calls.
The LogRock module comes with a logger that is associated with a LoggerContainer.
Suppose we have a component
import React, { useState } from "react"; export default function Toggle(props) { const [toggleState, setToggleState] = useState("off"); function toggle() { setToggleState(toggleState === "off" ? "on" : "off"); } return; }
In order to properly cover it with a log, we need to modify the toggle method
function toggle() {
    let state = toggleState === "off" ? "on" : "off";
    logger.info(`React.Toggle|Toggle component changed state ${state}`);
    setToggleState(state);
}
We have added a logger in which information is divided into 2 parts. React.Toggle shows us that this action occurred at the level of React, the Toggle component, and then we have a verbal explanation of the action and the current state that came to this component. Such a separation into levels is not necessary, but with this approach it will be clearer where exactly our code was executed.
We can also use the “componentDidCatch” method, which was introduced in React version 16, in case of an error.
2. Server interaction
Consider the following example.
Suppose we have a method that collects user data from a backend. The method is asynchronous, part of the logic is hidden in the backend. How to log this code correctly?
Firstly, since we have a client application, all requests going to the server will go through a single user session, without reloading the page. In order to associate actions on the client with actions on the server, we must create a global SessionID and add it to the header to each request to the server. On the server, we can use any logger that will cover our logic like an example from the frontend, and in case of an error send this data with the attached sessionID in Elastic to the Backend plate.
1. We generate SessionID on the client
window.SESSION_ID = `sessionid-${Math.random().toString(36).substr(3, 9)}`;2. We must set the SessionID for all requests to the server. If we use libraries for queries, this is very simple by declaring a SessionID for all queries.
let fetch = axios.create({...});
fetch.defaults.headers.common.sessionId = window.SESSION_ID;
3. In LoggerContainer there is a special field for SessionID
 {
        sendToServer(stack);
    }}
>
4. The request itself (on the client) will look like this:
logger.info(`store.getData|User is ready for loading... User ID is ${id}`);
getData('/api/v1/user', { id })
    .then(userData => {
        logger.info(`store.getData|User have already loaded. User count is ${JSON.stringify(userData)}`);
    })
    .catch(err => {
        logger.error(`store.getData|User loaded fail ${err.message}`);
    });
How it all will work: we log a log, before the request on the client. According to our code, we see that loading of data from the server will now begin. We have attached a SessionID to the request. If our backend is covered with logs with the addition of this SessionID and the request fails, then we can see what happened on the backend.
Thus, we monitor the entire cycle of our application, not only on the client, but also on the backend.
3. The tester
Working with a tester deserves a separate description of the process.
Since we have a startup, we do not have formal requirements and sometimes everything is not logical in work.
If the tester does not understand the behavior, this is a case that at least needs to be considered. Also, often, a tester simply cannot repeat one situation twice. Since the steps leading to incorrect behavior can be numerous and non-trivial. Moreover, not all errors lead to critical consequences, such as Exception. Some of them can only change the behavior of the application, but not be interpreted by the system as an error. For these purposes, on staging, you can add a button in the application header to force the sending of logs. The tester sees that something is not working right, clicks on the button and sends the Stack with actions to ElasticSearch.
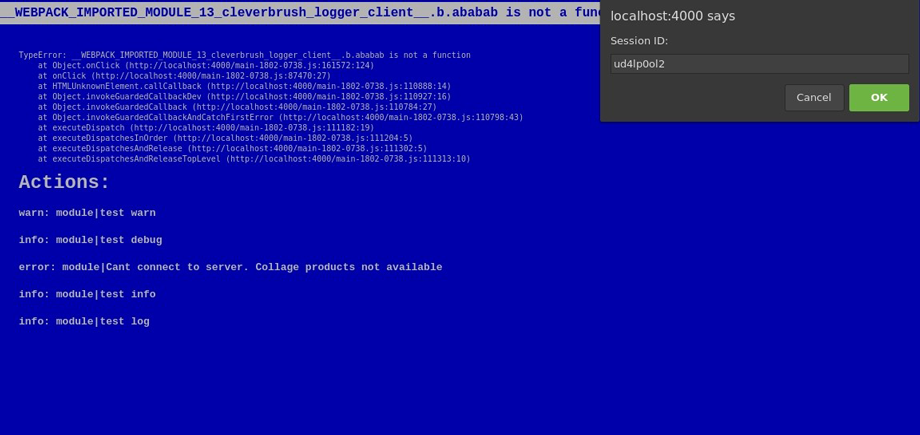
If, nevertheless, a critical error has occurred, we must block the interface so that the tester does not click further and does not go into a dead end.
For these purposes, we display the blue screen of death.
We see at the top the text with Stack of this critical error, and below - the actions that preceded it. We also get the error ID, it’s enough for the tester to select it and attach it to the ticket. Later this error can be easily found in Kibana by this ID.
For these purposes, LoggerContainer has its own properties.
 {
        sendToServer(stack);
    }}
>
bsodActive - enables / disables BSOD (disabling BSOD applies to production code)
bsod is a component. By default, it looks like the above screenshot.
To display a button in a UI LoggerContainer, we can use in context
context.logger.onError(context.logger.getStackData());4. LogRock. User interaction
You can output logs to the console or show them to the user, for this you need to use the stdout method:
 {
        sendToServer(stack);
    }}
    stdout={(level, message, important) => {
          console[level](message);
          if (important) {
              alert(message);
          }
    }}
>
stdout is a method that is responsible for displaying messages.
In order for the message to become important it is enough to pass the second parameter true to the logger. Thus, this message can be displayed to the user in a pop-up window, for example, if the data loading failed, we can display an error message.
logger.log('Something was wrong', true);Advanced logging
If you use Redux, or similar solutions with one Store, you can put a logger in Middleware processing your Actions, thereby, all significant actions will go through our system.
For effective logging, you can wrap your data in a proxy object, and put loggers on all actions with the object.
To cover third-party methods with logging (library methods, Legacy code methods), you can use decorators - “@”.
Advice
Log applications, including on production, because better than real users, no tester will find any bottlenecks.
Do not forget to indicate the collection of logs in the license agreement.
DO NOT log passwords, bank details and other personal information!
Redundancy of logs is also bad, make signatures as clear as possible.
Alternatives
As alternative approaches, I highlight:
- Rollbar is highly customizable. Allows you to log 500 thousand errors for $ 150 per month. I recommend using it if you are developing an application from scratch.
- Sentry is easier to integrate, but less customizable. Allows you to log 1 million events for $ 200 per month.
Both services allow you to do almost the same thing and integrate into the backend.
What's next
Logging is not only the search for errors, it is also monitoring user actions, data collection. Logging can be a good complement to Google Analytics and User Experience testing.
conclusions
When you release the app, life is just beginning for him. Be responsible for your brainchild, get feedback, monitor logs and improve it. Write high-quality software and prosper :)
PS If you want to help with the development of modules for Angular, Vue, etc. I will be glad to pull requests - here .