CPU consumption benchmark for Istio and Linkerd
- Transfer

Introduction
We at Shopify were deploying Istio as a service mesh. In principle, everything suits, except for one thing: it is expensive .
The published benchmarks for Istio say:
With Istio 1.1, the proxy consumes approximately 0.6 vCPUs (virtual cores) per 1000 requests per second.
For the first region in the service mesh (2 proxies on each side of the connection), we will have 1200 cores for proxies only, at the rate of one million requests per second. According to the cost calculator from Google, it turns out about $ 40 / month / core for configuration n1-standard-64, that is, this region alone will cost us more than 50 thousand dollars per month for 1 million requests per second.
Ivan Sim ( Ivan Sim ) clearly compared the service mesh delays last year and promised the same for the memory and processor, but failed:
Apparently, values-istio-test.yaml will seriously increase processor requests. If I calculated everything correctly, you need about 24 processor cores for the control panel and 0.5 CPU for each proxy. I don’t have so much. I will repeat the tests when more resources are allocated to me.
I wanted to see for myself how Istio's performance is similar to another open source service mesh: Linkerd .
Service mesh installation
The first thing I installed in the SuperGloo cluster was :
$ supergloo init
installing supergloo version 0.3.12
using chart uri https://storage.googleapis.com/supergloo-helm/charts/supergloo-0.3.12.tgz
configmap/sidecar-injection-resources created
serviceaccount/supergloo created
serviceaccount/discovery created
serviceaccount/mesh-discovery created
clusterrole.rbac.authorization.k8s.io/discovery created
clusterrole.rbac.authorization.k8s.io/mesh-discovery created
clusterrolebinding.rbac.authorization.k8s.io/supergloo-role-binding created
clusterrolebinding.rbac.authorization.k8s.io/discovery-role-binding created
clusterrolebinding.rbac.authorization.k8s.io/mesh-discovery-role-binding created
deployment.extensions/supergloo created
deployment.extensions/discovery created
deployment.extensions/mesh-discovery created
install successful!
I used SuperGloo because it greatly simplifies the boot of the service mesh. I had almost nothing to do. In production, we do not use SuperGloo, but it is ideal for a similar task. I had to apply just a couple of commands to each service mesh. I used two clusters for isolation - one for Istio and Linkerd.
The experiment was conducted on the Google Kubernetes Engine. I used Kubernetes 1.12.7-gke.7and a node pool n1-standard-4with automatic node scaling (minimum 4, maximum 16).
Then I installed both service mesh from the command line.
Linkerd first:
$ supergloo install linkerd --name linkerd
+---------+--------------+---------+---------------------------+
| INSTALL |     TYPE     | STATUS  |          DETAILS          |
+---------+--------------+---------+---------------------------+
| linkerd | Linkerd Mesh | Pending | enabled: true             |
|         |              |         | version: stable-2.3.0     |
|         |              |         | namespace: linkerd        |
|         |              |         | mtls enabled: true        |
|         |              |         | auto inject enabled: true |
+---------+--------------+---------+---------------------------+
Then Istio:
$ supergloo install istio --name istio --installation-namespace istio-system --mtls=true --auto-inject=true
+---------+------------+---------+---------------------------+
| INSTALL |    TYPE    | STATUS  |          DETAILS          |
+---------+------------+---------+---------------------------+
| istio   | Istio Mesh | Pending | enabled: true             |
|         |            |         | version: 1.0.6            |
|         |            |         | namespace: istio-system   |
|         |            |         | mtls enabled: true        |
|         |            |         | auto inject enabled: true |
|         |            |         | grafana enabled: true     |
|         |            |         | prometheus enabled: true  |
|         |            |         | jaeger enabled: true      |
+---------+------------+---------+---------------------------+
Crash-loop took several minutes, and then the control panels stabilized.
(Note: SuperGloo currently only supports Istio 1.0.x. I repeated the experiment with Istio 1.1.3, but did not notice any noticeable difference.)
Setting up automatic deployment of Istio
For Istio to install the Envoy sidecar, we use the sidecar injector MutatingAdmissionWebhook. We will not talk about him in this article. I can only say that this is a controller that monitors the access of all new pods and dynamically adds a sidecar and initContainer, which is responsible for tasks iptables.
We at Shopify wrote our access controller to implement sidecar, but in this benchmark I took the controller that comes with Istio. The controller injects sidecar by default when there is a shortcut in the namespace istio-injection: enabled:
$ kubectl label namespace irs-client-dev istio-injection=enabled
namespace/irs-client-dev labeled
$ kubectl label namespace irs-server-dev istio-injection=enabled
namespace/irs-server-dev labeled
Configure Linkerd Auto Deployment
To configure the implementation of Linkerd sidecar s, we use annotations (I added them manually via kubectl edit):
metadata:
  annotations:
    linkerd.io/inject: enabled
$ k edit ns irs-server-dev
namespace/irs-server-dev edited
$ k get ns irs-server-dev -o yaml
apiVersion: v1
kind: Namespace
metadata:
annotations:
linkerd.io/inject: enabled
name: irs-server-dev
spec:
finalizers:
- kubernetes
status:
phase: ActiveFault tolerance simulator Istio
We made the Istio fault tolerance simulator to experiment with traffic unique to Shopify. We needed a tool to create an arbitrary topology that would represent a certain part of the graph of our service with dynamic tuning to simulate specific workloads.
Shopify infrastructure is under heavy load during flash sales. At the same time, Shopify recommends that sellers conduct such sales more often . Large customers sometimes warn of a planned flash sale. Others spend them unexpectedly for us at any time of the day or night.
We wanted our fault tolerance simulator to model workflows that match the topologies and workloads that have overloaded Shopify infrastructure in the past. The main goal of using the service mesh is that we need reliability and fault tolerance at the network level, and it is important for us that the service mesh effectively cope with the loads that previously interrupted the operation of services.
The failover simulator is based on a work node that acts as a service mesh node. The work node can be configured statically at startup or dynamically through the REST API. We use dynamic tuning of work nodes to create workflows in the form of regression tests.
Here is an example of such a process:
- We start 10 servers as a
barservice, which returns a response200/OKafter 100 ms. - We launch 10 clients - each sends 100 requests per second to
bar. - Every 10 seconds we remove 1 server, we monitor errors
5xxon the client.
At the end of the workflow, we study the logs and metrics and check if the test passes. This is how we learn about the performance of our service mesh and conduct a regression test to test our assumptions about fault tolerance.
(Note: We are considering opening the source code for the Istio fault tolerance simulator, but we are not ready for it yet.)
Istio fault tolerance simulator for service mesh benchmark
We configure several working nodes of the simulator:
irs-client-loadgen: 3 replicas that send 100 requests per second perirs-client.irs-client: 3 replicas that receive the request wait 100 ms and redirect the request toirs-server.irs-server: 3 replicas that return200/OKafter 100 ms.
With this configuration, we can measure a stable traffic flow between 9 endpoints. Sidecar in irs-client-loadgenand irs-serverreceive 100 requests per second, and irs-client- 200 (incoming and outgoing).
We track resource usage through DataDog because we don’t have a Prometheus cluster.
results
Control panels
First, we examined CPU consumption.

Linkerd Control Panel ~ 22M
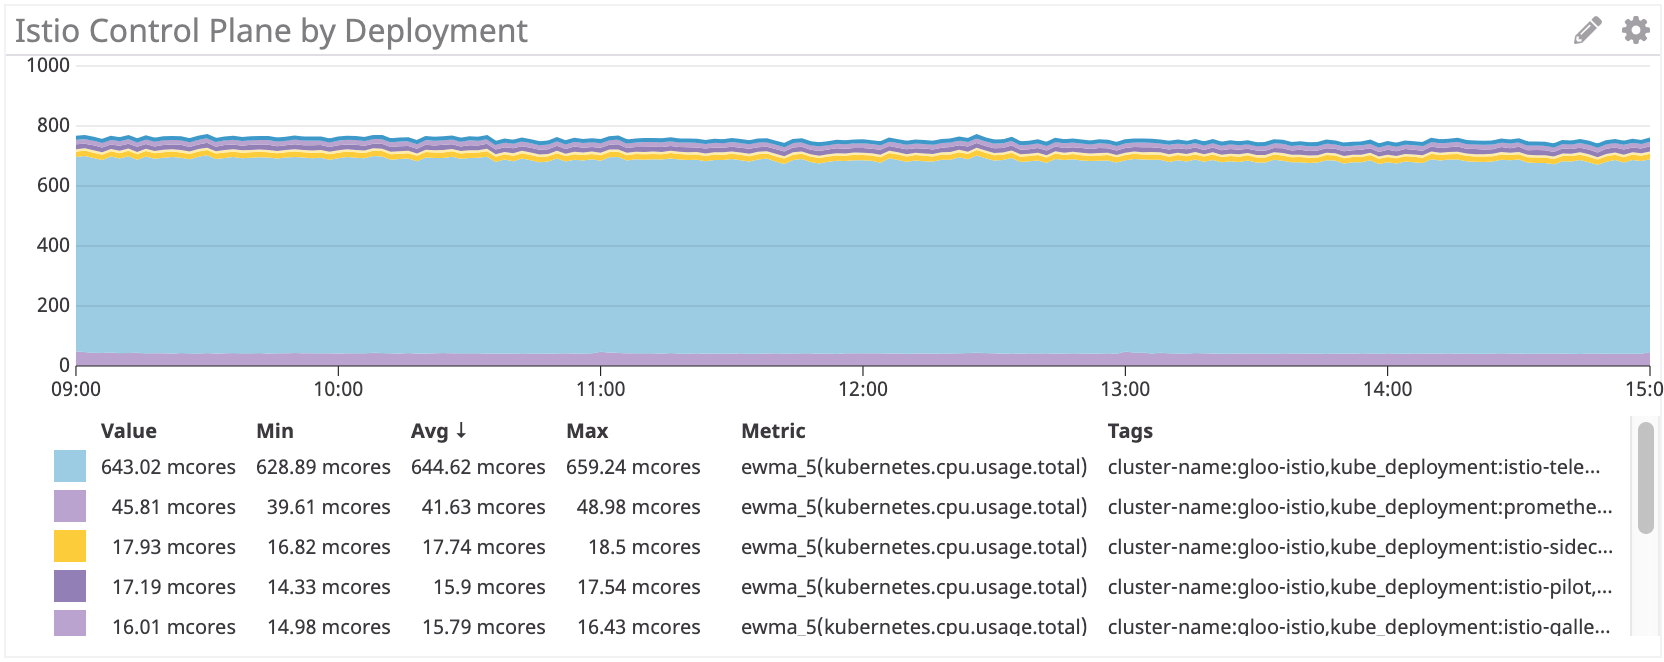
Istio Control Panel: ~ 750 Million Cores
Панель управления Istio использует примерно в 35 раз больше процессорных ресурсов, чем Linkerd. Конечно, все поставлено по-умолчанию, и много процессорных ресурсов здесь потребляет istio-telemetry (его можно отключить, отказавшись от некоторых функций). Если убрать этот компонент, все равно получается больше 100 миллиядер, то есть в 4 раза больше, чем у Linkerd.
Sidecar прокси
Затем мы проверили использование прокси. Тут должна быть линейная зависимость от количества запросов, но для каждого sidecar-а есть некоторые накладные расходы, которые влияют на кривую.

Linkerd: ~100 миллиядер для irs-client, ~50 миллиядер для irs-client-loadgen
Результаты выглядят логично, ведь прокси client получает в два раза больше трафика, чем прокси loadgen: на каждый исходящий запрос от loadgen у client приходится один входящий и один исходящий.
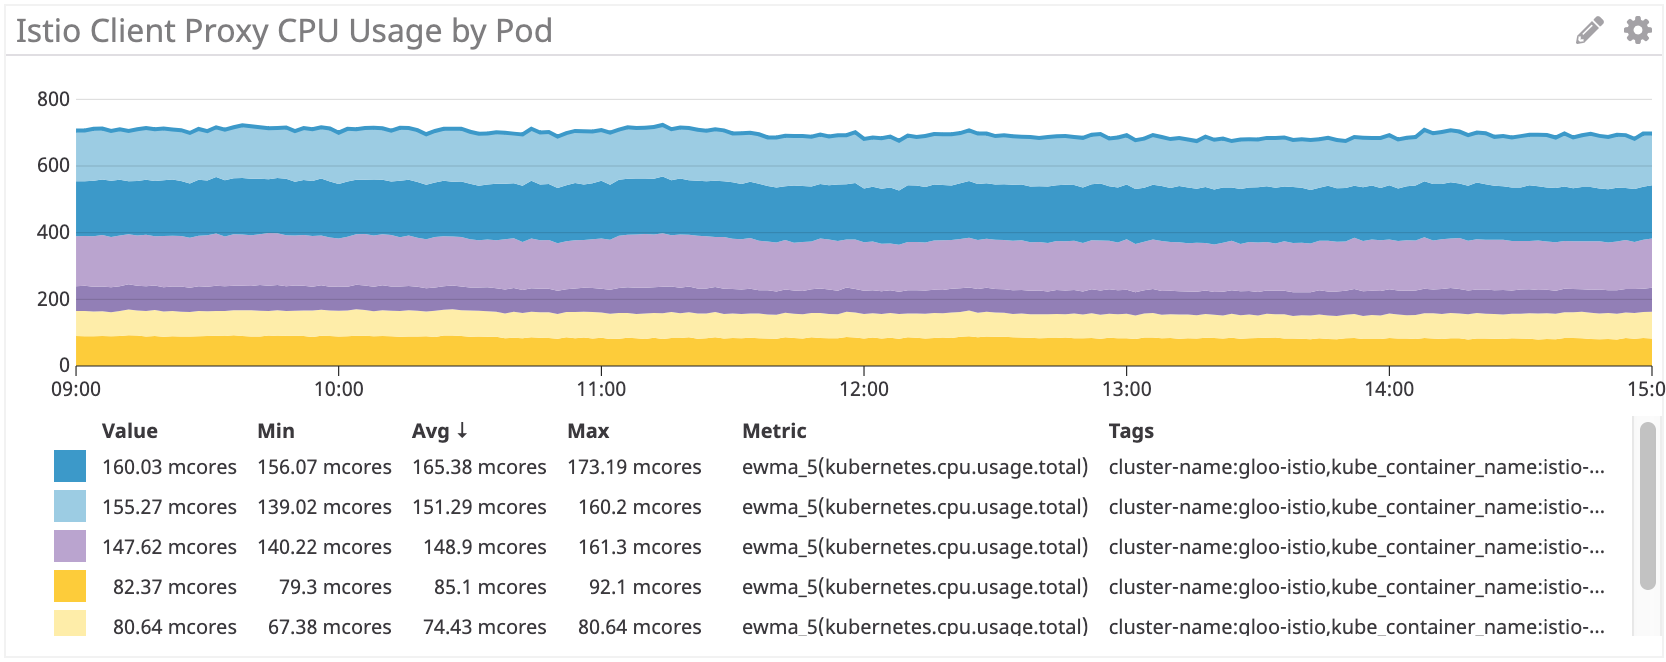
Istio/Envoy: ~155 миллиядер для irs-client, ~75 миллиядер для irs-client-loadgen
Мы видим похожие результаты для sidecar-ов Istio.
Но в целом прокси Istio/Envoy потребляют примерно на 50% больше процессорных ресурсов, чем Linkerd.
Ту же схему мы видим на стороне сервера:
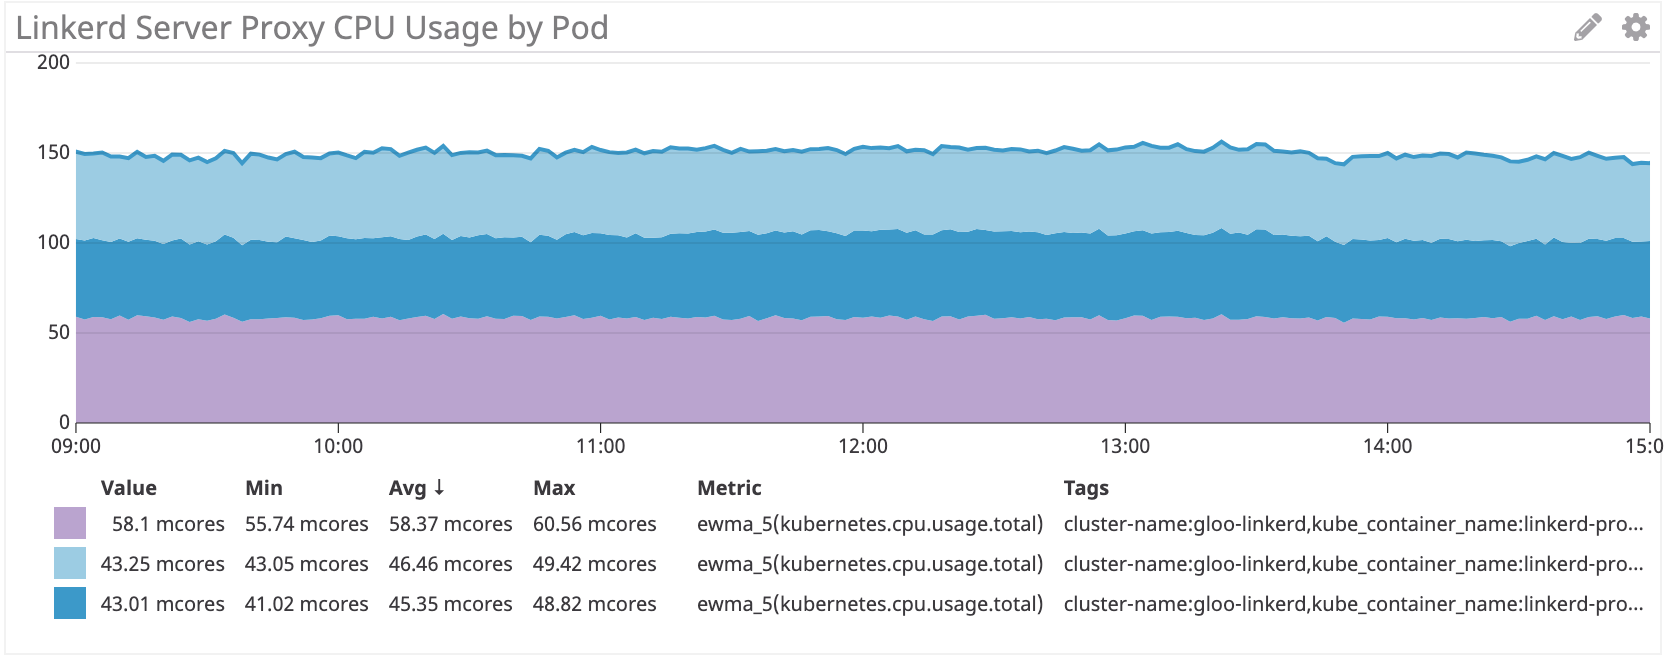
Linkerd: ~50 миллиядер для irs-server
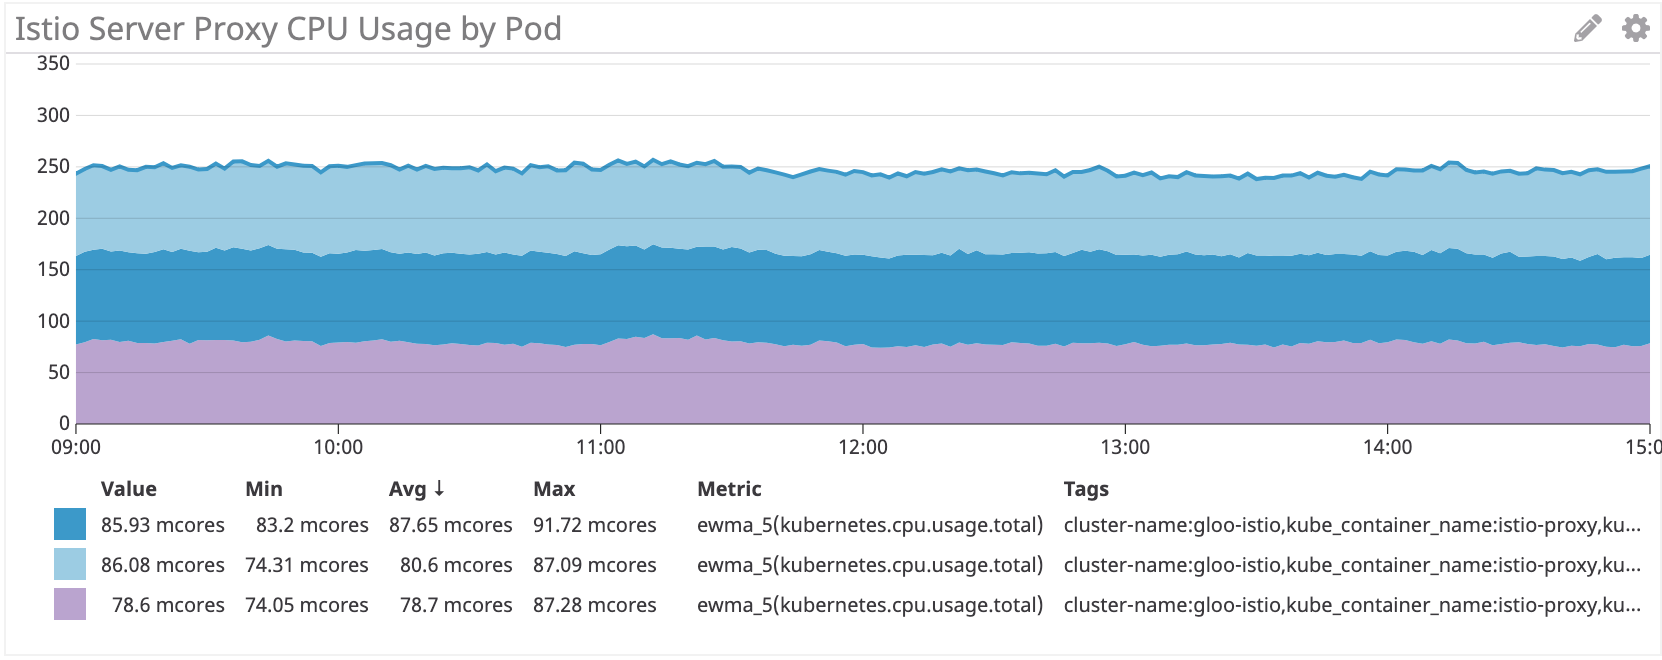
Istio/Envoy: ~80 миллиядер для irs-server
На стороне сервера sidecar Istio/Envoy потребляет примерно на 60% больше процессорных ресурсов, чем Linkerd.
Заключение
The Istio Envoy proxy consumes 50 +% more CPU than Linkerd on our simulated workload. Linkerd control panel consumes much less resources than Istio, especially for the main components.
We are still thinking about how to reduce these costs. If you have any ideas, share!