Performance tuning and database troubleshooting these days
Unfortunately, now the role of specialists in Performance tuning and database troubleshooting is being cut down only to the last - troubleshooting: they almost always turn to specialists only when problems have already reached a critical point, and they need to be solved “yesterday”. And even then it’s good if they turn, and do not delay the problem by buying an even more expensive and powerful hardware without a detailed performance audit and stress tests. Indeed, frustrations are often enough: they bought equipment worth 2-5 times more expensive, and won only 30-40% in performance, the whole increase from which is eaten up in a few months either by an increase in the number of users, or by an exponential increase in data, coupled with a complication of logic.
And now, at a time when the number of architects, testers and DevOps engineers is growing rapidly, and Java Core developers are optimizing even work with strings , slowly but surely the time is coming for database optimizers. DBMSs with each release become so smarter and more complex that studying both documented and undocumented nuances and optimizations requires a huge amount of time. A huge number of articles are published monthly and major conferences devoted to Oracle are held. Sorry for the banal analogy, but in this situation, when database administrators become similar to airplane pilots with countless toggle switches, buttons, lights and screens, it is already indecent to load them with the subtleties of performance optimization.
Of course, DBA, like pilots, in most cases can easily solve obvious and simple problems when they are either easily diagnosed or noticeable in various “tops” (Top events, top SQL, top segments ...). And which are easy to find on MOS or Google, even if they don’t know the solution. It is much more complicated when even the symptoms are hidden behind the complexity of the system and they need to be fished out among the huge amount of diagnostic information collected by the Oracle DBMS itself.
One of the simplest and most vivid such examples is the analysis of filter and access predicts: in large and loaded systems, it often happens that such a problem is easily overlooked, because the load is fairly evenly spread over different requests (with joins for various tables, with slight differences in conditions, etc.), and the top segments do not show anything special, they say, “well, yes, from these tables the data is most often needed and there is more” . In such cases, you can start the analysis with statistics from SYS.COL_USAGE $: col_usage.sql
However, for a full analysis of this information is not enough, because it does not show combinations of predicates. In this case, analysis of v $ active_session_history and v $ sql_plan can help us:
As you can see from the query itself, it displays the top 50 search columns and the predicates themselves by the number of times ASH hits in the last 3 hours. Despite the fact that ASH only stores snapshots every second, sampling at loaded bases is very representative. It can clarify several points:
Depending on the need, this script can be easily modified to collect additional information in other sections, for example, taking into account partitioning or expectations. And having already analyzed this information, coupled with the analysis of table statistics and its indexes, the general data scheme and business logic, you can pass recommendations to developers or architects to choose a solution, for example: options for denormalization or changing the partitioning scheme or indexes.
It is also quite often forgotten to analyze SQL * net traffic, and there are also many subtleties, for example: fetch-size, SQLNET.COMPRESSION, extended datatypes, which allow reducing the number of roundtripes, etc., but this is a topic for a separate article.
In conclusion, I would like to say that now that users are becoming less tolerant of delays, optimizing performance is becoming a competitive advantage.
And now, at a time when the number of architects, testers and DevOps engineers is growing rapidly, and Java Core developers are optimizing even work with strings , slowly but surely the time is coming for database optimizers. DBMSs with each release become so smarter and more complex that studying both documented and undocumented nuances and optimizations requires a huge amount of time. A huge number of articles are published monthly and major conferences devoted to Oracle are held. Sorry for the banal analogy, but in this situation, when database administrators become similar to airplane pilots with countless toggle switches, buttons, lights and screens, it is already indecent to load them with the subtleties of performance optimization.
Of course, DBA, like pilots, in most cases can easily solve obvious and simple problems when they are either easily diagnosed or noticeable in various “tops” (Top events, top SQL, top segments ...). And which are easy to find on MOS or Google, even if they don’t know the solution. It is much more complicated when even the symptoms are hidden behind the complexity of the system and they need to be fished out among the huge amount of diagnostic information collected by the Oracle DBMS itself.
One of the simplest and most vivid such examples is the analysis of filter and access predicts: in large and loaded systems, it often happens that such a problem is easily overlooked, because the load is fairly evenly spread over different requests (with joins for various tables, with slight differences in conditions, etc.), and the top segments do not show anything special, they say, “well, yes, from these tables the data is most often needed and there is more” . In such cases, you can start the analysis with statistics from SYS.COL_USAGE $: col_usage.sql
col owner format a30
col oname format a30 heading "Object name"
col cname format a30 heading "Column name"
accept owner_mask prompt "Enter owner mask: ";
accept tab_name prompt "Enter tab_name mask: ";
accept col_name prompt "Enter col_name mask: ";
SELECT a.username              as owner
      ,o.name                  as oname
      ,c.name                  as cname
      ,u.equality_preds        as equality_preds
      ,u.equijoin_preds        as equijoin_preds
      ,u.nonequijoin_preds     as nonequijoin_preds
      ,u.range_preds           as range_preds
      ,u.like_preds            as like_preds
      ,u.null_preds            as null_preds
      ,to_char(u.timestamp, 'yyyy-mm-dd hh24:mi:ss') when
FROM
       sys.col_usage$ u
     , sys.obj$       o
     , sys.col$       c
     , all_users      a
WHERE  a.user_id = o.owner#
AND    u.obj#    = o.obj#
AND    u.obj#    = c.obj#
AND    u.intcol# = c.col#
AND    a.username like upper('&owner_mask')
AND    o.name     like upper('&tab_name')
AND    c.name     like upper('&col_name')
ORDER  BY a.username, o.name, c.name
;
col owner clear;
col oname clear;
col cname clear;
undef tab_name col_name owner_mask;
However, for a full analysis of this information is not enough, because it does not show combinations of predicates. In this case, analysis of v $ active_session_history and v $ sql_plan can help us:
with
 ash as (
   select
      sql_id
     ,plan_hash_value
     ,table_name
     ,alias
     ,ACCESS_PREDICATES
     ,FILTER_PREDICATES
     ,count(*) cnt
   from (
      select
         h.sql_id
        ,h.SQL_PLAN_HASH_VALUE plan_hash_value
        ,decode(p.OPERATION
                 ,'TABLE ACCESS',p.OBJECT_OWNER||'.'||p.OBJECT_NAME
                 ,(select i.TABLE_OWNER||'.'||i.TABLE_NAME from dba_indexes i where i.OWNER=p.OBJECT_OWNER and i.index_name=p.OBJECT_NAME)
               ) table_name
        ,OBJECT_ALIAS ALIAS
        ,p.ACCESS_PREDICATES
        ,p.FILTER_PREDICATES
      -- поля, которые могут быть полезны для анализа в других разрезах:
      --  ,h.sql_plan_operation
      --  ,h.sql_plan_options
      --  ,decode(h.session_state,'ON CPU','ON CPU',h.event) event
      --  ,h.current_obj#
      from v$active_session_history h
          ,v$sql_plan p
      where h.sql_opname='SELECT'
        and h.IN_SQL_EXECUTION='Y'
        and h.sql_plan_operation in ('INDEX','TABLE ACCESS')
        and p.SQL_ID = h.sql_id
        and p.CHILD_NUMBER = h.SQL_CHILD_NUMBER
        and p.ID = h.SQL_PLAN_LINE_ID
        -- если захотим за последние 3 часа:
        -- and h.sample_time >= systimestamp - interval '3' hour
   )
   -- если захотим анализируем предикаты только одной таблицы:
   -- where table_name='&OWNER.&TABNAME'
   group by
      sql_id
     ,plan_hash_value
     ,table_name
     ,alias
     ,ACCESS_PREDICATES
     ,FILTER_PREDICATES
)
,agg_by_alias as (
   select
      table_name
     ,regexp_substr(ALIAS,'^[^@]+') ALIAS
     ,listagg(ACCESS_PREDICATES,' ') within group(order by ACCESS_PREDICATES) ACCESS_PREDICATES
     ,listagg(FILTER_PREDICATES,' ') within group(order by FILTER_PREDICATES) FILTER_PREDICATES
     ,sum(cnt) cnt
   from ash
   group by
      sql_id
     ,plan_hash_value
     ,table_name
     ,alias
)
,agg as (
   select
       table_name
      ,'ALIAS' alias
      ,replace(access_predicates,'"'||alias||'".','"ALIAS".') access_predicates
      ,replace(filter_predicates,'"'||alias||'".','"ALIAS".') filter_predicates
      ,sum(cnt) cnt
   from agg_by_alias
   group by
       table_name
      ,replace(access_predicates,'"'||alias||'".','"ALIAS".')
      ,replace(filter_predicates,'"'||alias||'".','"ALIAS".')
)
,cols as (
   select
       table_name
      ,cols
      ,access_predicates
      ,filter_predicates
      ,sum(cnt)over(partition by table_name,cols) total_by_cols
      ,cnt
   from agg
       ,xmltable(
          'string-join(for $c in /ROWSET/ROW/COL order by $c return $c,",")'
          passing
             xmltype(
                cursor(
                   (select distinct
                       nvl(
                       regexp_substr(
                          access_predicates||' '||filter_predicates
                         ,'("'||alias||'"\.|[^.]|^)"([A-Z0-9#_$]+)"([^.]|$)'
                         ,1
                         ,level
                         ,'i',2
                       ),' ')
                       col
                    from dual
                    connect by
                       level<=regexp_count(
                                 access_predicates||' '||filter_predicates
                                ,'("'||alias||'"\.|[^.]|^)"([A-Z0-9#_$]+)"([^.]|$)'
                              )
                   )
               ))
          columns cols varchar2(400) path '.'
       )(+)
   order by total_by_cols desc, table_name, cnt desc
)
select
   table_name
  ,cols
  ,sum(cnt)over(partition by table_name,cols) total_by_cols
  ,access_predicates
  ,filter_predicates
  ,cnt
from cols
where rownum<=50
order by total_by_cols desc, table_name, cnt desc;
As you can see from the query itself, it displays the top 50 search columns and the predicates themselves by the number of times ASH hits in the last 3 hours. Despite the fact that ASH only stores snapshots every second, sampling at loaded bases is very representative. It can clarify several points:
- The cols field - displays the search columns themselves, and total_by_cols - the sum of the entries in the context of these columns.
- I think it is quite obvious that this information in itself is not a sufficient marker of the problem, because for example, several one-time fullscans can easily ruin the statistics, so you will definitely have to consider the queries themselves and their frequency (v $ sqlstats, dba_hist_sqlstat)
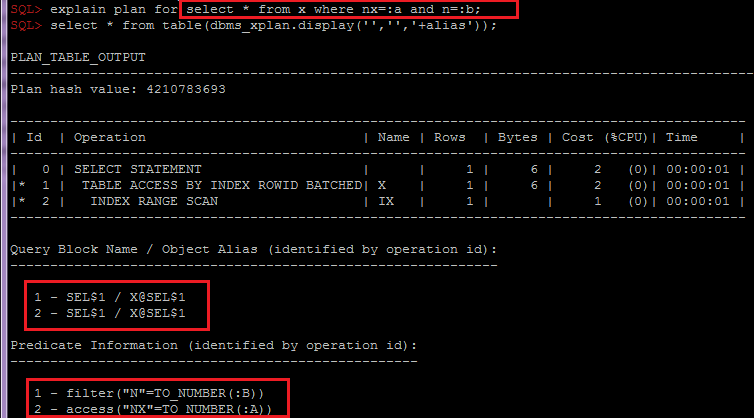
- Grouping by OBJECT_ALIAS inside SQL_ID, plan_hash_value is important for combining index and table predicates by object, because when accessing the table through the index, the predicates will be divided into different lines of the plan:
Depending on the need, this script can be easily modified to collect additional information in other sections, for example, taking into account partitioning or expectations. And having already analyzed this information, coupled with the analysis of table statistics and its indexes, the general data scheme and business logic, you can pass recommendations to developers or architects to choose a solution, for example: options for denormalization or changing the partitioning scheme or indexes.
It is also quite often forgotten to analyze SQL * net traffic, and there are also many subtleties, for example: fetch-size, SQLNET.COMPRESSION, extended datatypes, which allow reducing the number of roundtripes, etc., but this is a topic for a separate article.
In conclusion, I would like to say that now that users are becoming less tolerant of delays, optimizing performance is becoming a competitive advantage.