Diagnostic Improvements in .NET Core 3.0
- Transfer
In .NET Core 3.0, we present a set of tools that take advantage of the new features of the .NET runtime environment that simplify the diagnosis and resolution of performance problems.
These features will help you answer some common diagnostic questions you may have:

Over time, a memory leak may occur in the application, which ultimately leads to an OutOfMemoryException. In other cases, some problematic code can lead to a jump in processor load. These are just some of the problems that you can actively identify with metrics .
Metrics are measurement data over a period of time. These metrics allow you to monitor the state of your system at a high level. Unlike the .NET Framework on Windows, .NET Core does not generate performance counters. Instead, we introduced a new way to generate metrics in .NET Core through the EventCounter API.
EventCounters offer an improvement over Windows performance counters, as they are now used on all operating systems that support .NET Core. In addition, unlike performance counters, they can also be used in low-privilege environments (for example, when deploying xcopy). Unfortunately, the lack of a tool such as Performance Monitor (perfmon) makes it difficult to display these indicators in real time.
dotnet-counters
In 3.0-preview5, we present a new command-line tool for monitoring metrics generated by .NET Core applications in real time.
You can install this tool by running the following command
In the example below, we see that the CPU load and memory of our application increase when we start loading on our web application.

For detailed instructions on how to use this tool, see the readme file in the project with dotnet-counters . For the known limitations of dotnet-counters, look at open issues on GitHub .
While metrics help identify the occurrence of abnormal behavior, they offer little understanding of what went wrong. To answer the question why your application has abnormal behavior, you need to collect additional information through traces. For example, CPU Profiles collected using traces can help you determine the hot path in your code.
Traces are fixed time-stamped discrete event records. Traces contain a local context that allows you to better determine the fate of the system. Traditionally, the .NET Framework (and frameworks such as ASP.NET) generated diagnostic traces about their internal components using Event Tracing for Windows (ETW). In .NET Core, these traces were recorded in ETW for Windows and LTTng for Linux.
dotnet-trace
In version 3.0-preview5, each .NET Core application opens a duplex channel named EventPipe (a Unix domain socket in * nix or a named pipe in Windows) through which it can send events. While we are still working on the controller protocol, dotnet-trace implements a preliminary version of this protocol.
You can install this tool by running the following command

In the above example, I run a dotnet trace with a default profile that includes CPU profiler events and runtime .NET events.
In addition to the default events, you can enable additional providers based on the study you are trying to perform.
As a result of running dotnet trace, you get a .netperf file. This file contains runtime and CPU stack fetch events that can be visualized in perfview . The next update to Visual Studio (16.1) will also add support for visualizing these traces.
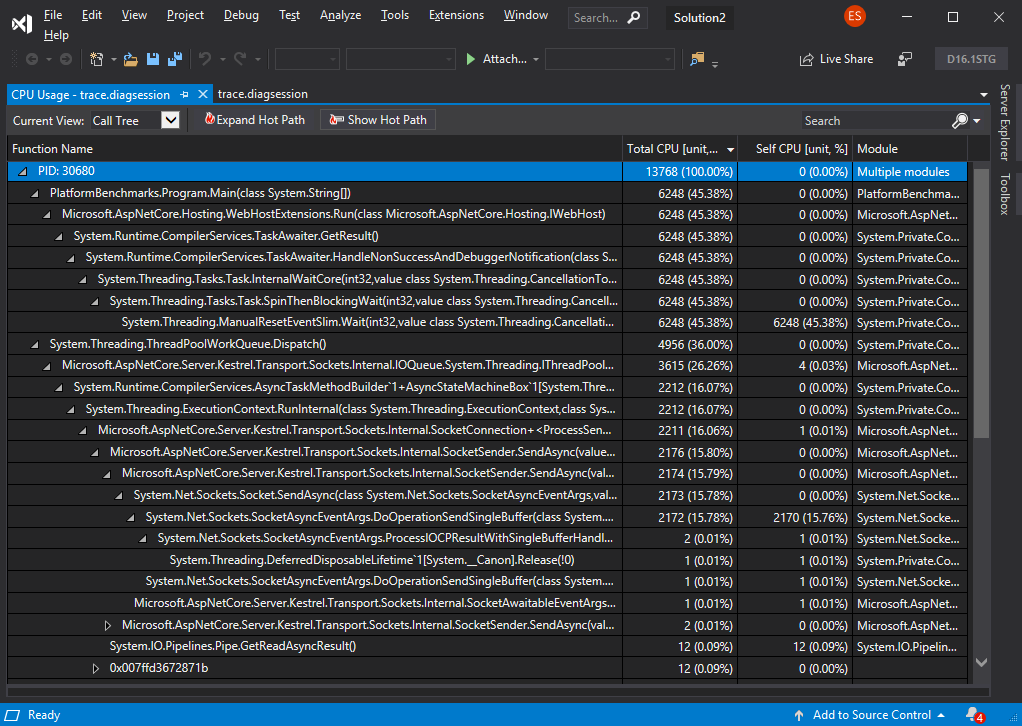
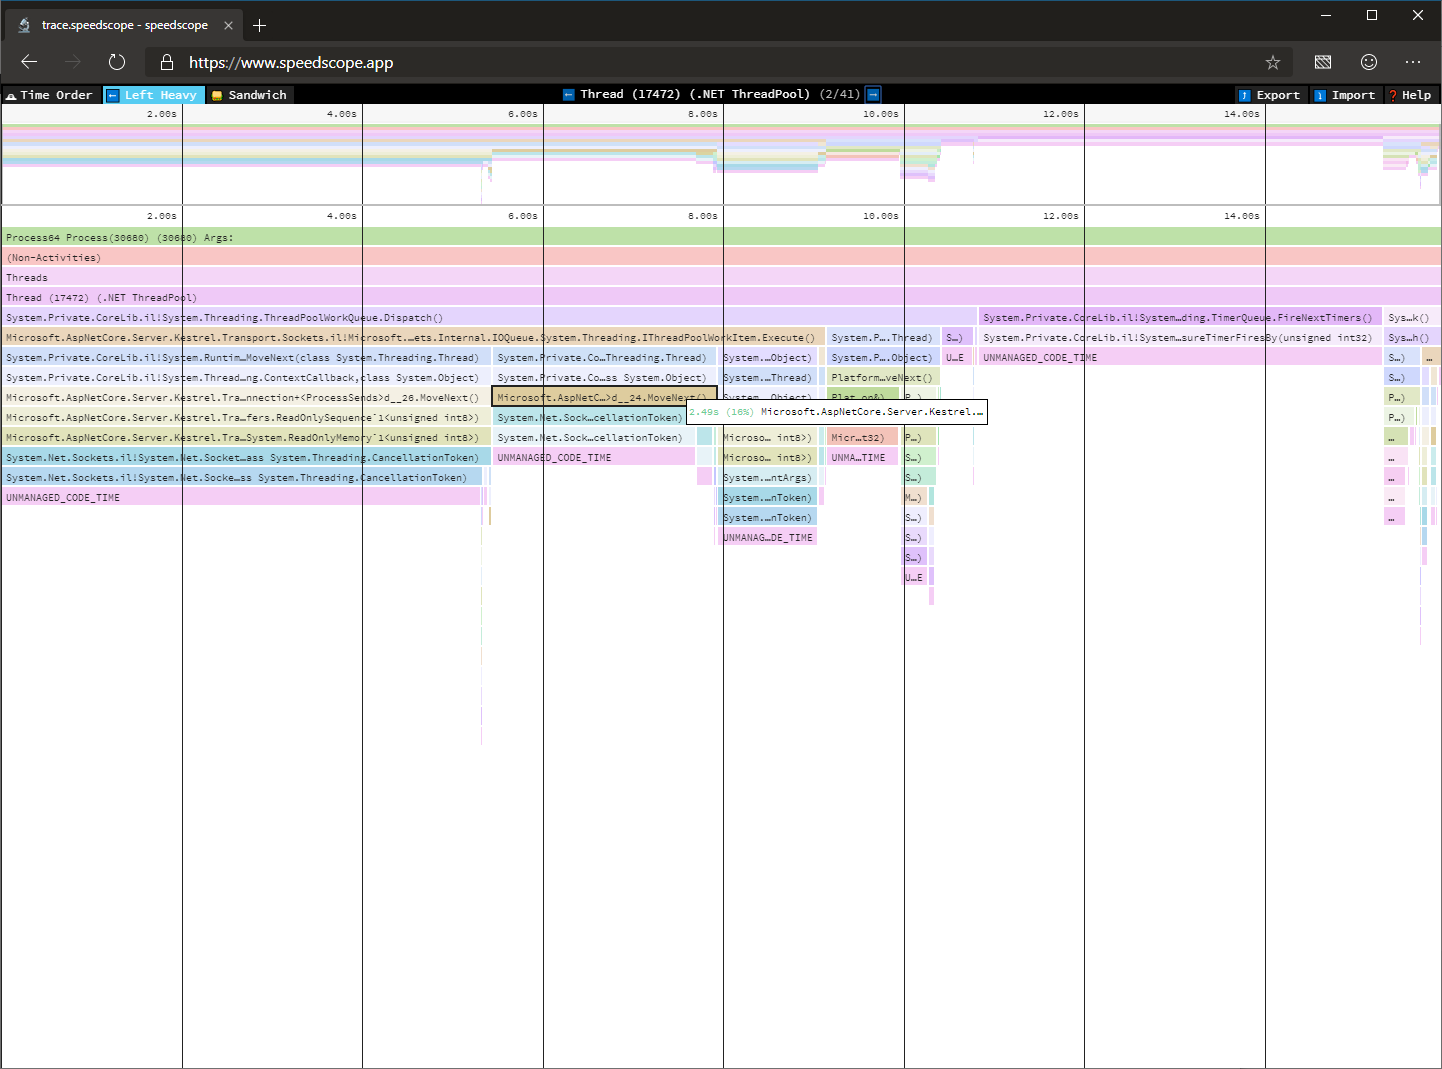
If you are running OS X or Linux, you can convert .netperf files to .speedscope.json files that can be rendered usingSpeedscope.app.
You can convert an existing trace by running the following command:
The image below shows a diagram that visualizes the trace we just received.
For detailed instructions on how to use this tool, see the readme file . For known limitations with dotnet-trace, look at open issues on GitHub .
In some cases, it is not possible to establish the cause of the abnormal behavior by simply monitoring the process. In the event of a process failure or situations where we may need additional information, such as access to the entire process heap, a process dump may be more suitable for analysis.
A dump is a record of the state of the working virtual memory of a process, usually captured when it was terminated unexpectedly. Kernel dump diagnostics are commonly used to identify the causes of application crashes or unexpected behavior.
Traditionally, you relied on your operating system to receive a dump when an application crashed (for example, Windows error reports) or used a tool such as procdump to capture a dump when certain launch criteria were met.
So far, the problem with dump dumping using .NET on Linux has been that dump dumping using gcore or the debugger has led to very large dumps, because the existing tools did not know which pages of virtual memory to trim in the .NET Core process.
In addition, it was difficult to analyze these dumps even after you collected them, because you had to purchase a debugger and configure it to load sos, a debugger extension for .NET.
dotnet-dump
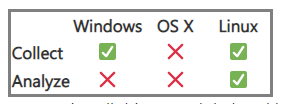
In 3.0.0-preview5, we present a new tool that allows you to collect and analyze process dumps on both Windows and Linux.
dotnet-dump is still under active development, and the table below shows which features are currently supported on which operating systems.
You can install this tool by running the following command
After you have installed dotnet-dump, you can capture the process dump by running the following command
On Linux, the resulting dump can be analyzed by loading the resulting dump with the following command
In the following example, I am trying to define an ASP.NET Core Hosting Environment dump.

For detailed instructions on how to use this tool, see the readme file. For known limitations with dotnet-dump, look at open issues on GitHub .
Thanks for testing the new diagnostic tools in .NET Core 3.0. Please continue to give us feedback, either in the comments or on GitHub . We listen carefully and will make changes based on your feedback.
These features will help you answer some common diagnostic questions you may have:
- Is my application operational?
- Why does my application have abnormal behavior?
- Why is my application crashes?

Is my application operational?
Over time, a memory leak may occur in the application, which ultimately leads to an OutOfMemoryException. In other cases, some problematic code can lead to a jump in processor load. These are just some of the problems that you can actively identify with metrics .
Metrics
Metrics are measurement data over a period of time. These metrics allow you to monitor the state of your system at a high level. Unlike the .NET Framework on Windows, .NET Core does not generate performance counters. Instead, we introduced a new way to generate metrics in .NET Core through the EventCounter API.
EventCounters offer an improvement over Windows performance counters, as they are now used on all operating systems that support .NET Core. In addition, unlike performance counters, they can also be used in low-privilege environments (for example, when deploying xcopy). Unfortunately, the lack of a tool such as Performance Monitor (perfmon) makes it difficult to display these indicators in real time.
dotnet-counters
In 3.0-preview5, we present a new command-line tool for monitoring metrics generated by .NET Core applications in real time.
You can install this tool by running the following command
dotnet tool install --global dotnet-counters --version 1.0.3-preview5.19251.2In the example below, we see that the CPU load and memory of our application increase when we start loading on our web application.

For detailed instructions on how to use this tool, see the readme file in the project with dotnet-counters . For the known limitations of dotnet-counters, look at open issues on GitHub .
Why does my application have abnormal behavior?
While metrics help identify the occurrence of abnormal behavior, they offer little understanding of what went wrong. To answer the question why your application has abnormal behavior, you need to collect additional information through traces. For example, CPU Profiles collected using traces can help you determine the hot path in your code.
Trace
Traces are fixed time-stamped discrete event records. Traces contain a local context that allows you to better determine the fate of the system. Traditionally, the .NET Framework (and frameworks such as ASP.NET) generated diagnostic traces about their internal components using Event Tracing for Windows (ETW). In .NET Core, these traces were recorded in ETW for Windows and LTTng for Linux.
dotnet-trace
In version 3.0-preview5, each .NET Core application opens a duplex channel named EventPipe (a Unix domain socket in * nix or a named pipe in Windows) through which it can send events. While we are still working on the controller protocol, dotnet-trace implements a preliminary version of this protocol.
You can install this tool by running the following command
dotnet tool install --global dotnet-trace--version 1.0.3-preview5.19251.2
In the above example, I run a dotnet trace with a default profile that includes CPU profiler events and runtime .NET events.
In addition to the default events, you can enable additional providers based on the study you are trying to perform.
As a result of running dotnet trace, you get a .netperf file. This file contains runtime and CPU stack fetch events that can be visualized in perfview . The next update to Visual Studio (16.1) will also add support for visualizing these traces.

If you are running OS X or Linux, you can convert .netperf files to .speedscope.json files that can be rendered usingSpeedscope.app.
You can convert an existing trace by running the following command:
dotnet trace convert The image below shows a diagram that visualizes the trace we just received.

For detailed instructions on how to use this tool, see the readme file . For known limitations with dotnet-trace, look at open issues on GitHub .
Why is my application crashes?
In some cases, it is not possible to establish the cause of the abnormal behavior by simply monitoring the process. In the event of a process failure or situations where we may need additional information, such as access to the entire process heap, a process dump may be more suitable for analysis.
Dump analysis
A dump is a record of the state of the working virtual memory of a process, usually captured when it was terminated unexpectedly. Kernel dump diagnostics are commonly used to identify the causes of application crashes or unexpected behavior.
Traditionally, you relied on your operating system to receive a dump when an application crashed (for example, Windows error reports) or used a tool such as procdump to capture a dump when certain launch criteria were met.
So far, the problem with dump dumping using .NET on Linux has been that dump dumping using gcore or the debugger has led to very large dumps, because the existing tools did not know which pages of virtual memory to trim in the .NET Core process.
In addition, it was difficult to analyze these dumps even after you collected them, because you had to purchase a debugger and configure it to load sos, a debugger extension for .NET.
dotnet-dump
In 3.0.0-preview5, we present a new tool that allows you to collect and analyze process dumps on both Windows and Linux.
dotnet-dump is still under active development, and the table below shows which features are currently supported on which operating systems.

You can install this tool by running the following command
dotnet tool install --global dotnet-dump --version 1.0.3-preview5.19251.2After you have installed dotnet-dump, you can capture the process dump by running the following command
sudo $HOME/.dotnet/tools/dotnet-dump collect -p On Linux, the resulting dump can be analyzed by loading the resulting dump with the following command
dotnet dump analyze In the following example, I am trying to define an ASP.NET Core Hosting Environment dump.

For detailed instructions on how to use this tool, see the readme file. For known limitations with dotnet-dump, look at open issues on GitHub .
Conclusion
Thanks for testing the new diagnostic tools in .NET Core 3.0. Please continue to give us feedback, either in the comments or on GitHub . We listen carefully and will make changes based on your feedback.
