How we learned to exploit Java in Docker
Under the hood, hh.ru contains a large number of Java services running in docker containers. During their operation, we encountered a lot of non-trivial problems. In many cases, in order to get to the bottom of the solution, I had to google for a long time, read the OpenJDK sources and even profile the services on production. In this article I will try to convey the quintessence of the knowledge gained in the process.
We used to live in kvm virtual machines with CPU and memory limitations and, moving to Docker, set similar restrictions in cgroups. And the first problem that we encountered was precisely CPU limits. I must say right away that this problem is no longer relevant for recent versions of Java 8 and Java ≥ 10. If you keep up with the times, you can safely skip this section.
So, we start a small service in the container and see that it produces a huge number of threads. Or the CPU consumes much more than expected, timeout how much in vain. Or here's another real situation: on one machine the service starts normally, and on another, with the same settings, it crashes, nailed by an OOM killer.
The answer is very simple - just Java does not see the restrictions
Libraries adjust the size of the thread pools to the number of available processors - hence the huge number of threads.
Java itself scales the number of GC threads in the same way, hence the CPU consumption and timeouts - the service begins to spend a large amount of resources on garbage collection, using the lion's share of the quota allocated to it.
Also, libraries (Netty in particular) can, in certain cases, adjust the size of off-hip memory to the number of CPUs, which leads to a high probability of exceeding the limits set for the container when running on a more powerful hardware.
At first, as this problem manifested itself, we tried to use the following work rounds:
- tried to use a couple of services libnumcpus - a library that allows you to "trick" Java by setting a different number of available processors;
- explicitly indicated the number of GC threads,
- explicitly set limits on the use of direct byte buffers.
But, of course, moving around with such crutches is not very convenient, and the move to Java 10 (and then Java 11), in which all these problems are absent , was a real solution . In fairness, it is worth saying that in the eight, too, everything was fine with the update 191 , released in October 2018. By that time it was already irrelevant for us, which I also wish for you.
This is one example where updating the Java version gives not only moral satisfaction, but also a real tangible profit in the form of simplified operation and increased service performance.
So, in Java 10, the options
Some time after we moved to Java 10/11, we began to notice some oddities. For some reason, in some services, the GC graphics looked like they did not use G1:
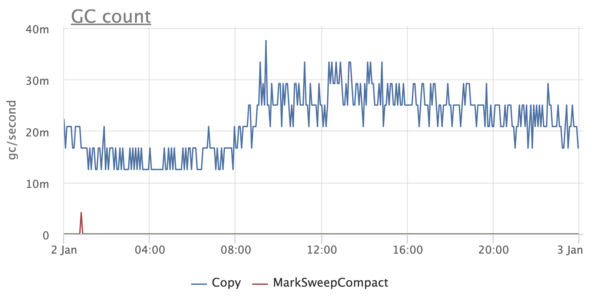
This was, to put it mildly, a little unexpected, since we knew for sure that G1 is the default collector, starting with Java 9. At the same time, there is no such problem in some services - G1 is turned on, as expected.
We begin to understand and stumble upon an interesting thing . It turns out that if Java is running on less than 3 processors and with a memory limit of less than 2 GB, then it considers itself to be client and does not allow to use anything other than SerialGC.
By the way, this affects only the choice of GC and has nothing to do with the -client / -server and JIT compilation options.
Obviously, when we used Java 8, it did not take into account docker limits and thought that it had a lot of processors and memory. After upgrading to Java 10, many services with limits set lower suddenly started using SerialGC. Fortunately, this is treated very simply - by explicitly setting the option
Looking at the graphs in monitoring, we somehow noticed that the Resident Set Size of the container is too large - as much as three times as much as the maximum hip size. Could this be the case in some next tricky mechanism that scales according to the number of processors in the system and does not know about the limitations of the docker?
It turns out that the mechanism is not at all tricky - it is the well-known malloc from glibc. In short, glibc uses the so-called arenas to allocate memory. When creating, each thread is assigned one of the arenas. When a thread using glibc wants to allocate a certain amount of memory in the native heap to its needs and calls malloc, then the memory is allocated in the arena assigned to it. If the arena serves several threads, then these threads will compete for it. The more arenas, the less competition, but the more fragmentation, since each arena has its own list of free areas.
On 64-bit systems, the default number of arenas is set to 8 * the number of CPUs. Obviously, this is a huge overhead for us, because not all CPUs are available to the container. Moreover, for Java-based applications, competition for arenas is not so relevant, since most allocations are done in Java-heap, the memory for which can be completely allocated at startup.
This feature of malloc has been known for a very long time , as well as its solution - to use the environment variable
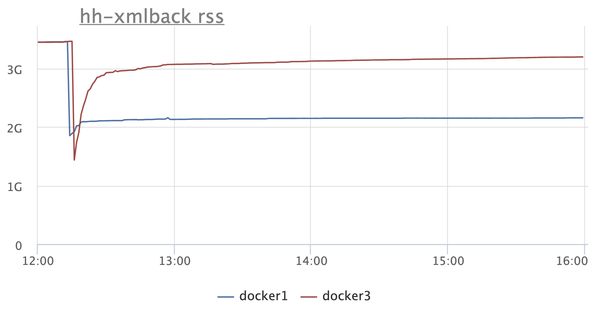
There are two instances on the RSS chart: in one (blue), turn on
But after that, there is a reasonable desire to figure out what Java generally spends memory on. Is it possible to run a microservice on Java with a memory limit of 300-400 megabytes and not be afraid that it will fall from Java-OOM or not be killed by a system OOM killer?
First of all, you need to prepare for the fact that OOMs are inevitable, and you need to handle them correctly - at least save hip dumps. Oddly enough, even this simple undertaking has its own nuances. For example, hip dumps are not overwritten - if a hip dump with the same name is already saved, then a new one will simply not be created.
Java can automatically add the dump serial number and process id to the file name, but this will not help us. The serial number is not useful, because this is OOM, and not the regularly requested hip-dump - the application restarts after it, resetting the counter. And the process id is not suitable, since in docker it is always the same (most often 1).
Therefore, we came to this option:
It is quite simple and with some improvements you can even teach to store it not only the latest hip-dump, but for our needs this is more than enough.
Java OOM is not the only thing we have to face. Each container has a limit on the memory it occupies, and it can be exceeded. If this happens, then the container is killed by the system OOM killer and restarts (we use
But before setting limits, you need to make sure that the JVM is not wasting resources. We have already managed to reduce memory consumption by using a limit on the number of CPUs and a variable
It turns out that there are a couple more tricks that will save a little memory.
The first is the use of an option
The second is the flag
And finally, a method that is not suitable for everyone (but it suits us) is to use jemalloc instead of the native malloc. This implementation is geared towards reducing memory fragmentation and better multithreading support compared to malloc from glibc. For our services, jemalloc yielded a bit more memory gain than malloc c
Other options, including those described by Alexei Shipilev in JVM Anatomy Quark # 12: Native Memory Tracking , seemed rather dangerous or led to a noticeable degradation in performance. However, for educational purposes, I recommend reading this article.
In the meantime, let's move on to the next topic and, finally, try to learn how to limit memory consumption and select the correct limits.
To do everything right, you need to remember what memory in general consists of in Java. First, let's look at the pools whose status can be monitored through JMX.
The first, of course, is hip . It's simple: we ask
At the same time
Next is non-heap . Non-heap memory includes:
- Metaspace and Compressed Class Space,
- Code Cache.
Consider these pools in order.
About MetaspaceOf course, everyone heard, I will not talk about him in detail. It stores class metadata, method bytecode, and so on. In fact, the use of Metaspace directly depends on the number and size of the loaded classes, and you can determine it, like hip, only by launching the application and removing the metrics via JMX. By default, Metaspace is not limited by anything, but it is quite easy to do this using the option
Compressed Class Space is part of Metaspace and appears when the option is enabled
By the way, if you look at the JMX readings, then the amount of non-heap memory is always calculated as the sum of Metaspace, Compressed Class Space and Code Cache. In fact, you only need to summarize Metaspace and CodeCache.
So, in non-heap only Code Cache remained - the repository of code compiled by the JIT compiler. By default, its maximum size is set to 240 MB, and for small services it is several times larger than necessary. Code Cache size can be set by option
It is important not to make a mistake here, since insufficient Code Cache leads to the removal of cold and old code from the cache (the option is
The last pool about which there is information in JMX is direct memory. By default, its size is not limited, so it is important to set some kind of limit for it - at least libraries like Netty, which actively use direct byte buffers, will be guided by it. It is not difficult to set a limit using the flag
So what do we get so far?
Let's try to draw everything on the chart and compare it with the RSS docker container.
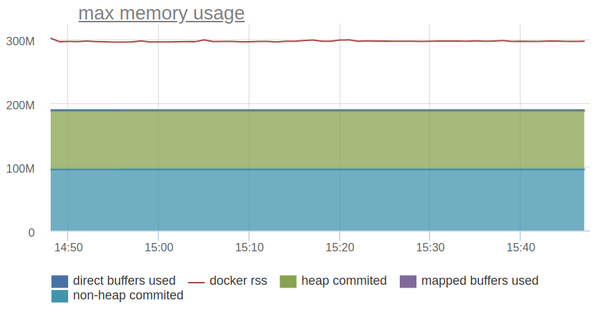
The line above is the RSS of the container and it is one and a half times more than the memory consumption of the JVM, which we can monitor through JMX.
Digging further!
Of course, in addition to heap, non-heap and direct memory, the JVM uses a whole bunch of other memory pools. The flag will help us deal with them
Let's start with the most obvious - the memory occupied by the stacks of threads . NMT produces something like the following for our service:
By the way, its size can also be found without Native Memory Tracking, using jstack and digging a bit in . Andrey Pangin laid out a special utility for this. The size of the Shared Class Space is even easier to evaluate:
This is the Class Data Sharing mechanism, enabled by the
The following are the native garbage collector structures :
Alexey Shipilev in the already mentioned manual on Native Memory Tracking says that they occupy about 4-5% of the size of the heap, but in our setup for small heap (up to several hundred megabytes) the overhead reached 50% of the size of the heap.
A lot of space can be occupied by symbol tables :
They store the names of methods, signatures, as well as links to interned strings. Unfortunately, it seems possible to estimate the size of the symbol table only post factum using Native Memory Tracking.
What is left? According to Native Memory Tracking, quite a lot of things:
But all this takes up quite a bit of space.
Unfortunately, many of the mentioned areas of memory can neither be limited nor controlled, and if it could be, the configuration would turn into hell. Even monitoring their status is a non-trivial task, since the inclusion of Native Memory Tracking slightly drains the performance of the application and enabling it on production in a critical service is not a good idea.
Nevertheless, for the sake of interest, let's try to reflect on the graph everything that Native Memory Tracking reports:
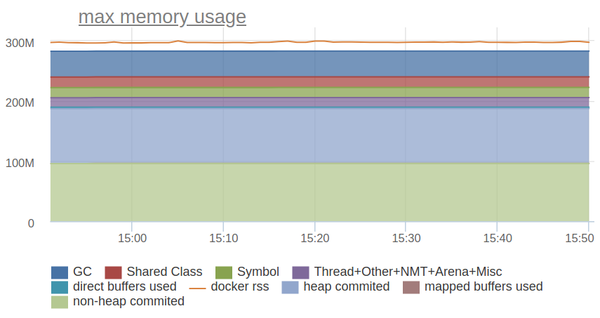
Not bad! The remaining difference is an overhead for fragmentation / allocation of memory (it is very small, since we use jemalloc) or the memory that native libs allocated. We just use one of these for efficient storage of the prefix tree.
So, for our needs, it’s enough to limit what we can: Heap, Metaspace, Code Cache, Direct Memory. For everything else, we leave some reasonable groundwork, determined by the results of practical measurements.
Having dealt with the CPU and memory, we move on to the next resource for which applications can compete - to the disks.
And with them, everything is very bad: they are slow and can lead to tangible dullness of the application. Therefore, we unbind Java from disks as much as possible:
If we write logs in syslog or in tmpfs, and the application itself does not write anything to the disk except for hip dumps, then it turns out that the story with disks can be considered closed on this?
Of course not.
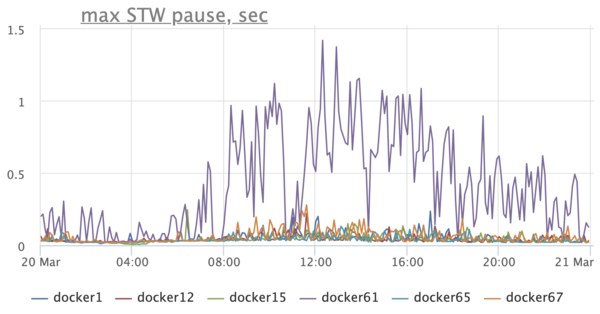
We pay attention to the graph of the duration of stop-the-world pauses and we see a sad picture - Stop-The-World-pauses on hosts are hundreds of milliseconds, and on one host they can reach up to a second:
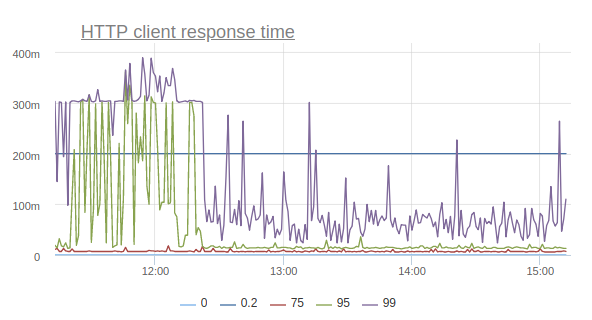
Needless to say that this negatively affects the application? Here, for example, is a graph reflecting the response time of the service according to customers:
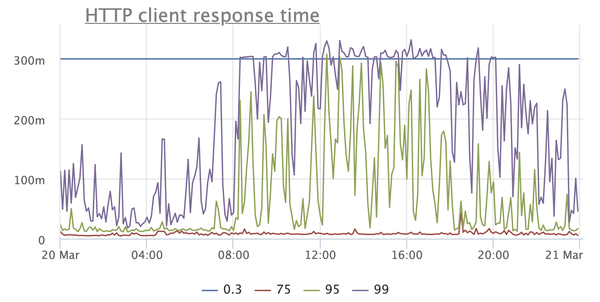
This is a very simple service, for the most part giving cached responses, so where are such prohibitive timings from, starting with the 95th percentile? Other services have a similar picture, moreover, timeouts are raining with enviable constancy when taking connection from the connection pool to the database, when executing requests, and so on.
What does the drive have to do with it? - you ask. It turns out very much to do with it.
A detailed analysis of the problem showed that long STW-pauses arise due to the fact that the threads go to the safepoint for a long time. After reading the JVM code, we realized that during the synchronization of threads on the safepoint, the JVM can write a file through the memory map
Disable it on one machine option
Jetty treadpool metrics stabilize:
And the response time percentiles begin to bounce back (I repeat, this is the effect of enabling the option on only one machine):
Thus, by turning off one option, we were able to reduce the number of timeouts, the number of retrays, and even correct the general percents of the response time of the site.
In order to support Java services in the docker, you must first learn how to follow them.
We run our services on the basis of our own Nuts and Bolts framework , and therefore we can outfit all critical places with the metrics we need. In the future, this greatly helps in the investigation of incidents and, in general, in understanding how the service lives on production. We send metrics to statsd, in practice it is more convenient than JMX.
By metrics, we try to build graphs that reflect the internal state of the service and allow us to quickly diagnose the causes of anomalies. Some of these graphs I have already cited as an example above.
We also send statsd and internal JVM metrics, such as memory consumption (heap, correctly counted non-heap and the big picture):
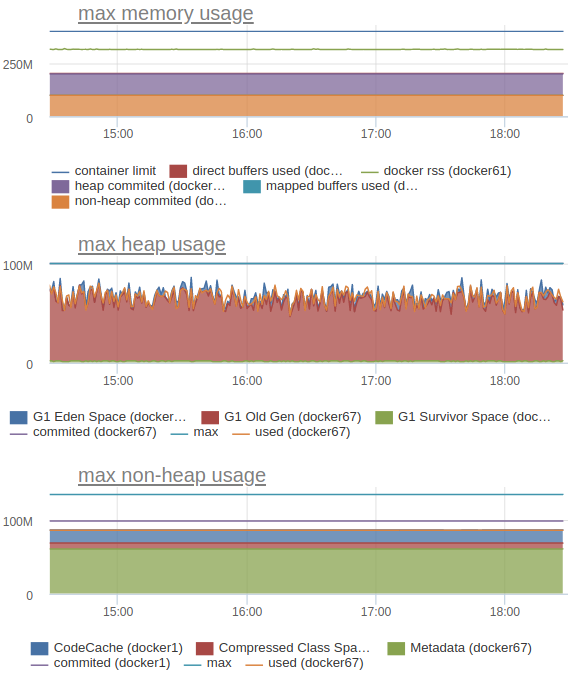
In particular, this allows us to understand what limits to set for each specific service.
And finally - how to constantly monitor that the limits are set correctly, and the services that live on the same host do not interfere with each other? In this, daily stress testing greatly helps us. Since we (so far) have two data centers, load testing is configured to double the RPS on the site.
The mechanism of load testing is very simple: in the morning, the crown starts, which parses the logs for the previous hour and forms a profile of a typical anonymous load from them. A number of employer and job pages are added to the anonymous burden. After that, the load profile is exported to the ammo file format for Yandex.Tank. At the set time, Yandex.Tank starts:
The load automatically stops when a small threshold of five hundred is exceeded.
During its existence, stress testing allowed us to identify a number of problems even before they affected real users. In addition, it gives us confidence that when one data center falls out, the other survivor will withstand the entire load.
Our experience shows that Java in Docker is not only convenient, but also quite economical in the end. You just need to learn how to cook them.
- CPU limits
- Docker and server class machine
- CPU limits (yes, again) and memory fragmentation
- We process Java-OOM
- Optimizing memory consumption
- Limiting memory consumption: heap, non-heap, direct memory
- Limiting memory consumption: Native Memory Tracking
- Java and drives
- How to keep track of everything?
CPU limits
We used to live in kvm virtual machines with CPU and memory limitations and, moving to Docker, set similar restrictions in cgroups. And the first problem that we encountered was precisely CPU limits. I must say right away that this problem is no longer relevant for recent versions of Java 8 and Java ≥ 10. If you keep up with the times, you can safely skip this section.
So, we start a small service in the container and see that it produces a huge number of threads. Or the CPU consumes much more than expected, timeout how much in vain. Or here's another real situation: on one machine the service starts normally, and on another, with the same settings, it crashes, nailed by an OOM killer.
The answer is very simple - just Java does not see the restrictions
--cpusexposed in the docker and believes that it has access to all the kernels of the host machine. And there can be a lot of them (in our standard setup - 80). Libraries adjust the size of the thread pools to the number of available processors - hence the huge number of threads.
Java itself scales the number of GC threads in the same way, hence the CPU consumption and timeouts - the service begins to spend a large amount of resources on garbage collection, using the lion's share of the quota allocated to it.
Also, libraries (Netty in particular) can, in certain cases, adjust the size of off-hip memory to the number of CPUs, which leads to a high probability of exceeding the limits set for the container when running on a more powerful hardware.
At first, as this problem manifested itself, we tried to use the following work rounds:
- tried to use a couple of services libnumcpus - a library that allows you to "trick" Java by setting a different number of available processors;
- explicitly indicated the number of GC threads,
- explicitly set limits on the use of direct byte buffers.
But, of course, moving around with such crutches is not very convenient, and the move to Java 10 (and then Java 11), in which all these problems are absent , was a real solution . In fairness, it is worth saying that in the eight, too, everything was fine with the update 191 , released in October 2018. By that time it was already irrelevant for us, which I also wish for you.
This is one example where updating the Java version gives not only moral satisfaction, but also a real tangible profit in the form of simplified operation and increased service performance.
Docker and server class machine
So, in Java 10, the options
-XX:ActiveProcessorCountand -XX:+UseContainerSupport, taking into account the default cgroups limits, appeared (and were backported to Java 8) . Now everything was wonderful. Or not? Some time after we moved to Java 10/11, we began to notice some oddities. For some reason, in some services, the GC graphics looked like they did not use G1:
This was, to put it mildly, a little unexpected, since we knew for sure that G1 is the default collector, starting with Java 9. At the same time, there is no such problem in some services - G1 is turned on, as expected.
We begin to understand and stumble upon an interesting thing . It turns out that if Java is running on less than 3 processors and with a memory limit of less than 2 GB, then it considers itself to be client and does not allow to use anything other than SerialGC.
By the way, this affects only the choice of GC and has nothing to do with the -client / -server and JIT compilation options.
Obviously, when we used Java 8, it did not take into account docker limits and thought that it had a lot of processors and memory. After upgrading to Java 10, many services with limits set lower suddenly started using SerialGC. Fortunately, this is treated very simply - by explicitly setting the option
-XX:+AlwaysActAsServerClassMachine.CPU limits (yes, again) and memory fragmentation
Looking at the graphs in monitoring, we somehow noticed that the Resident Set Size of the container is too large - as much as three times as much as the maximum hip size. Could this be the case in some next tricky mechanism that scales according to the number of processors in the system and does not know about the limitations of the docker?
It turns out that the mechanism is not at all tricky - it is the well-known malloc from glibc. In short, glibc uses the so-called arenas to allocate memory. When creating, each thread is assigned one of the arenas. When a thread using glibc wants to allocate a certain amount of memory in the native heap to its needs and calls malloc, then the memory is allocated in the arena assigned to it. If the arena serves several threads, then these threads will compete for it. The more arenas, the less competition, but the more fragmentation, since each arena has its own list of free areas.
On 64-bit systems, the default number of arenas is set to 8 * the number of CPUs. Obviously, this is a huge overhead for us, because not all CPUs are available to the container. Moreover, for Java-based applications, competition for arenas is not so relevant, since most allocations are done in Java-heap, the memory for which can be completely allocated at startup.
This feature of malloc has been known for a very long time , as well as its solution - to use the environment variable
MALLOC_ARENA_MAXto explicitly indicate the number of arenas. It is very easy to do for any container. Here is the effect of the MALLOC_ARENA_MAX = 4hint for our main backend:There are two instances on the RSS chart: in one (blue), turn on
MALLOC_ARENA_MAX, the other (red) just restart. The difference is obvious. But after that, there is a reasonable desire to figure out what Java generally spends memory on. Is it possible to run a microservice on Java with a memory limit of 300-400 megabytes and not be afraid that it will fall from Java-OOM or not be killed by a system OOM killer?
We process Java-OOM
First of all, you need to prepare for the fact that OOMs are inevitable, and you need to handle them correctly - at least save hip dumps. Oddly enough, even this simple undertaking has its own nuances. For example, hip dumps are not overwritten - if a hip dump with the same name is already saved, then a new one will simply not be created.
Java can automatically add the dump serial number and process id to the file name, but this will not help us. The serial number is not useful, because this is OOM, and not the regularly requested hip-dump - the application restarts after it, resetting the counter. And the process id is not suitable, since in docker it is always the same (most often 1).
Therefore, we came to this option:
-XX:+HeapDumpOnOutOfMemoryError

-XX:+ExitOnOutOfMemoryError

-XX:HeapDumpPath=/var/crash/java.hprof

-XX:OnOutOfMemoryError="mv /var/crash/java.hprof /var/crash/heapdump.hprof"
It is quite simple and with some improvements you can even teach to store it not only the latest hip-dump, but for our needs this is more than enough.
Java OOM is not the only thing we have to face. Each container has a limit on the memory it occupies, and it can be exceeded. If this happens, then the container is killed by the system OOM killer and restarts (we use
restart_policy: always). Naturally, this is undesirable, and we want to learn how to correctly set limits on the resources used by the JVM.Optimizing memory consumption
But before setting limits, you need to make sure that the JVM is not wasting resources. We have already managed to reduce memory consumption by using a limit on the number of CPUs and a variable
MALLOC_ARENA_MAX. Are there any other “almost free” ways to do this? It turns out that there are a couple more tricks that will save a little memory.
The first is the use of an option
-Xss(or -XX:ThreadStackSize) that controls the stack size for threads. The default for a 64-bit JVM is 1 MB. We found out that 512 KB is enough for us. Because of this, a StackOverflowException has never been caught before, but I admit that this is not suitable for everyone. And the profit from this is very small. The second is the flag
-XX:+UseStringDeduplication(when G1 GC is on). It allows you to save on memory by collapsing duplicate rows due to additional processor load. The tradeoff between the memory and the CPU depends only on the specific application and the settings of the deduplication mechanism itself. Read the dock and test in your services, we have this option has not yet found its application. And finally, a method that is not suitable for everyone (but it suits us) is to use jemalloc instead of the native malloc. This implementation is geared towards reducing memory fragmentation and better multithreading support compared to malloc from glibc. For our services, jemalloc yielded a bit more memory gain than malloc c
MALLOC_ARENA_MAX=4, without affecting performance significantly.Other options, including those described by Alexei Shipilev in JVM Anatomy Quark # 12: Native Memory Tracking , seemed rather dangerous or led to a noticeable degradation in performance. However, for educational purposes, I recommend reading this article.
In the meantime, let's move on to the next topic and, finally, try to learn how to limit memory consumption and select the correct limits.
Limiting memory consumption: heap, non-heap, direct memory
To do everything right, you need to remember what memory in general consists of in Java. First, let's look at the pools whose status can be monitored through JMX.
The first, of course, is hip . It's simple: we ask
-Xmx, but how to do it right? Unfortunately, there is no universal recipe here, it all depends on the application and the load profile. For new services, we start with a relatively reasonable heap size (128 MB) and, if necessary, increase or decrease it. To support existing ones, there is monitoring with graphs of memory consumption and GC metrics. At the same time
-Xmxwe are exhibiting-Xms == -Xmx. We don’t have memory overselling, so it’s in our interests that the service use the resources that we gave it to the maximum. In addition, in ordinary services, we include -XX:+AlwaysPreTouchthe Transparent Huge Pages: mechanism -XX:+UseTransparentHugePages -XX:+UseLargePagesInMetaspace. However, before enabling THP, carefully read the documentation and test how services behave with this option for a long time. Surprises are not ruled out on machines with insufficient RAM (for example, we had to turn off THP on test benches). Next is non-heap . Non-heap memory includes:
- Metaspace and Compressed Class Space,
- Code Cache.
Consider these pools in order.
About MetaspaceOf course, everyone heard, I will not talk about him in detail. It stores class metadata, method bytecode, and so on. In fact, the use of Metaspace directly depends on the number and size of the loaded classes, and you can determine it, like hip, only by launching the application and removing the metrics via JMX. By default, Metaspace is not limited by anything, but it is quite easy to do this using the option
-XX:MaxMetaspaceSize. Compressed Class Space is part of Metaspace and appears when the option is enabled
-XX:+UseCompressedClassPointers(enabled by default for heaps less than 32 GB, that is, when it can give a real memory gain). The size of this pool can be limited by the option-XX:CompressedClassSpaceSize, but there isn’t much point in this, since Compressed Class Space is included in Metaspace and the total amount of stored memory for Metaspace and Compressed Class Space is ultimately limited to one option -XX:MaxMetaspaceSize. By the way, if you look at the JMX readings, then the amount of non-heap memory is always calculated as the sum of Metaspace, Compressed Class Space and Code Cache. In fact, you only need to summarize Metaspace and CodeCache.
So, in non-heap only Code Cache remained - the repository of code compiled by the JIT compiler. By default, its maximum size is set to 240 MB, and for small services it is several times larger than necessary. Code Cache size can be set by option
-XX:ReservedCodeCacheSize. The correct size can only be determined by running the application and following it under a typical load profile. It is important not to make a mistake here, since insufficient Code Cache leads to the removal of cold and old code from the cache (the option is
-XX:+UseCodeCacheFlushingenabled by default), and this, in turn, can lead to higher CPU consumption and performance degradation. It would be great if you could throw OOM when the Code Cache overflows, there is even a flag for this -XX:+ExitOnFullCodeCache, but, unfortunately, it is only available in the development version of the JVM. The last pool about which there is information in JMX is direct memory. By default, its size is not limited, so it is important to set some kind of limit for it - at least libraries like Netty, which actively use direct byte buffers, will be guided by it. It is not difficult to set a limit using the flag
-XX:MaxDirectMemorySize, and again, only monitoring will help us in determining the correct value. So what do we get so far?
Java process memory =
    Heap + Metaspace + Code Cache + Direct Memory =
        -Xmx +
        -XX: MaxMetaspaceSize +
        -XX: ReservedCodeCacheSize +
        -XX: MaxDirectMemorySize
Let's try to draw everything on the chart and compare it with the RSS docker container.
The line above is the RSS of the container and it is one and a half times more than the memory consumption of the JVM, which we can monitor through JMX.
Digging further!
Limiting memory consumption: Native Memory Tracking
Of course, in addition to heap, non-heap and direct memory, the JVM uses a whole bunch of other memory pools. The flag will help us deal with them
-XX:NativeMemoryTracking=summary. By enabling this option, we will be able to get information about pools known to the JVM, but not available in JMX. You can read more about using this option in the documentation . Let's start with the most obvious - the memory occupied by the stacks of threads . NMT produces something like the following for our service:
Thread (reserved = 32166KB, committed = 5358KB)
    (thread # 52)
    (stack: reserved = 31920KB, committed = 5112KB)
    (malloc = 185KB # 270)
    (arena = 61KB # 102)
By the way, its size can also be found without Native Memory Tracking, using jstack and digging a bit in . Andrey Pangin laid out a special utility for this. The size of the Shared Class Space is even easier to evaluate:
/proc//smaps Shared class space (reserved = 17084KB, committed = 17084KB)
(mmap: reserved = 17084KB, committed = 17084KB)This is the Class Data Sharing mechanism, enabled by the
-Xshareand options -XX:+UseAppCDS. In Java 11, the option -Xshareis set to auto by default, which means that if you have an archive $JAVA_HOME/lib/server/classes.jsa(it is in the official OpenJDK docker image), it will be loaded with a memory map when starting the JVM, accelerating the startup time. Accordingly, the size of Shared Class Space is easy to determine if you know the size of jsa-archives. The following are the native garbage collector structures :
GC (reserved = 42137KB, committed = 41801KB)
    (malloc = 5705KB # 9460)
    (mmap: reserved = 36432KB, committed = 36096KB)
Alexey Shipilev in the already mentioned manual on Native Memory Tracking says that they occupy about 4-5% of the size of the heap, but in our setup for small heap (up to several hundred megabytes) the overhead reached 50% of the size of the heap.
A lot of space can be occupied by symbol tables :
Symbol (reserved = 16421KB, committed = 16421KB)
    (malloc = 15261KB # 203089)
    (arena = 1159KB # 1)
They store the names of methods, signatures, as well as links to interned strings. Unfortunately, it seems possible to estimate the size of the symbol table only post factum using Native Memory Tracking.
What is left? According to Native Memory Tracking, quite a lot of things:
Compiler (reserved = 509KB, committed = 509KB)
Internal (reserved = 1647KB, committed = 1647KB)
Other (reserved = 2110KB, committed = 2110KB)
Arena Chunk (reserved = 1712KB, committed = 1712KB)
Logging (reserved = 6KB, committed = 6KB)
Arguments (reserved = 19KB, committed = 19KB)
Module (reserved = 227KB, committed = 227KB)
Unknown (reserved = 32KB, committed = 32KB)
But all this takes up quite a bit of space.
Unfortunately, many of the mentioned areas of memory can neither be limited nor controlled, and if it could be, the configuration would turn into hell. Even monitoring their status is a non-trivial task, since the inclusion of Native Memory Tracking slightly drains the performance of the application and enabling it on production in a critical service is not a good idea.
Nevertheless, for the sake of interest, let's try to reflect on the graph everything that Native Memory Tracking reports:
Not bad! The remaining difference is an overhead for fragmentation / allocation of memory (it is very small, since we use jemalloc) or the memory that native libs allocated. We just use one of these for efficient storage of the prefix tree.
So, for our needs, it’s enough to limit what we can: Heap, Metaspace, Code Cache, Direct Memory. For everything else, we leave some reasonable groundwork, determined by the results of practical measurements.
Having dealt with the CPU and memory, we move on to the next resource for which applications can compete - to the disks.
Java and drives
And with them, everything is very bad: they are slow and can lead to tangible dullness of the application. Therefore, we unbind Java from disks as much as possible:
- We write all application logs to the local syslog via UDP. This leaves some chance that the necessary logs will be lost somewhere along the way, but, as practice has shown, such cases are very rare.
- We will write JVM logs in tmpfs, for this we just need to mount the docker in the right place with the volume
/dev/shm.
If we write logs in syslog or in tmpfs, and the application itself does not write anything to the disk except for hip dumps, then it turns out that the story with disks can be considered closed on this?
Of course not.
We pay attention to the graph of the duration of stop-the-world pauses and we see a sad picture - Stop-The-World-pauses on hosts are hundreds of milliseconds, and on one host they can reach up to a second:
Needless to say that this negatively affects the application? Here, for example, is a graph reflecting the response time of the service according to customers:
This is a very simple service, for the most part giving cached responses, so where are such prohibitive timings from, starting with the 95th percentile? Other services have a similar picture, moreover, timeouts are raining with enviable constancy when taking connection from the connection pool to the database, when executing requests, and so on.
What does the drive have to do with it? - you ask. It turns out very much to do with it.
A detailed analysis of the problem showed that long STW-pauses arise due to the fact that the threads go to the safepoint for a long time. After reading the JVM code, we realized that during the synchronization of threads on the safepoint, the JVM can write a file through the memory map
/tmp/hsperfdata*to which it exports some statistics. Utilities like jstatand use these statistics jps. Disable it on one machine option
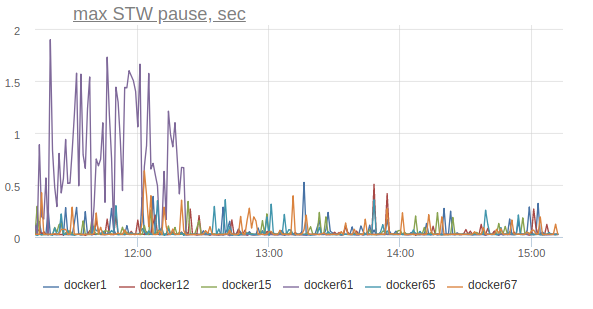
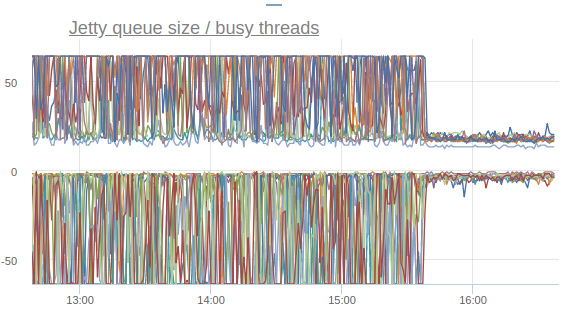
-XX:+PerfDisableSharedMem and…Jetty treadpool metrics stabilize:
And the response time percentiles begin to bounce back (I repeat, this is the effect of enabling the option on only one machine):
Thus, by turning off one option, we were able to reduce the number of timeouts, the number of retrays, and even correct the general percents of the response time of the site.
How to keep track of everything?
In order to support Java services in the docker, you must first learn how to follow them.
We run our services on the basis of our own Nuts and Bolts framework , and therefore we can outfit all critical places with the metrics we need. In the future, this greatly helps in the investigation of incidents and, in general, in understanding how the service lives on production. We send metrics to statsd, in practice it is more convenient than JMX.
By metrics, we try to build graphs that reflect the internal state of the service and allow us to quickly diagnose the causes of anomalies. Some of these graphs I have already cited as an example above.
We also send statsd and internal JVM metrics, such as memory consumption (heap, correctly counted non-heap and the big picture):
In particular, this allows us to understand what limits to set for each specific service.
And finally - how to constantly monitor that the limits are set correctly, and the services that live on the same host do not interfere with each other? In this, daily stress testing greatly helps us. Since we (so far) have two data centers, load testing is configured to double the RPS on the site.
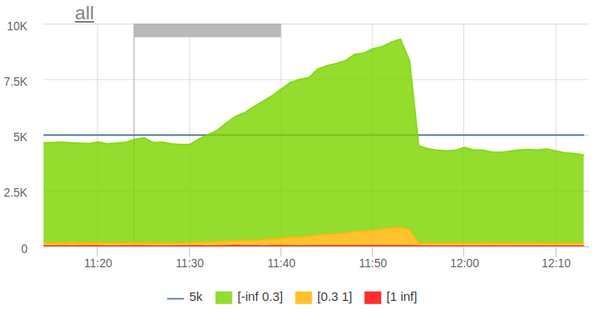
The mechanism of load testing is very simple: in the morning, the crown starts, which parses the logs for the previous hour and forms a profile of a typical anonymous load from them. A number of employer and job pages are added to the anonymous burden. After that, the load profile is exported to the ammo file format for Yandex.Tank. At the set time, Yandex.Tank starts:
The load automatically stops when a small threshold of five hundred is exceeded.
During its existence, stress testing allowed us to identify a number of problems even before they affected real users. In addition, it gives us confidence that when one data center falls out, the other survivor will withstand the entire load.
Finally
Our experience shows that Java in Docker is not only convenient, but also quite economical in the end. You just need to learn how to cook them.