How to analyze a competitor’s site for free. Step-by-step instruction
- Tutorial

Habr, hello!
Today I will show you how to analyze the site you are interested in for free through the Similarweb service.
I’ll tell you in detail about all the nuances and go through all the steps from registration to analysis.
For an example, I’ll take the Yandex.ru website.
What data will we get as a result:
- Website
traffic by months (mobile and desktop) - Channels from which traffic comes
- Audience loyalty: amount of time on the website, bounce rate, page views per session
- Demographic data, geo and interests of the site’s audience
- Keywords for which they come to the site
And also a little touch on the analysis of the mobile application.
Let's get started!
Foreword
First, I would like to explain why you need to be able to use site analysis systems.
This is useful not only for analyzing competitors, but also when buying ads on sites that often overestimate their statistics, thereby trying to sell the placement more expensive. And also - to analyze successful sites / applications to understand how they are growing.
When analyzing, keep in mind that SimilarWeb has an error in traffic calculations.
In my personal experience, the error is from + 7% to + 30%, but there have been cases of an error of + 300%. The
article will be useful to specialists who have not previously worked with the service.
Now let's get started!
registration
First, we need to register an account in Similarweb and get a demo version.
Please note that the service does not have a Russian-language version, and demo access is given only for 7 days.
We go to the Similarweb website, click "Login" in the upper right corner.

Choose a registration method. I will choose Google.

After choosing a Google account, we get to the product line page. Choosing a Marketing Team

After choosing a product, you will be transferred to an online form, fill it in and get demo access for 7 days.
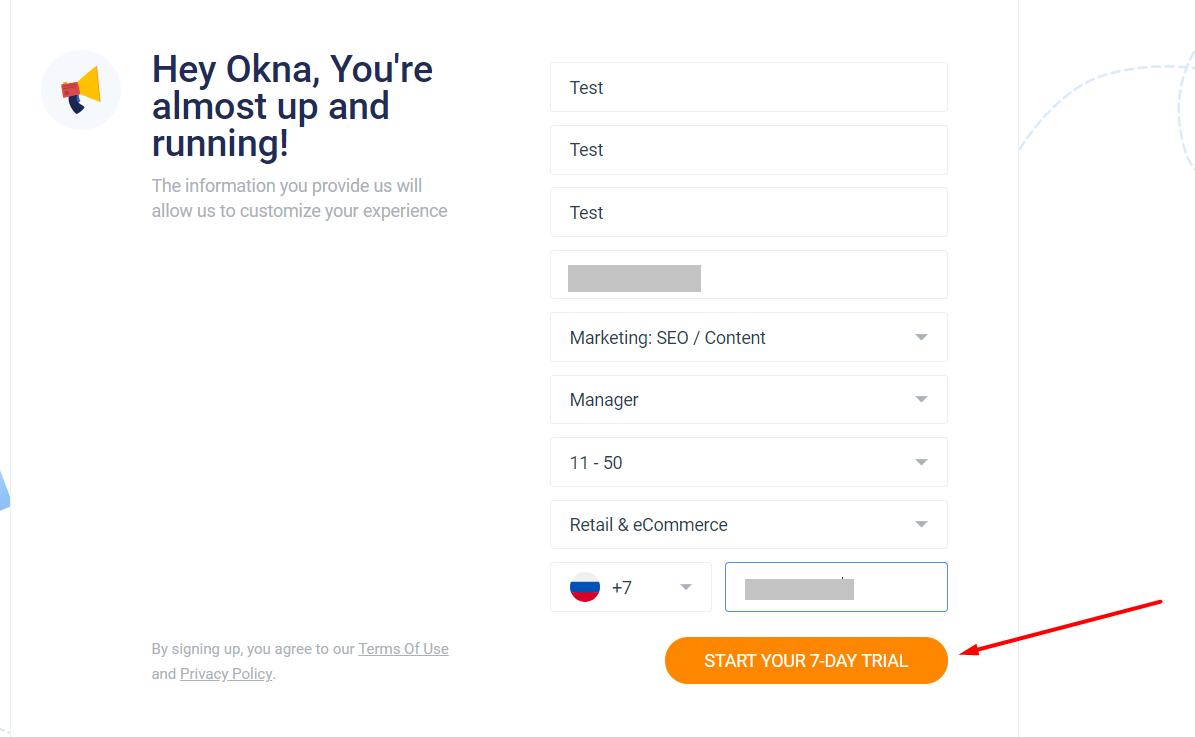
Now we are registered and can begin to analyze traffic.
Site analysis
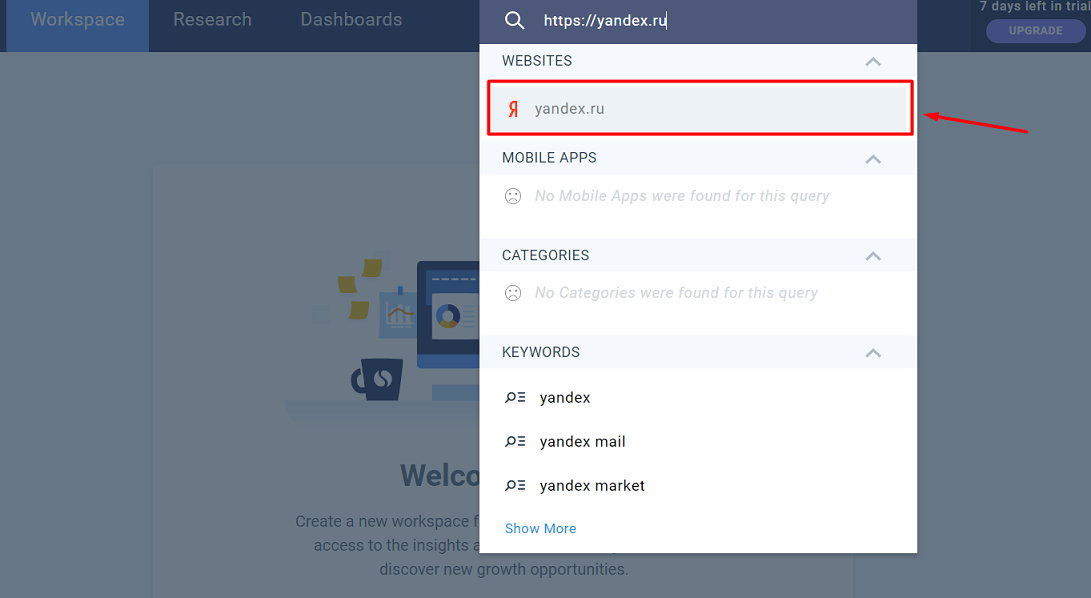
After registration, we get to the main page of the service.
At the top in the Search field, enter the url of the site we are interested in, in my case yandex.ru ,
and select it from the list that appears.
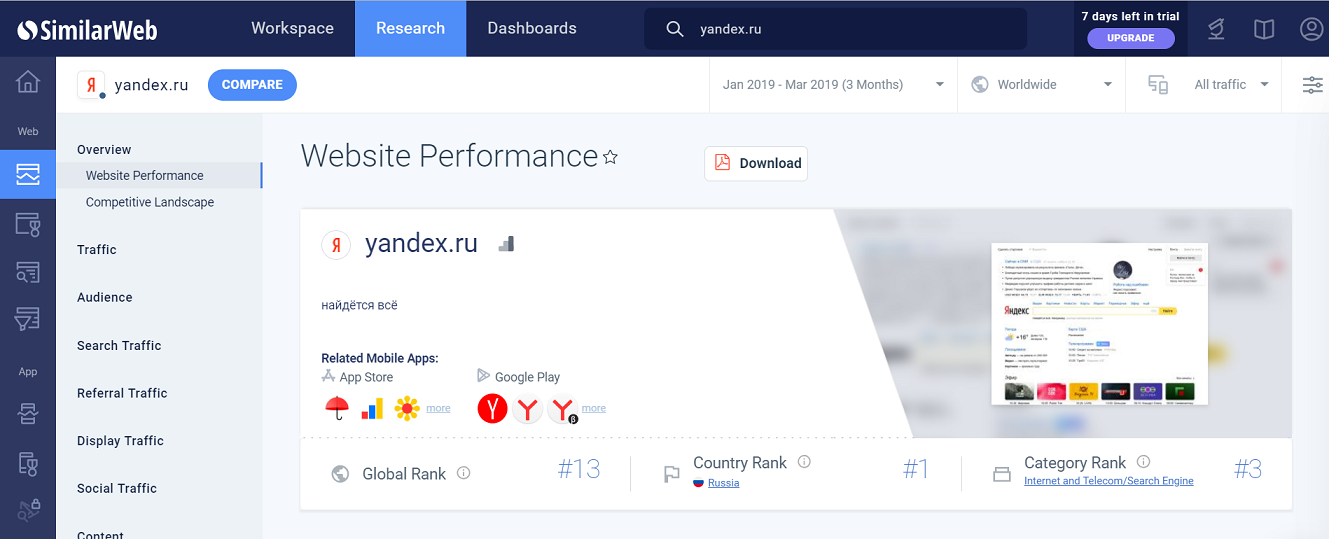
Now we are in the main dashboard of the system. You need to make the settings.
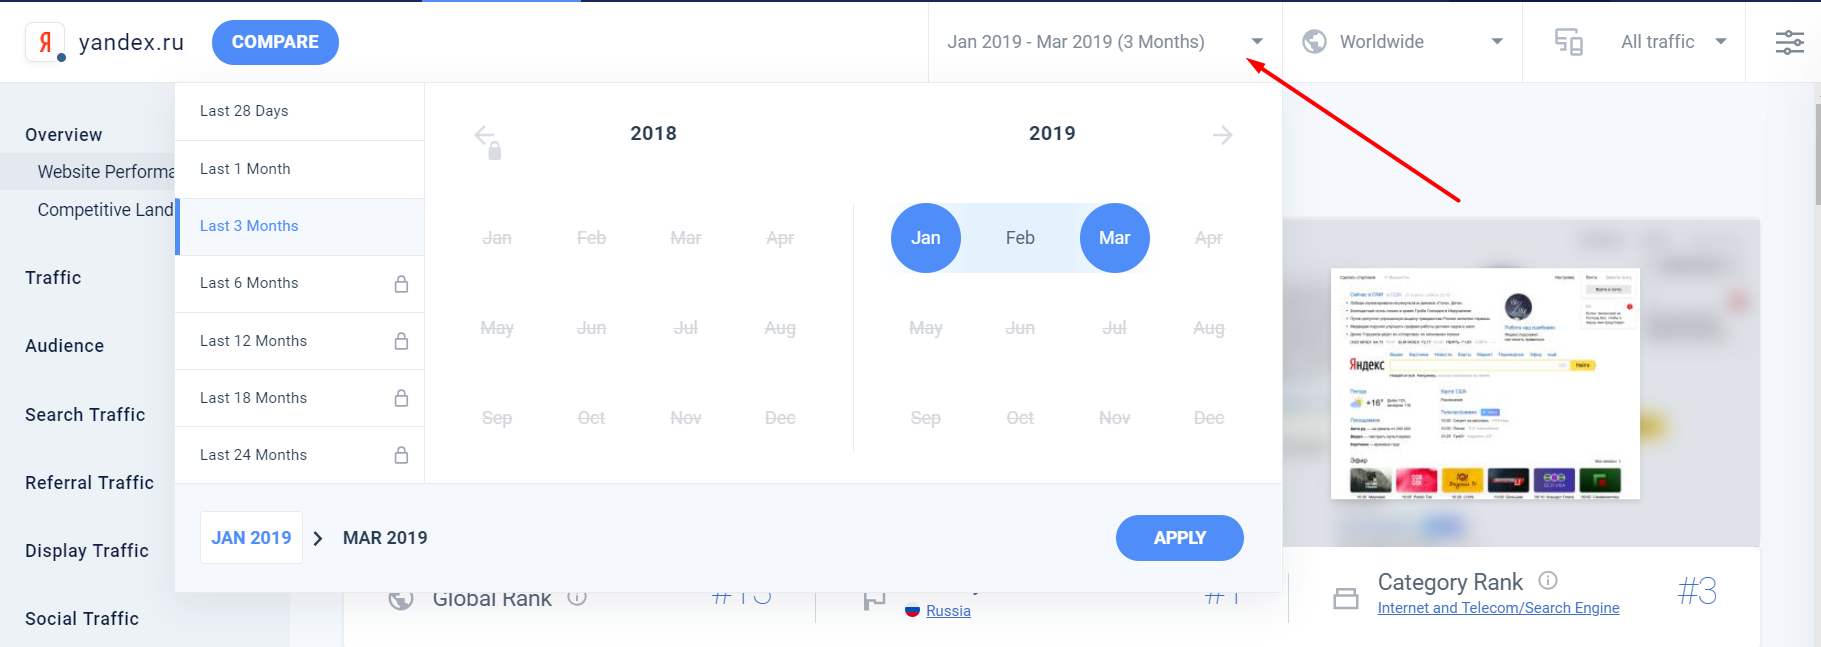
First, choose a time period for analysis, but keep in mind that in the free version you can select an interval of no more than 3 months. In the paid version, you can choose a period of up to a year (the paid version costs about 5 million rubles per year).
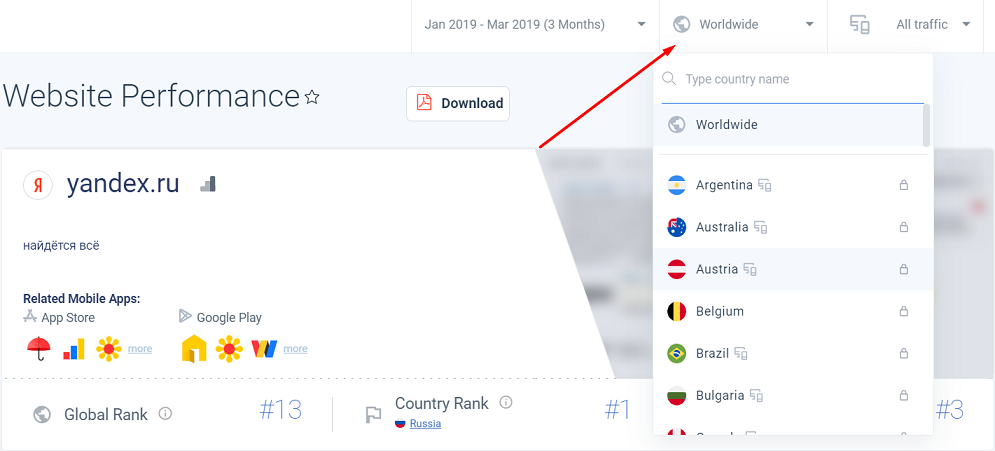
Next, we can configure the geo. With the default settings, all countries will be selected.
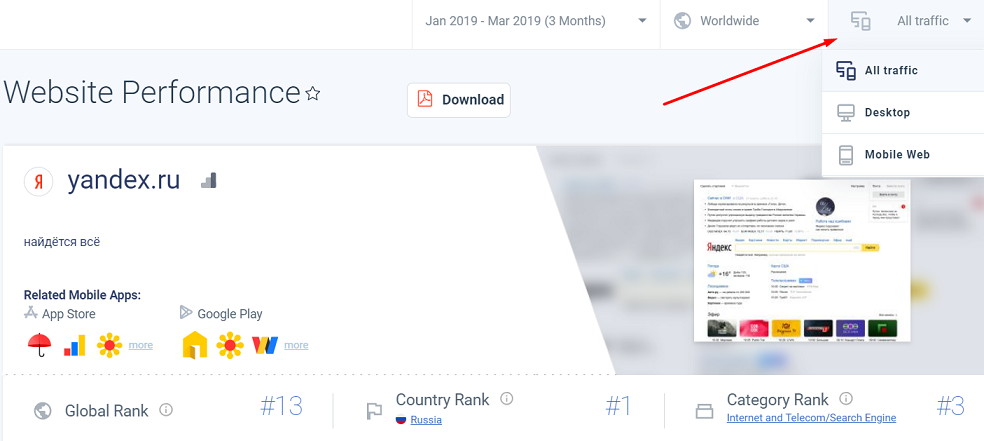
In this window, you can configure statistics for the type of device (desktop, mobile).
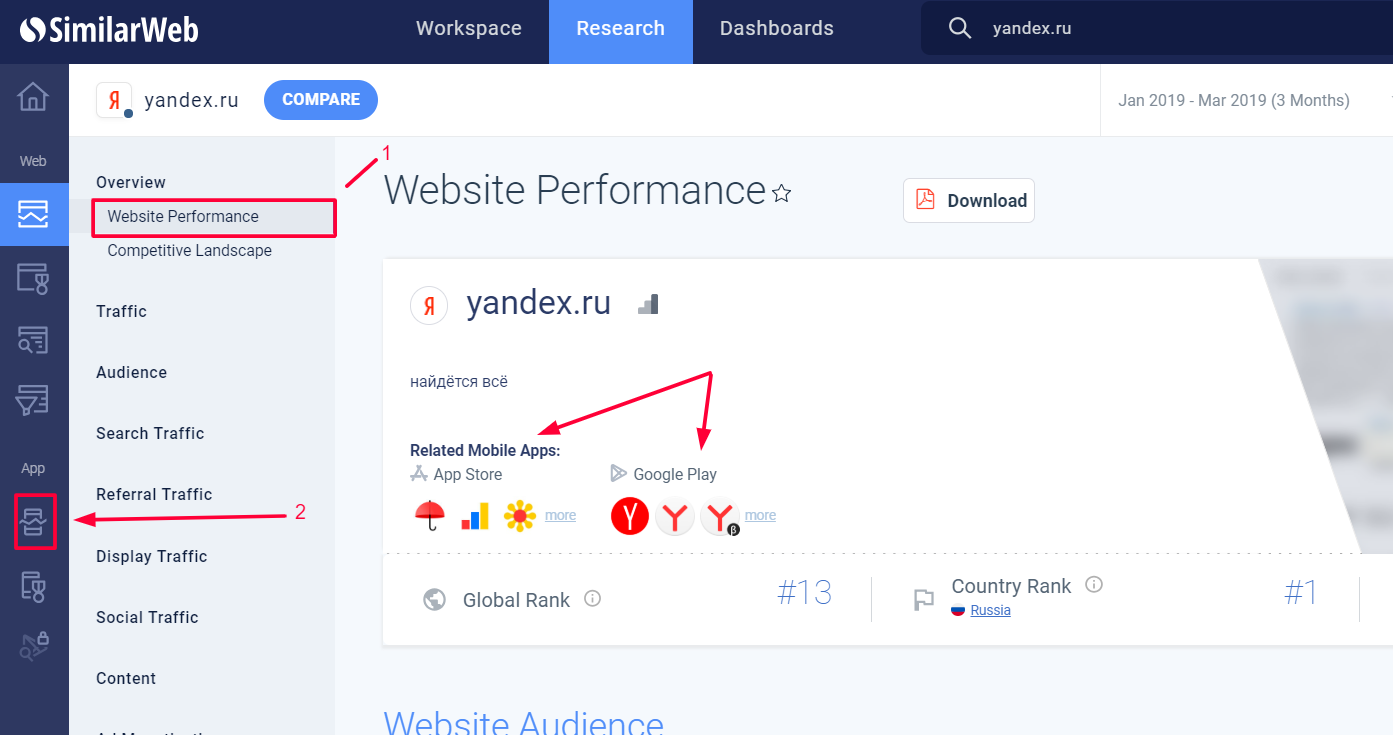
For a quick analysis, we just need to look at the main dashboard of the service.
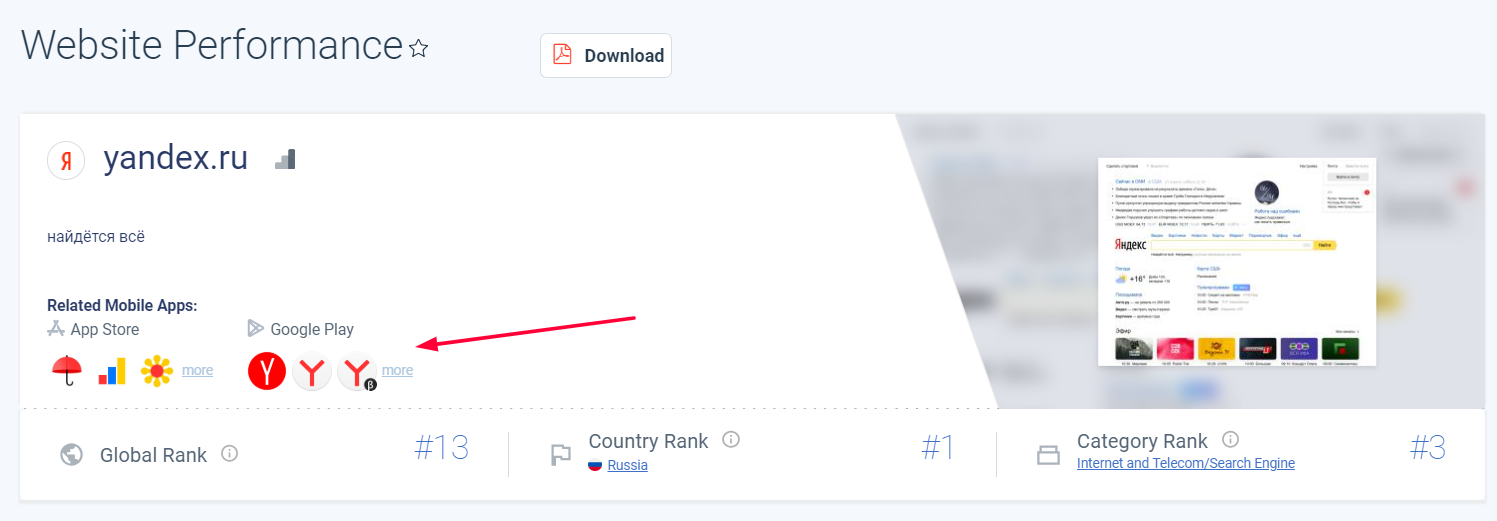
On the first panel, we see a brief description and the ability to select any Yandex application for analysis.
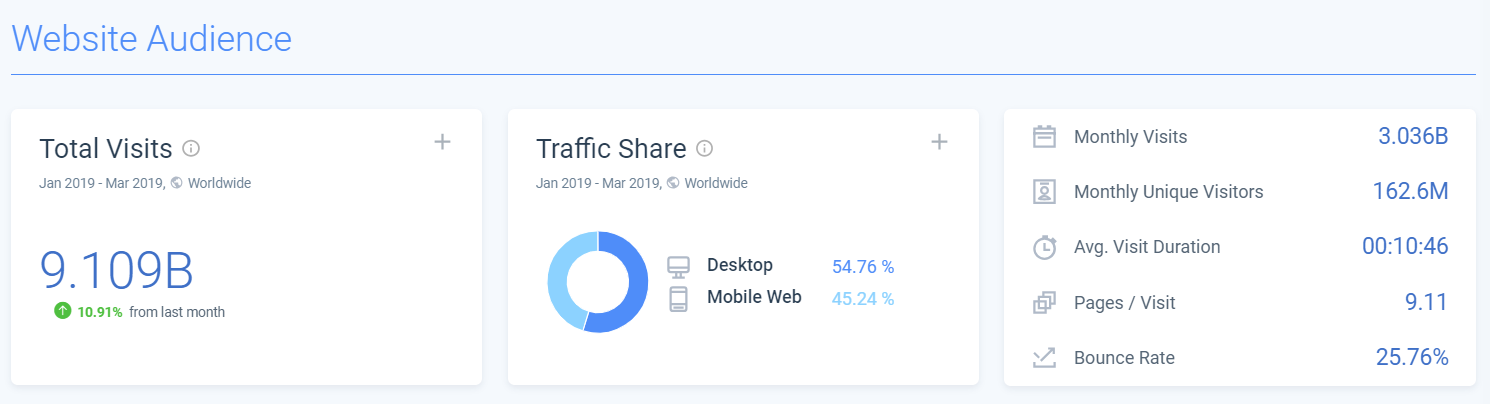
Below is a dashboard with general indicators: the number of visits, the ratio of desktop to mobile and loyalty indicators.
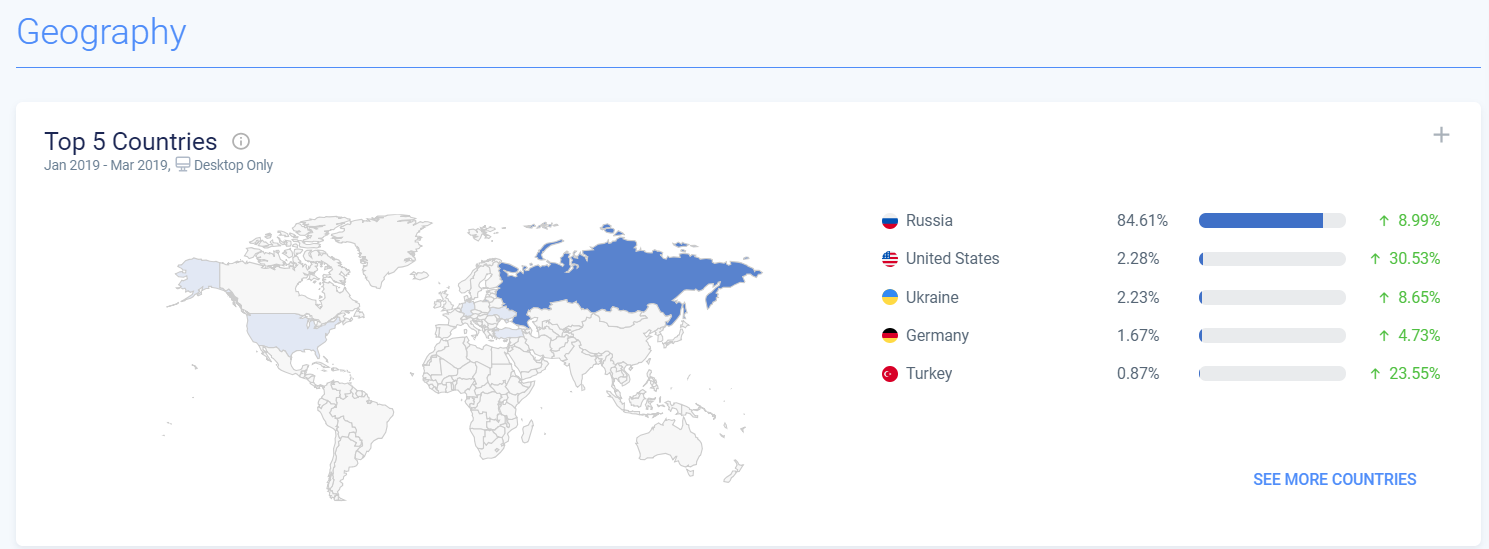
Geo - dashboard displays the top 5 countries by attendance.
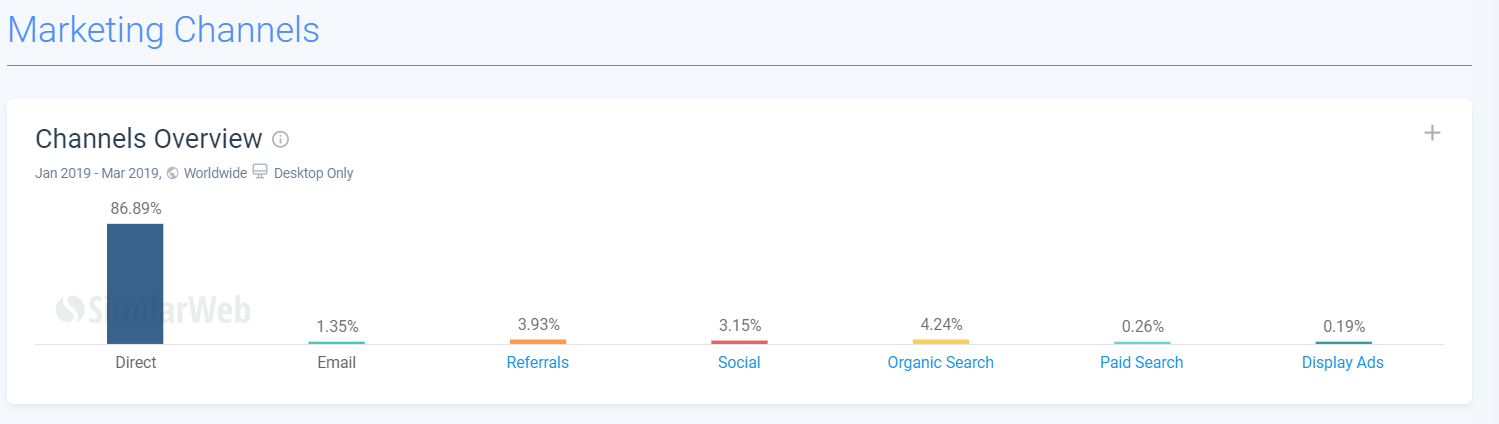
Here you can see the main indicators for traffic channels.
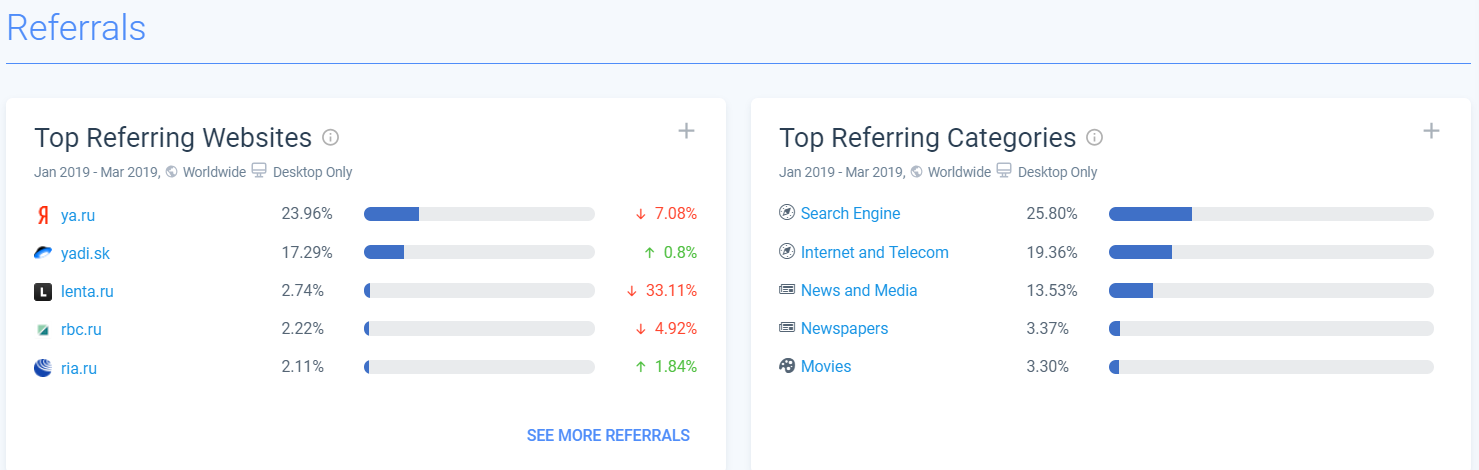
The following dashboard shows which sites traffic comes from.
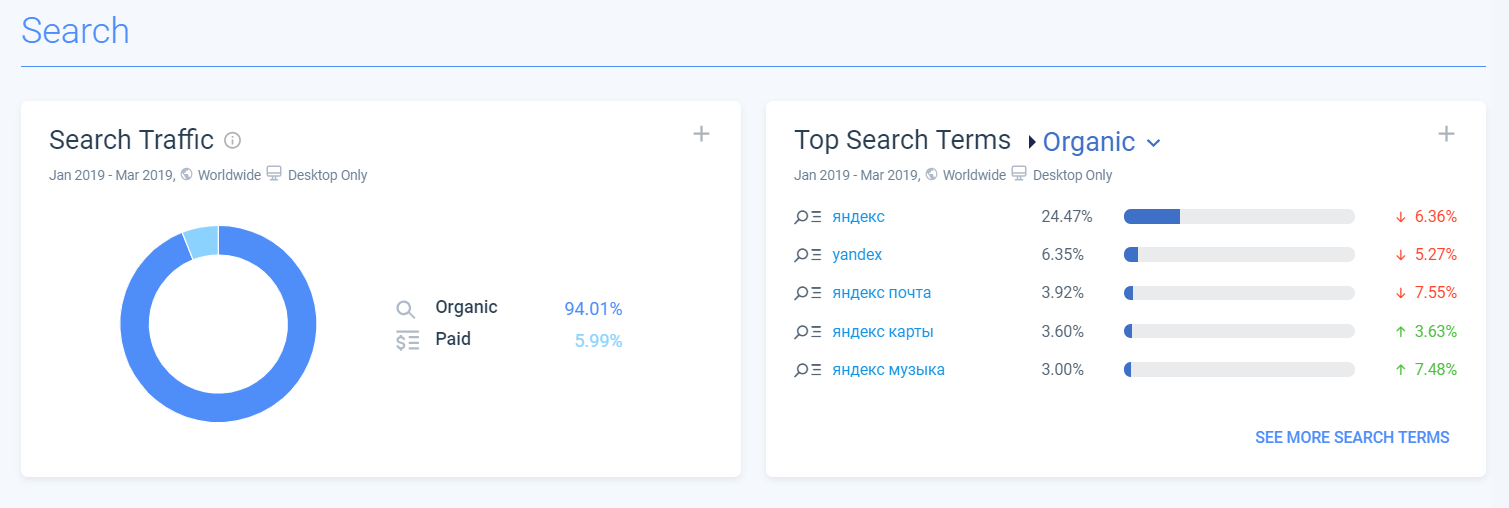
Here we see the main data on search traffic and the top keywords
broken down by organic and paid.
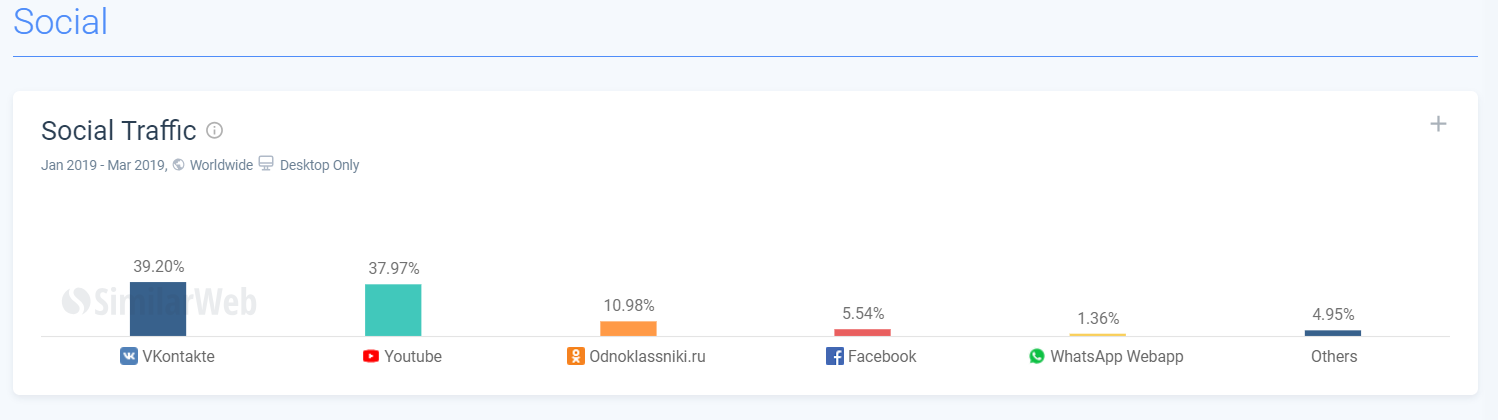
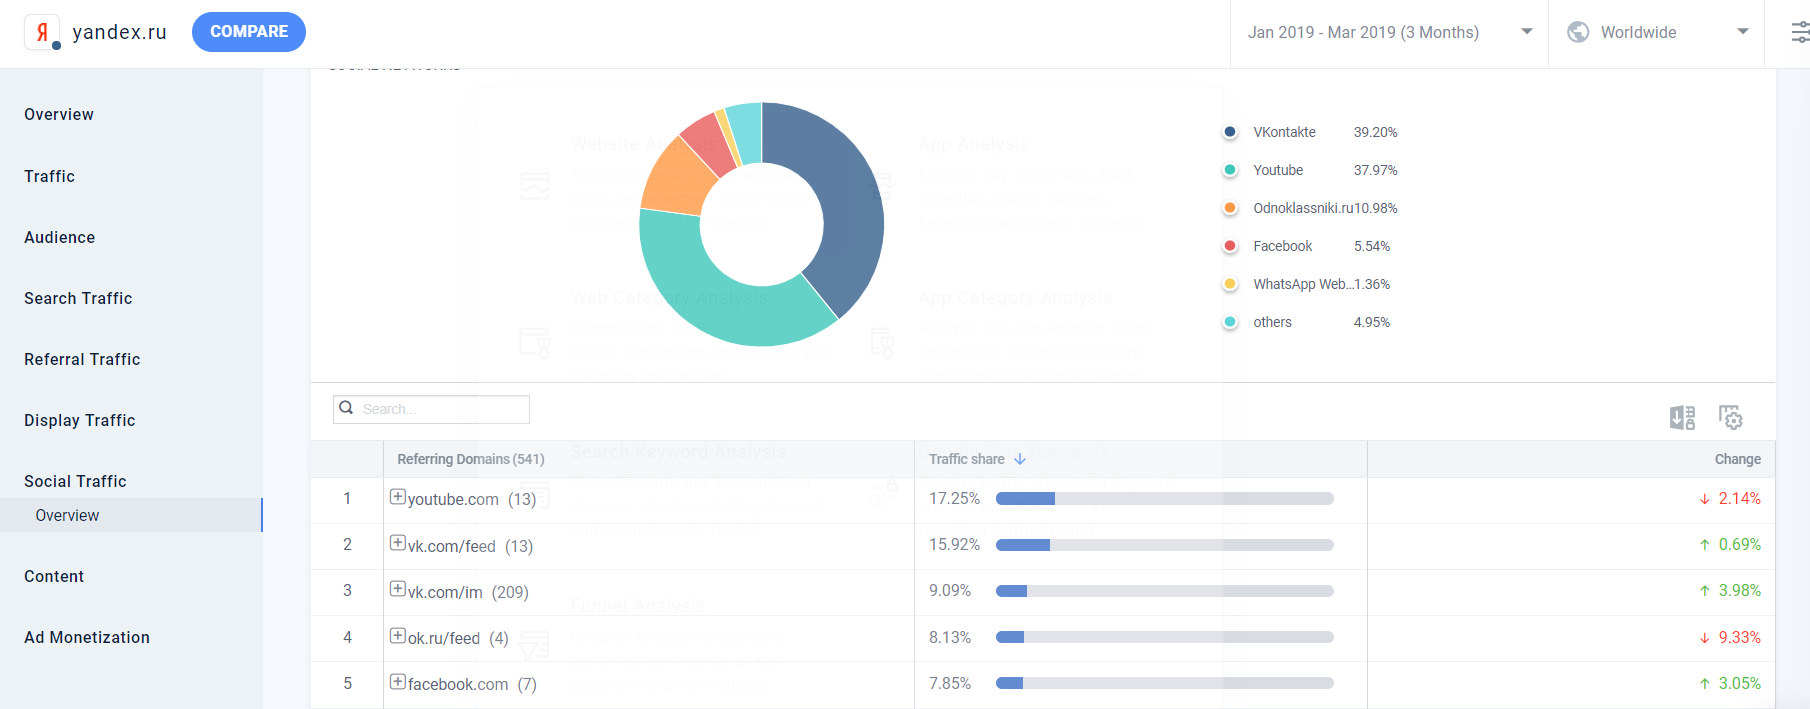
Here we see from which social networks traffic comes and what is its share. In Yandex, VK and YouTube prevail.
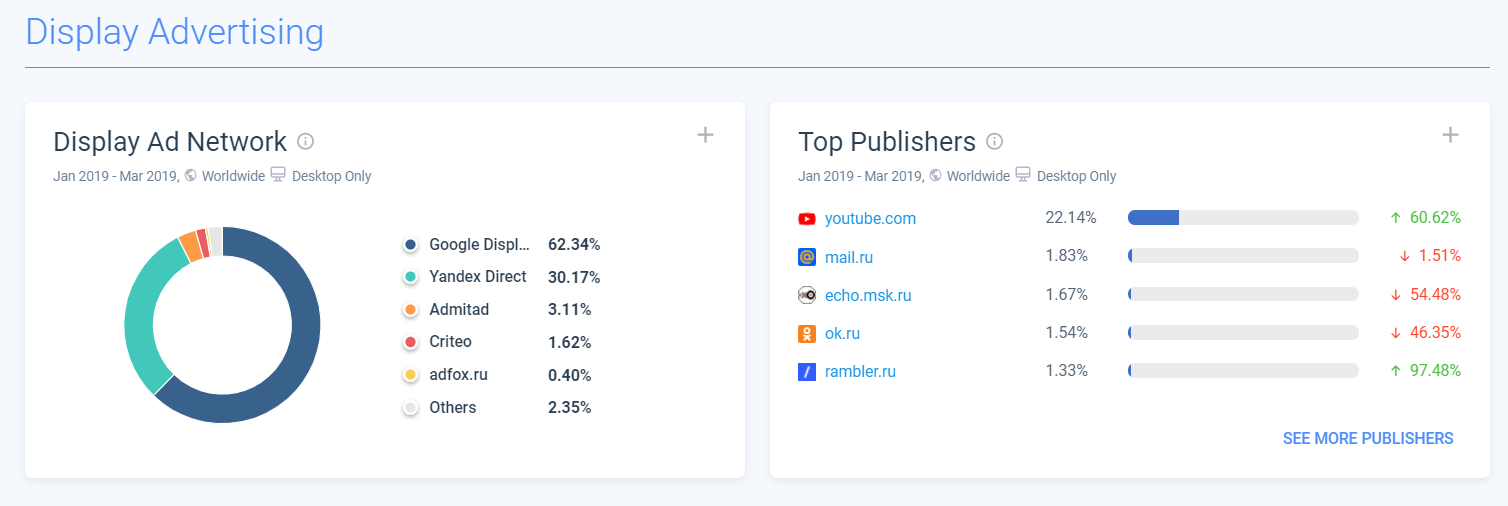
Here we look which media networks and publishers bring the main traffic.
As a result, we sorted the dashboard on the main page, which contains brief data.
Using even this data alone, you can understand a lot about site traffic.
Now let's dig into the analysis and see what else we can get.
To do this, look at the left column.
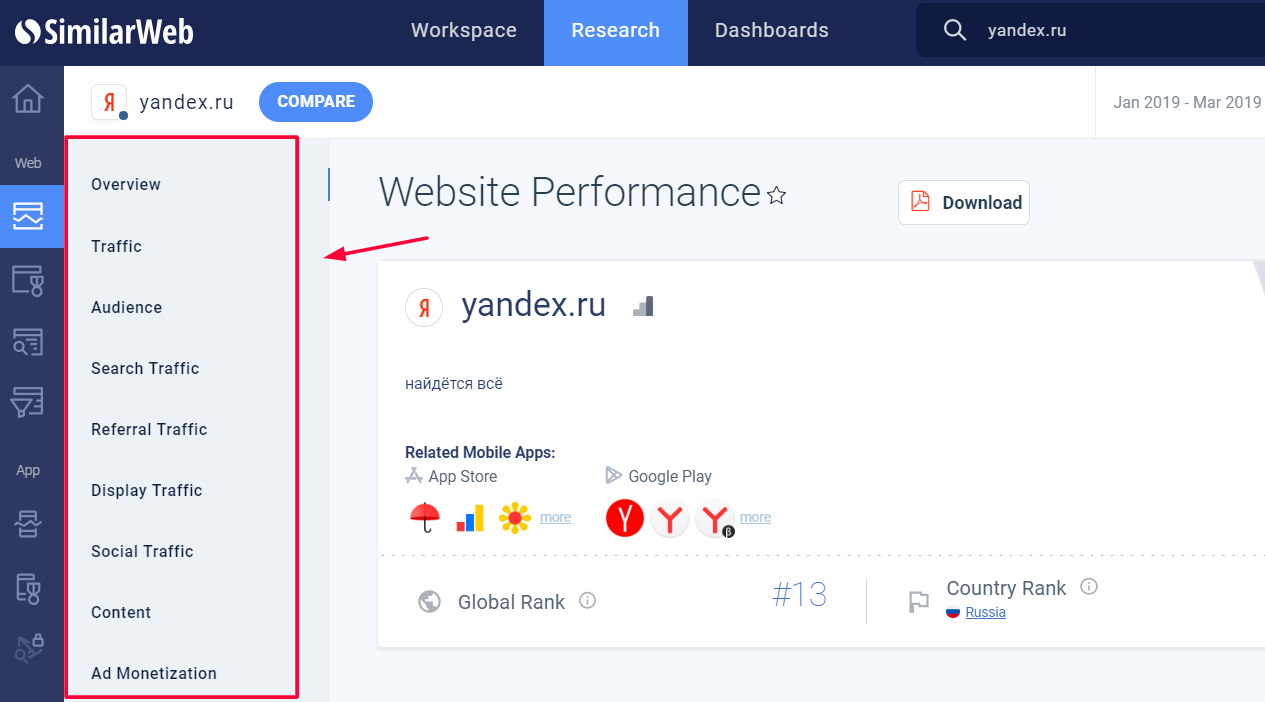
What sections are there:
Traffic - more about traffic
Audience - analysis of the audience
Search Traffic - search traffic
Referral Traffic - referral traffic
Display Traffic - media traffic
Social - in more detail about social networks
Content - (section closed for the demo version )
Let's take a look at each of them in more detail.
1. Traffiic
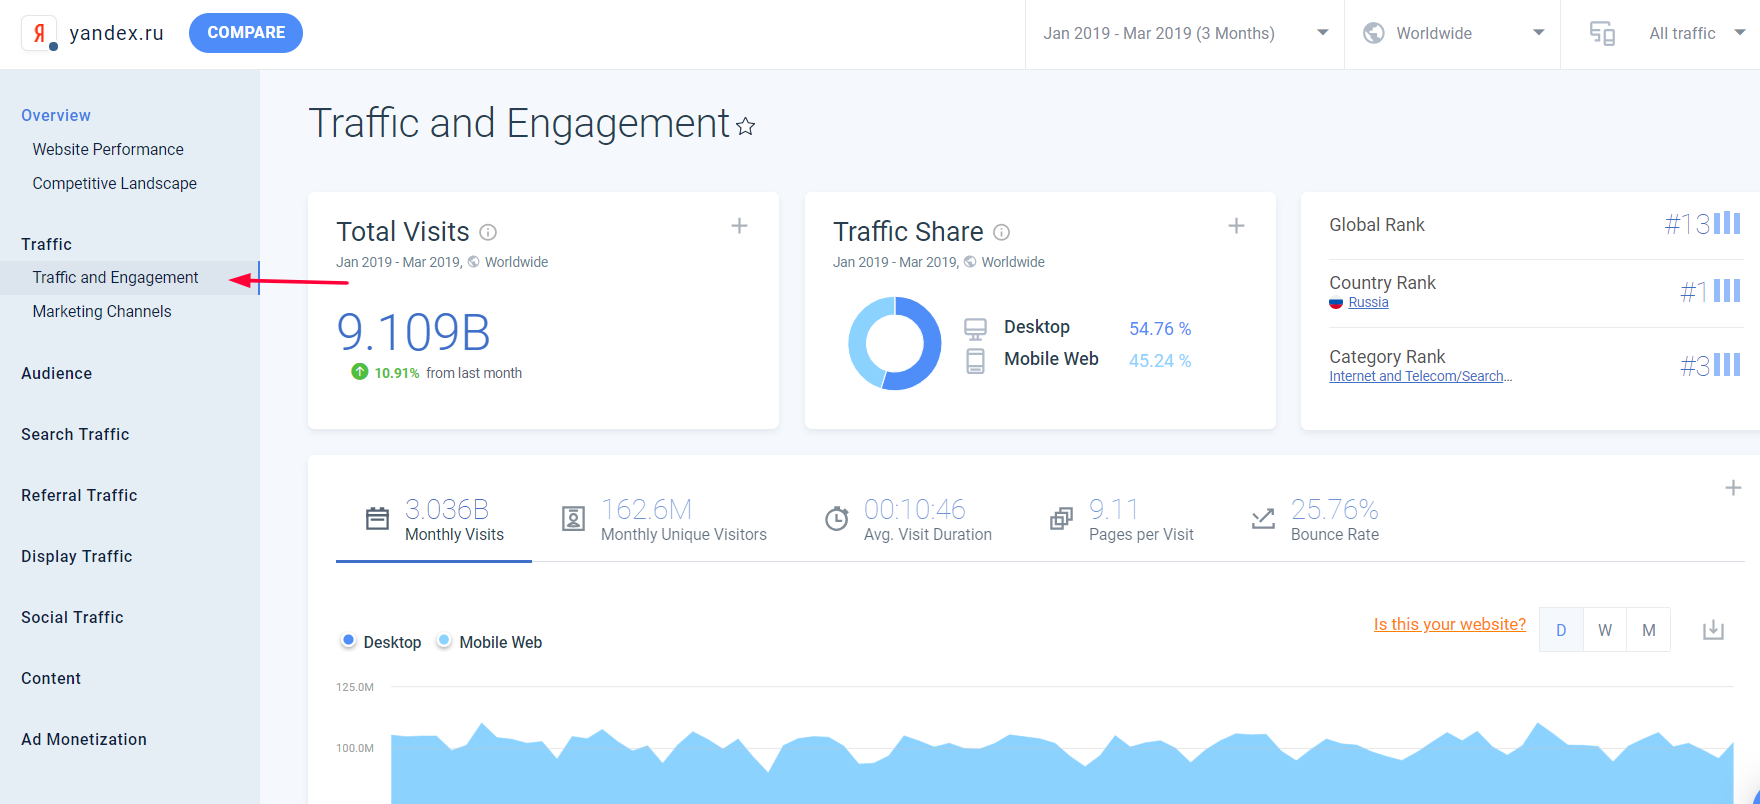
And his first point is Traffic and Engagement
In this section you can see the dynamics of traffic, loyalty indicators by day, week and month.
Key indicators of loyalty:% bounce rate, average pageview time and pageviews per session.
For example, how the failure rate for 3 months changes, etc.
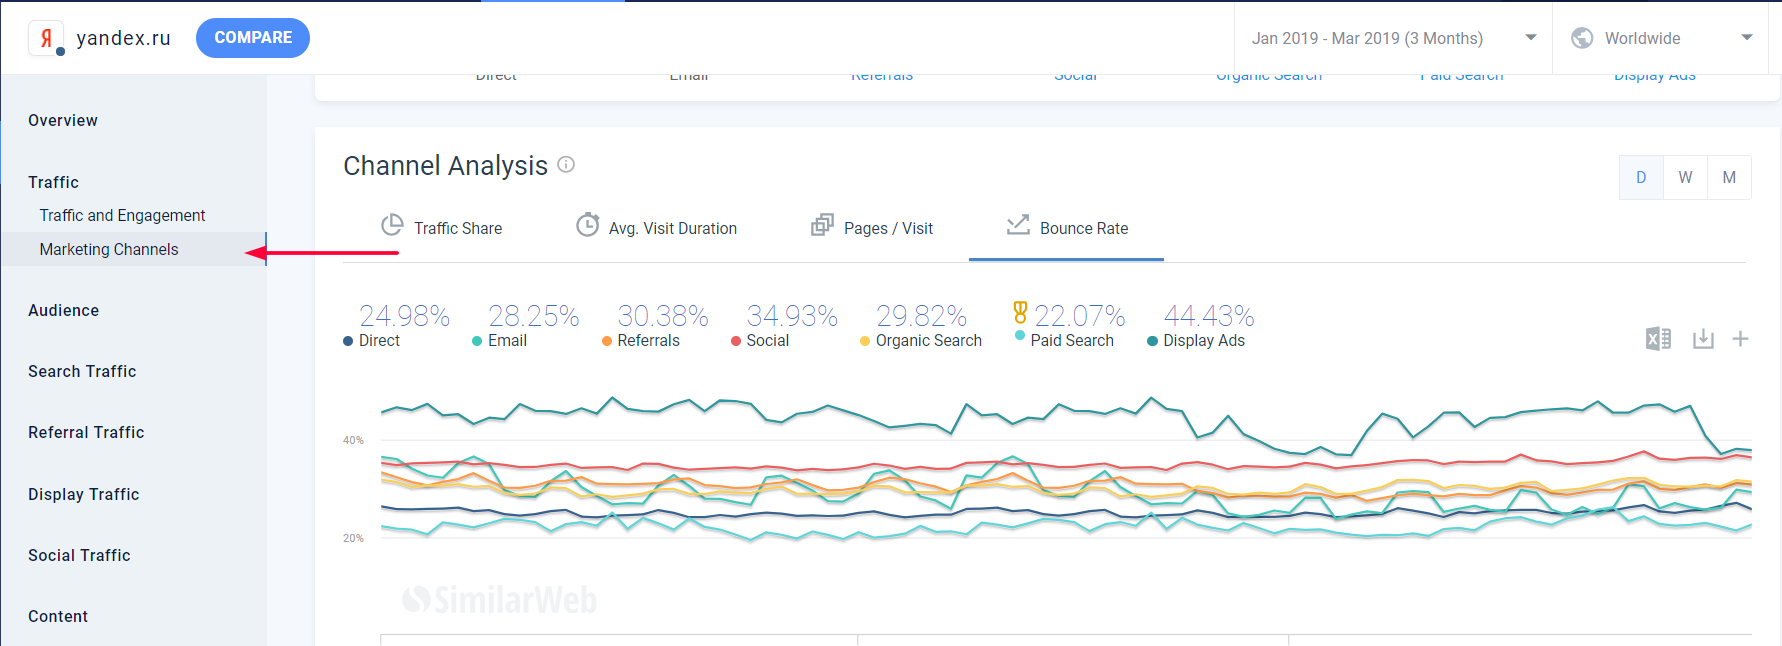
Second point - Marketing Channels
Here is the statistics for the channels. The data here are the same as we saw on the main dashboard, but broken down by month.
We proceed to the next section.
2. Audience
In this block we will be able to study the audience of the site in more detail.
Site geography
This section shows which country traffic is coming from and what its indicators are.
Yandex receives 81.64% of traffic from Russia, in the second place is the United States.

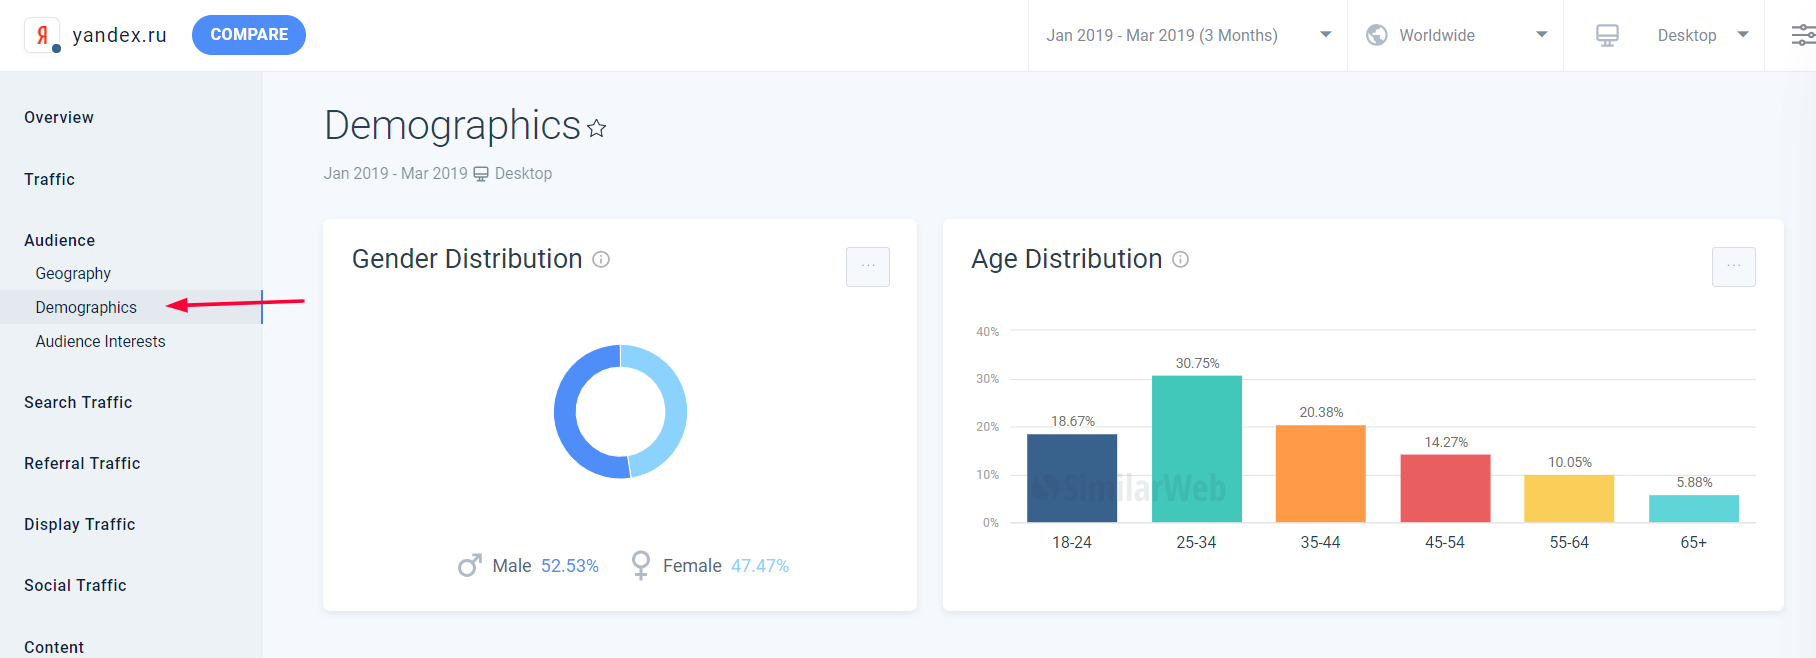
Demography
This column will answer the question: who is the audience of the site, its gender and age.
Mostly equally husbands and women go to Yandex, the age of 25-34 years prevails.
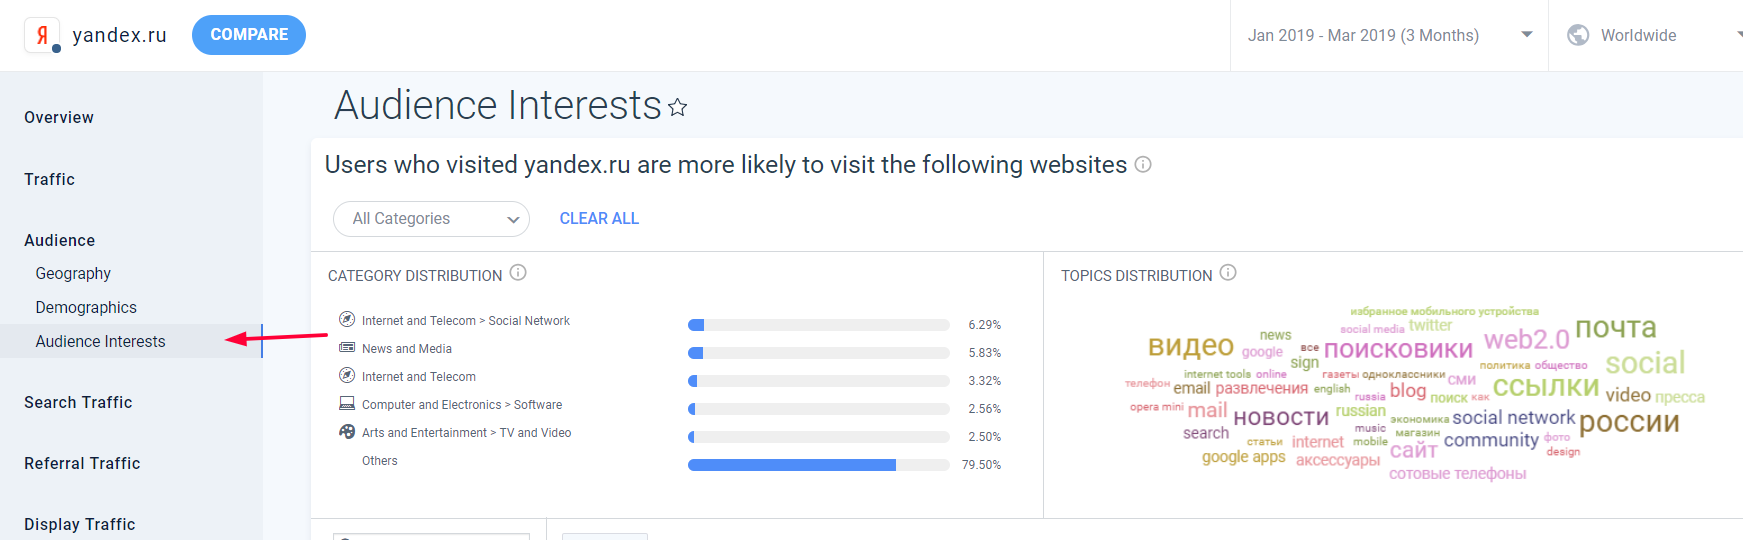
Interests
This section will show what the audience is interested in.
The analysis of interests is incomplete, but you can see the main categories.
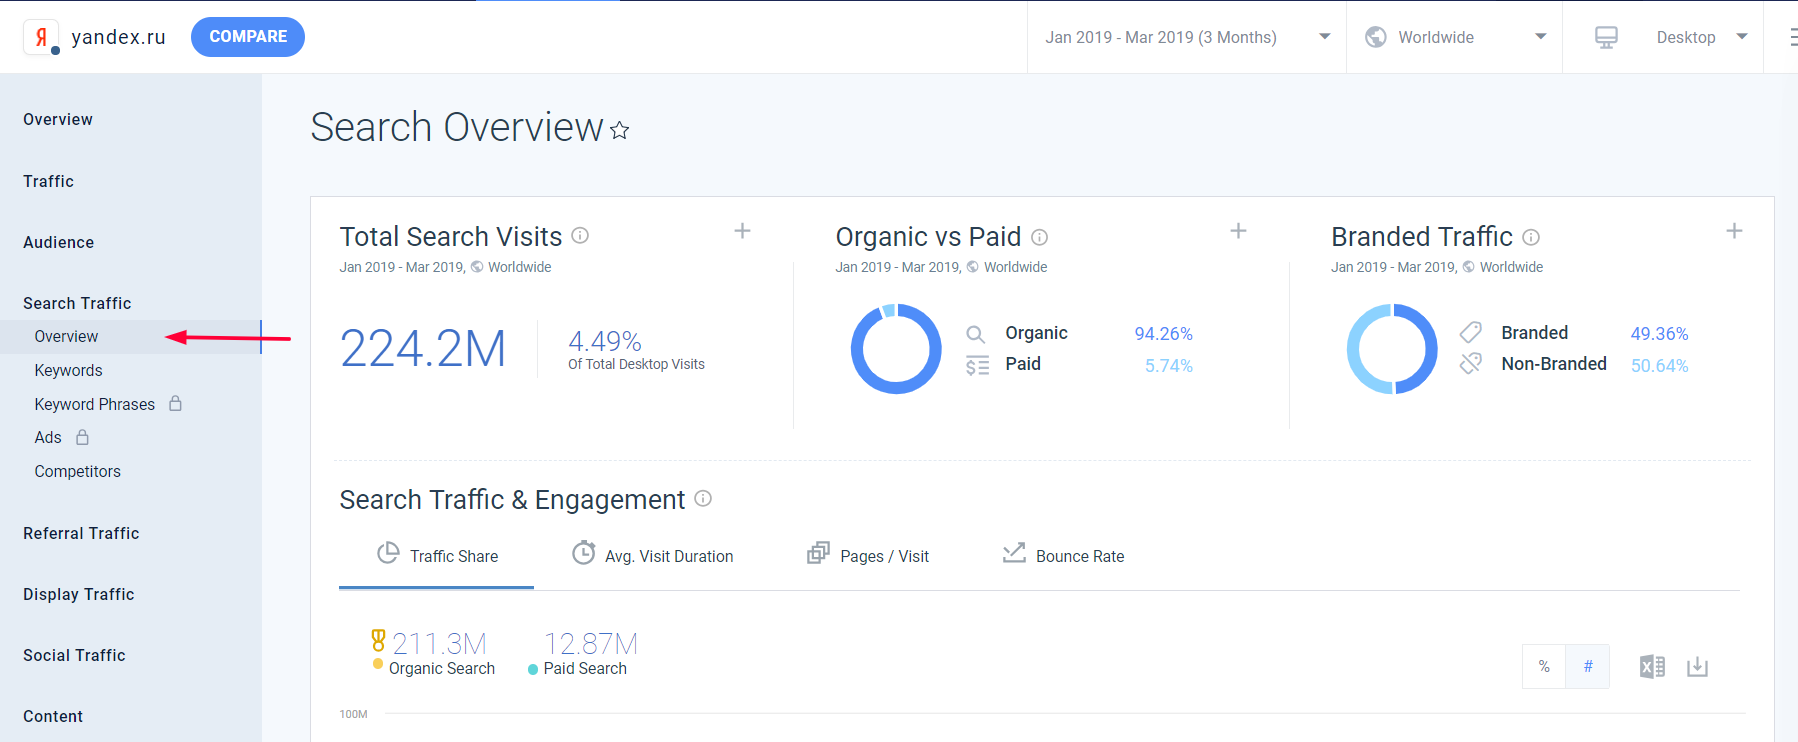
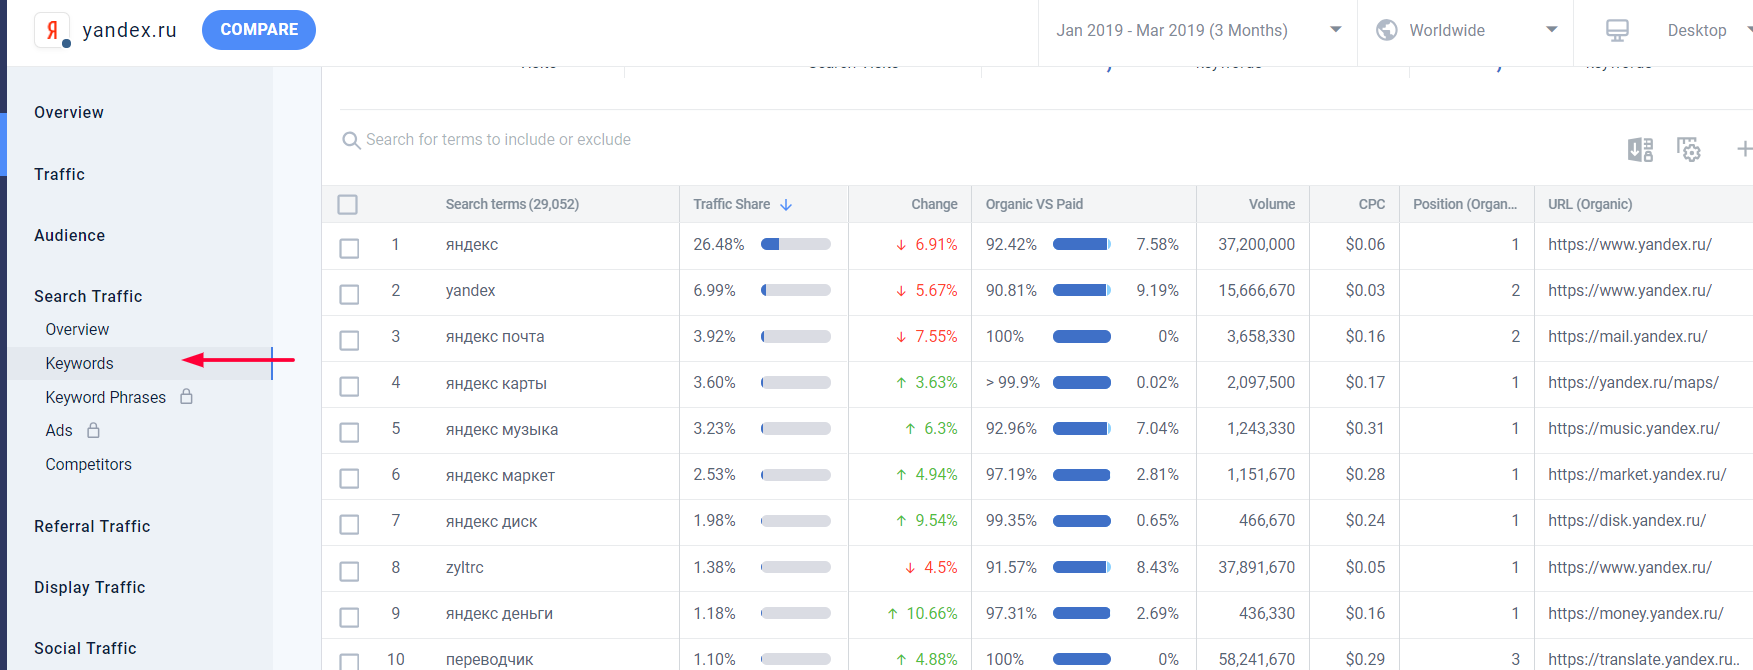
3. Search Traffic - search traffic
Here you can find out which traffic prevails: organic or paid.
What is the ratio of brand and non-brand traffic.
Here you can study the keywords that go to the site and find out which pages.
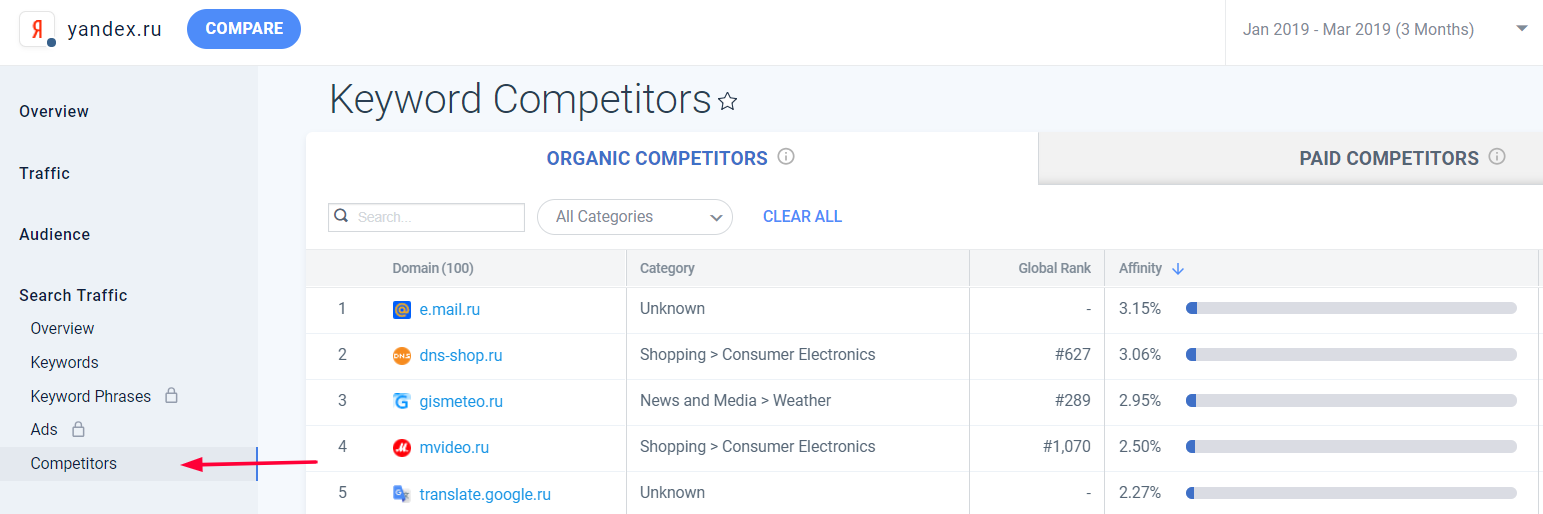
Section Competitors
This section will help to find out the main competitors in the search results.
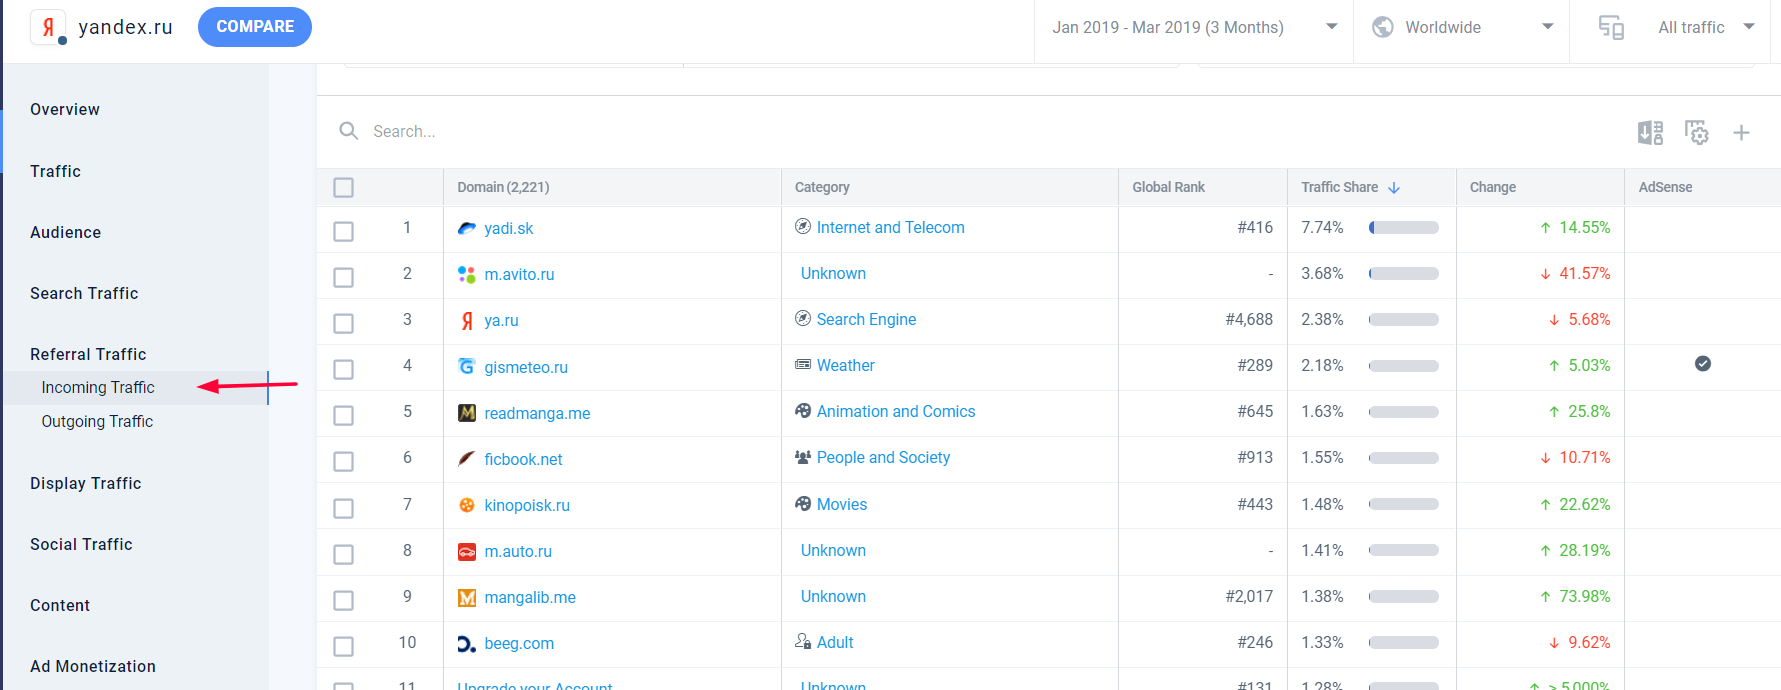
4. Referral Traffic
This block shows which sites are receiving traffic from.
You can study the dynamics of transitions (traffic from sites decreases or grows).
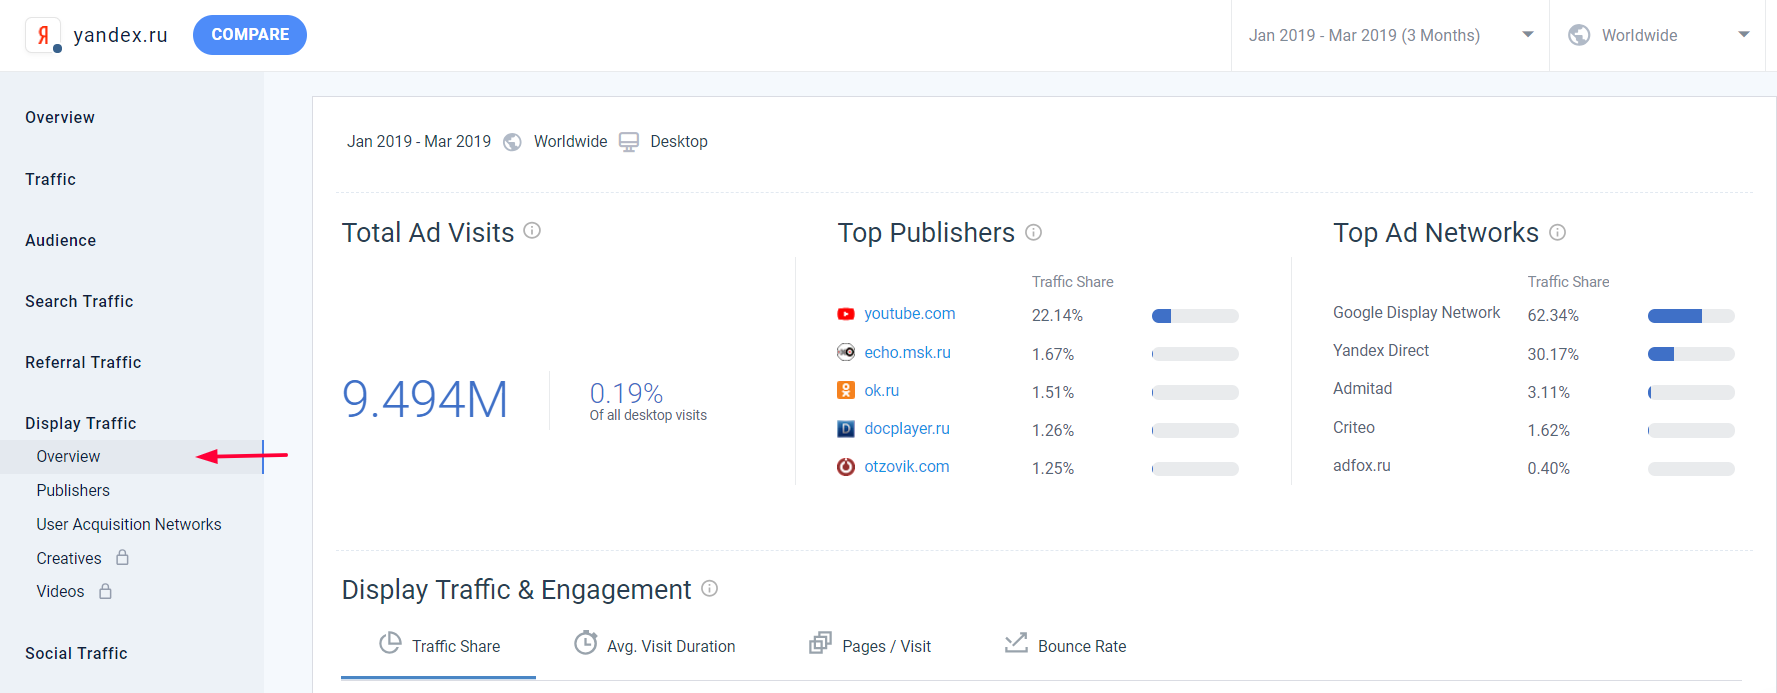
5. Display Traffic
This section will help you understand how display advertising works and what its main sources are.
6. Social
Section for a detailed study of traffic from social networks.
There is an opportunity to analyze the social network you need.
That's it! On this we have completed the analysis of the site.
The data obtained will be sufficient for basic analysis.
Let's now see what a service for analyzing mobile applications can offer us.
Mobile app analysis
The functionality in the demo version is greatly reduced, so I'll show you what we can get.
There are 2 ways to get into the analysis of the application:
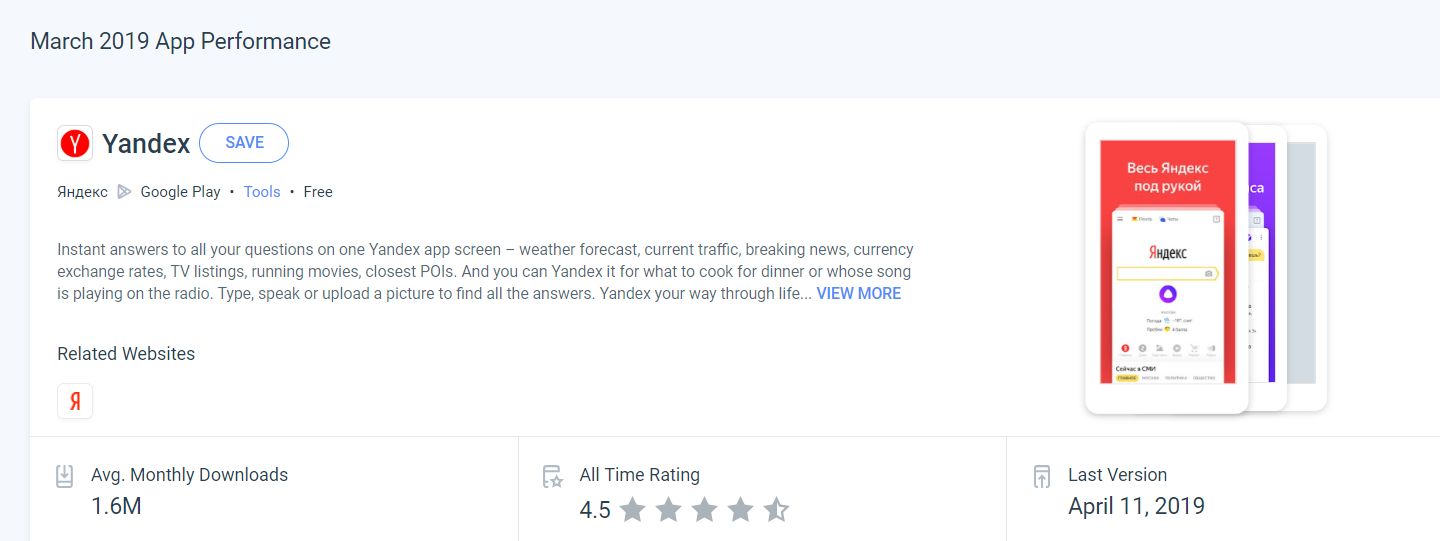
1. The total number of installations, version of the application and rating (this data can be found in open sources).
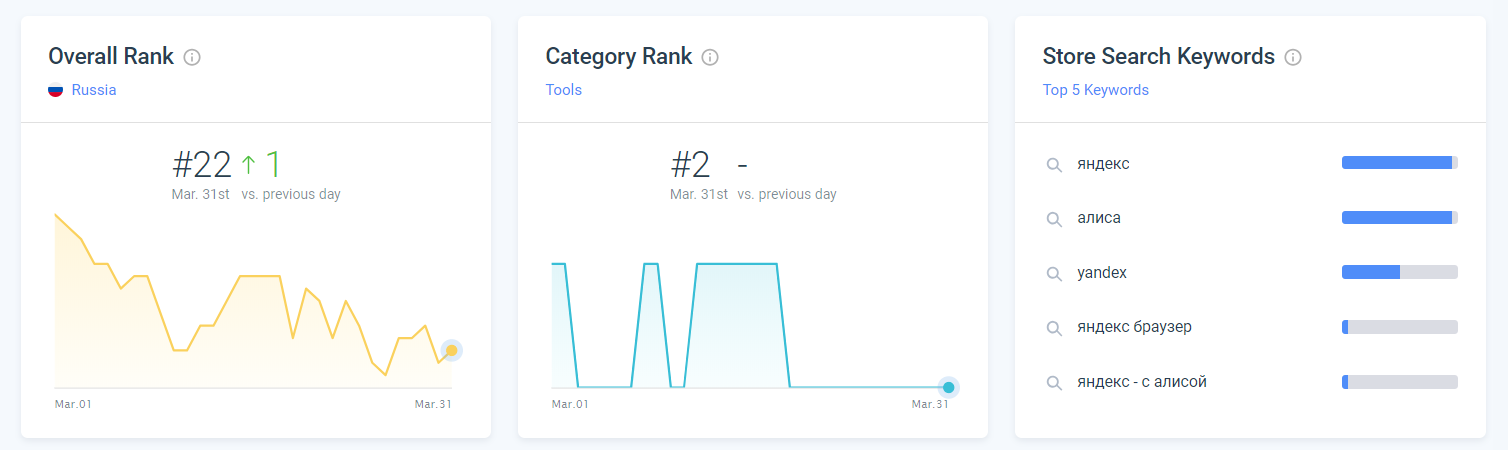
2. The dynamics of the overall rating, the rating of the application in the category and the search queries for which the application is searched.
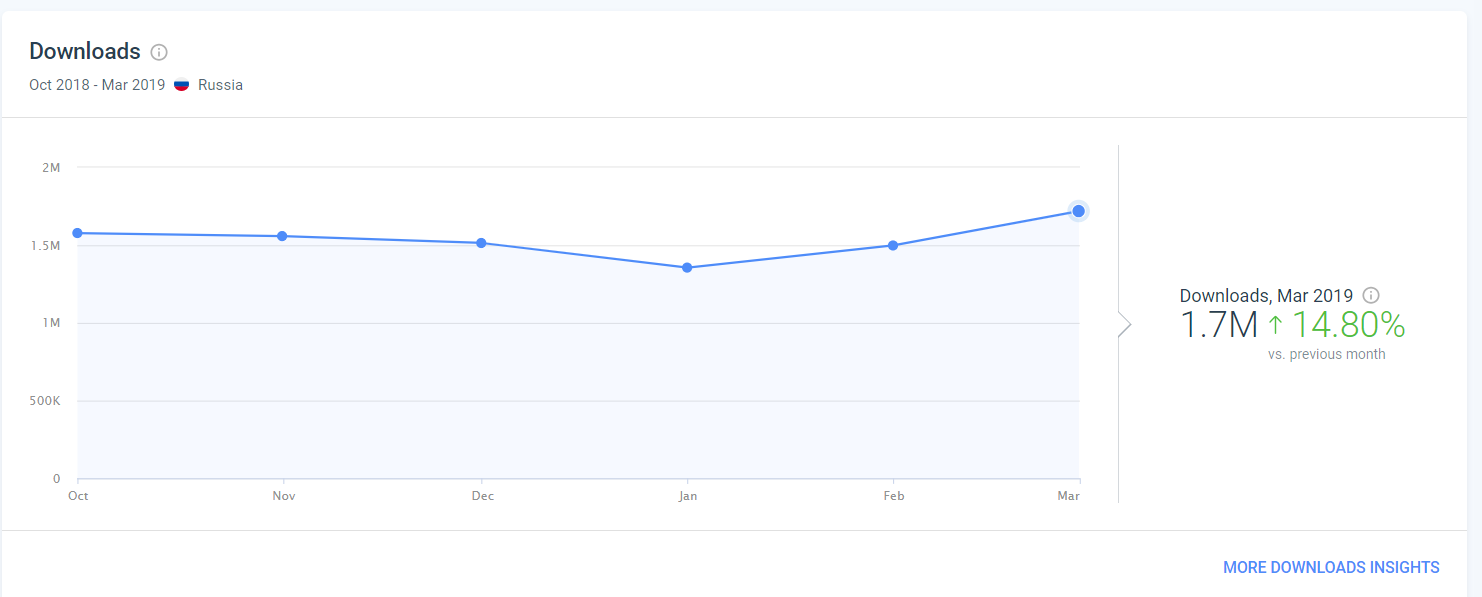
3. Install the application by month.
The system shows a schedule of installations for the last 6 months, you can track the dynamics of interest in the application.
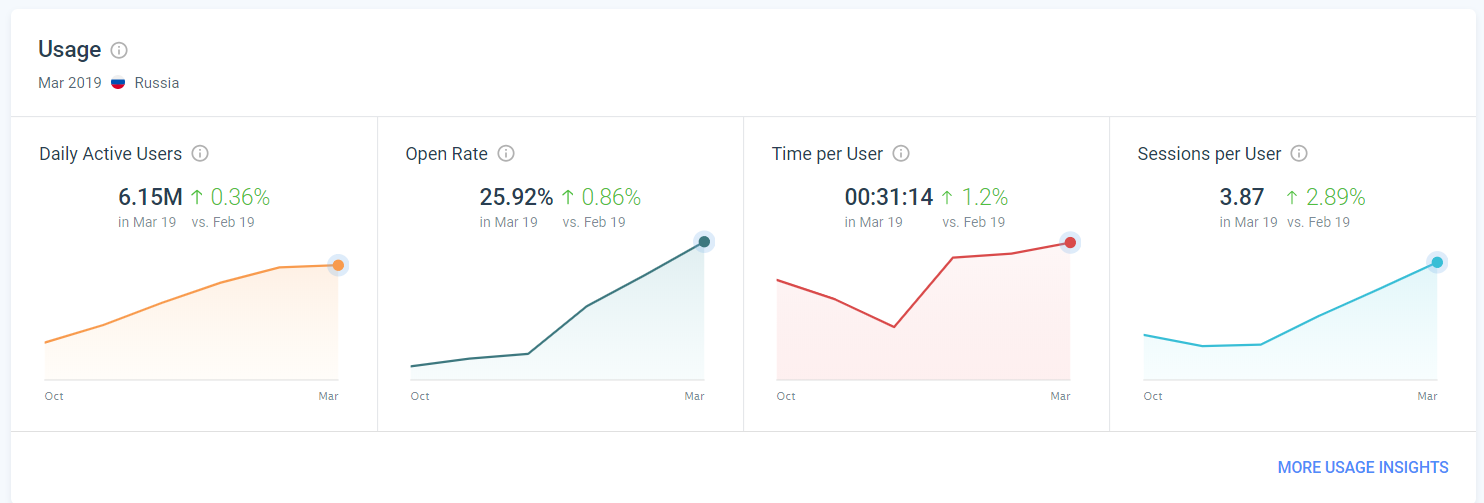
4. Using the application.
The section contains data on daily active users, application opening, usage time and session per user.
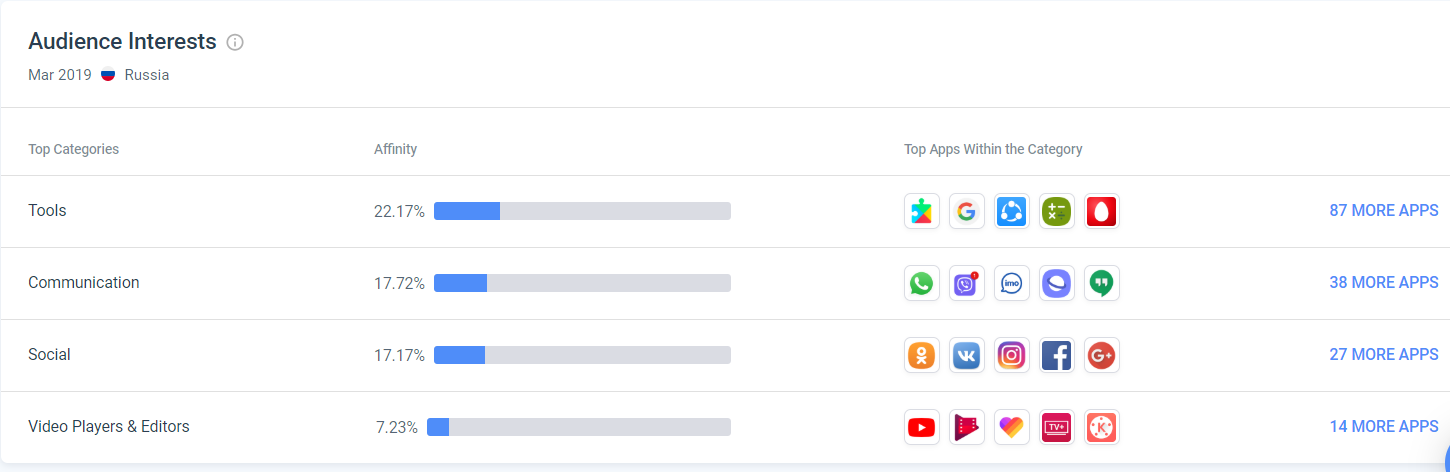
5. The interests of the audience.
This section shows which categories of interests the audience of the application has, and with whom this application competes in each of the categories.
This is where we finish the study of the service.
Subscribe to my telegram channel (@proroas), I write about marketing, services and analytics. About what I use in my work myself.