Nginx log analytics using Amazon Athena and Cube.js
- Transfer
- Tutorial
Typically, Nginx uses commercial products or open-source alternatives, such as Prometheus + Grafana, to monitor and analyze Nginx performance. This is a good option for monitoring or real-time analytics, but not too convenient for historical analysis. On any popular resource, the amount of data from nginx logs is growing rapidly, and it is logical to use something more specialized to analyze a large amount of data.
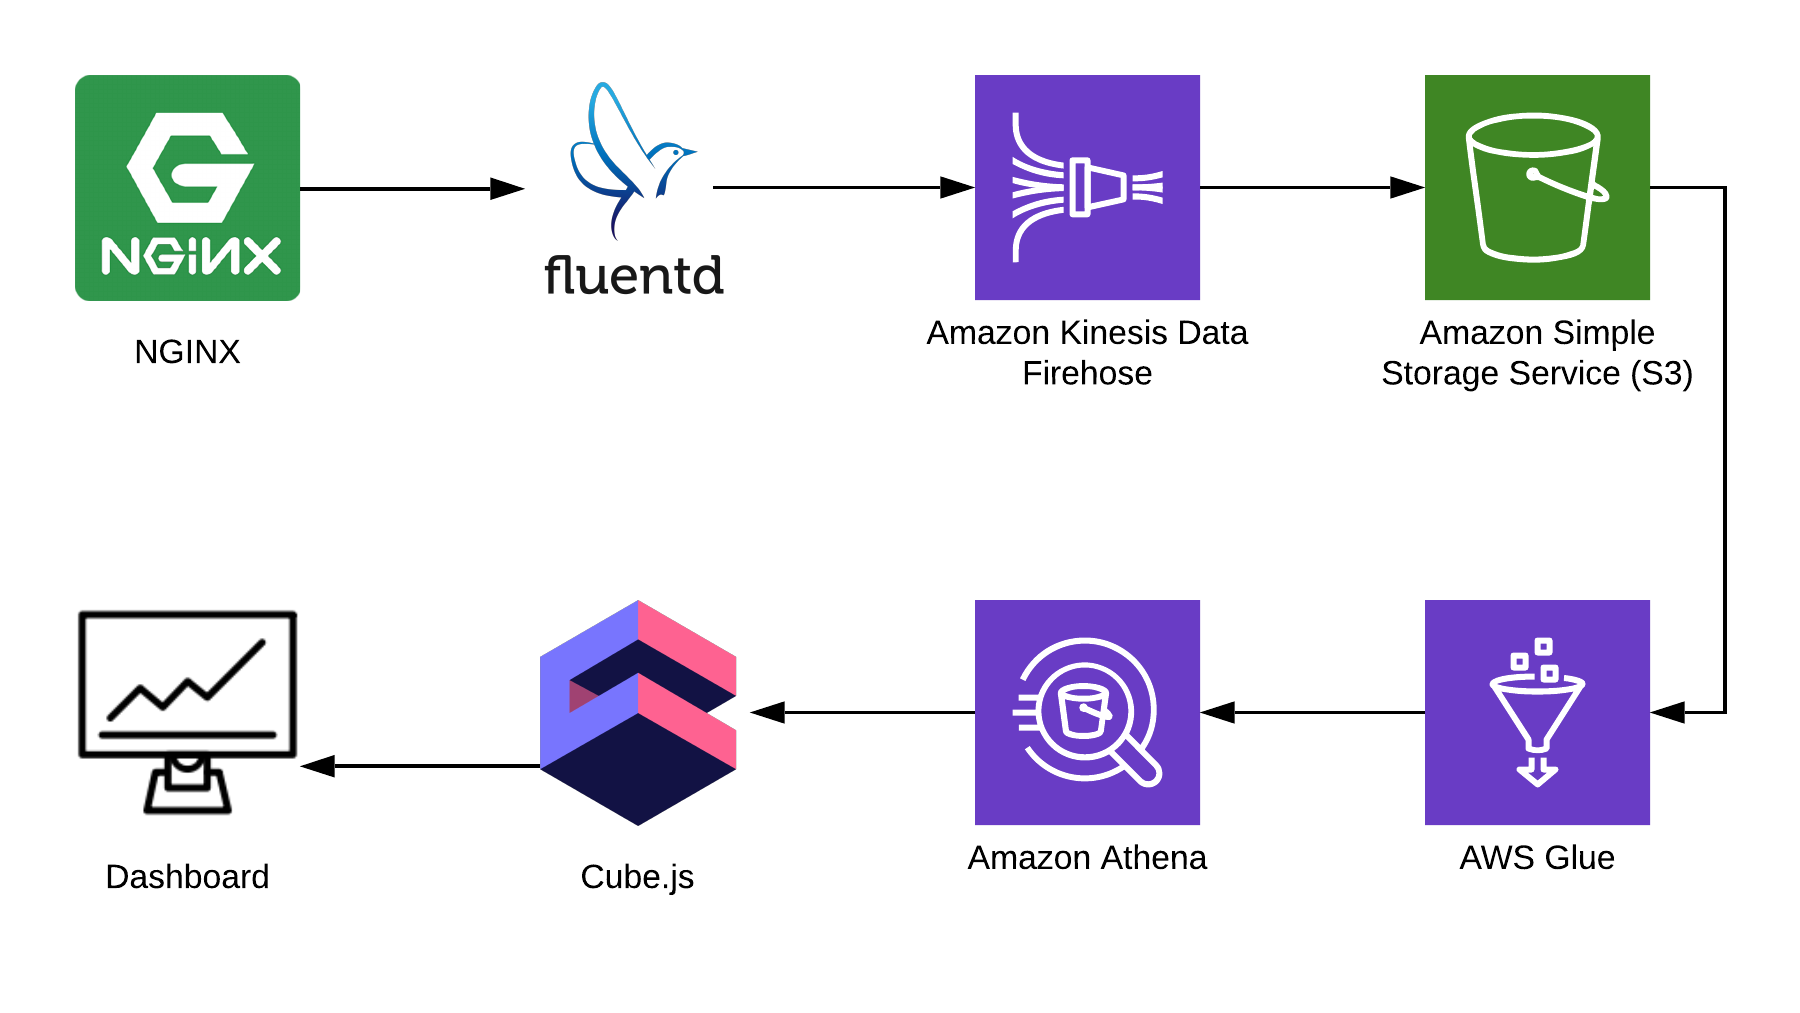
In this article I will tell you how to use Athena to analyze logs using Nginx as an example, and show how to compile an analytical dashboard from this data using the open-source cube.js framework . Here is the complete solution architecture:
TL: DR;
Link to the finished dashboard .
We use Fluentd to collect information , AWS Kinesis Data Firehose and AWS Glue for processing, and AWS S3 for storage . Using this bundle, you can store not only nginx logs, but also other events, as well as logs of other services. You can replace some parts with similar parts for your stack, for example, you can write logs to kinesis directly from nginx, bypassing fluentd, or use logstash for this.
Collecting Nginx Logs
By default, Nginx logs look something like this:
4/9/2019 12:58:17 PM1.1.1.1 - - [09/Apr/2019:09:58:17 +0000] "GET /sign-up HTTP/2.0" 200 9168 "https://example.com/sign-in""Mozilla/5.0 (Macintosh; Intel Mac OS X 10_14_4) AppleWebKit/537.36 (KHTML, like Gecko) Chrome/73.0.3683.86 Safari/537.36""-"
4/9/2019 12:58:17 PM1.1.1.1 - - [09/Apr/2019:09:58:17 +0000] "GET /sign-in HTTP/2.0" 200 9168 "https://example.com/sign-up""Mozilla/5.0 (Macintosh; Intel Mac OS X 10_14_4) AppleWebKit/537.36 (KHTML, like Gecko) Chrome/73.0.3683.86 Safari/537.36""-"
They can be parsed, but it is much easier to fix the Nginx configuration so that it displays logs in JSON:
log_format json_combined escape=json '{ "created_at": "$msec", '
            '"remote_addr": "$remote_addr", '
            '"remote_user": "$remote_user", '
            '"request": "$request", '
            '"status": $status, '
            '"bytes_sent": $bytes_sent, '
            '"request_length": $request_length, '
            '"request_time": $request_time, '
            '"http_referrer": "$http_referer", '
            '"http_x_forwarded_for": "$http_x_forwarded_for", '
            '"http_user_agent": "$http_user_agent" }';
access_log  /var/log/nginx/access.log  json_combined;
S3 for storage
To store the logs, we will use S3. This allows you to store and analyze logs in one place, since Athena can work with data in S3 directly. Later in the article I will tell you how to correctly fold and process the logs, but first we need a clean bucket in S3, in which nothing else will be stored. It’s worthwhile to think in advance in which region you will create the bucket, because Athena is not available in all regions.
Create a diagram in the Athena console
Create a table in Athena for logs. It is needed for both writing and reading, if you plan to use Kinesis Firehose. Open the Athena console and create a table:
CREATEEXTERNALTABLE`kinesis_logs_nginx`(
  `created_at`double,
  `remote_addr`string,
  `remote_user`string,
  `request`string,
  `status`int,
  `bytes_sent`int,
  `request_length`int,
  `request_time`double,
  `http_referrer`string,
  `http_x_forwarded_for`string,
  `http_user_agent`string)
ROWFORMAT SERDE
  'org.apache.hadoop.hive.ql.io.orc.OrcSerde'STOREDAS INPUTFORMAT
  'org.apache.hadoop.hive.ql.io.orc.OrcInputFormat'
OUTPUTFORMAT
  'org.apache.hadoop.hive.ql.io.orc.OrcOutputFormat'
LOCATION
  's3://<YOUR-S3-BUCKET>'
TBLPROPERTIES ('has_encrypted_data'='false');
Create Kinesis Firehose Stream
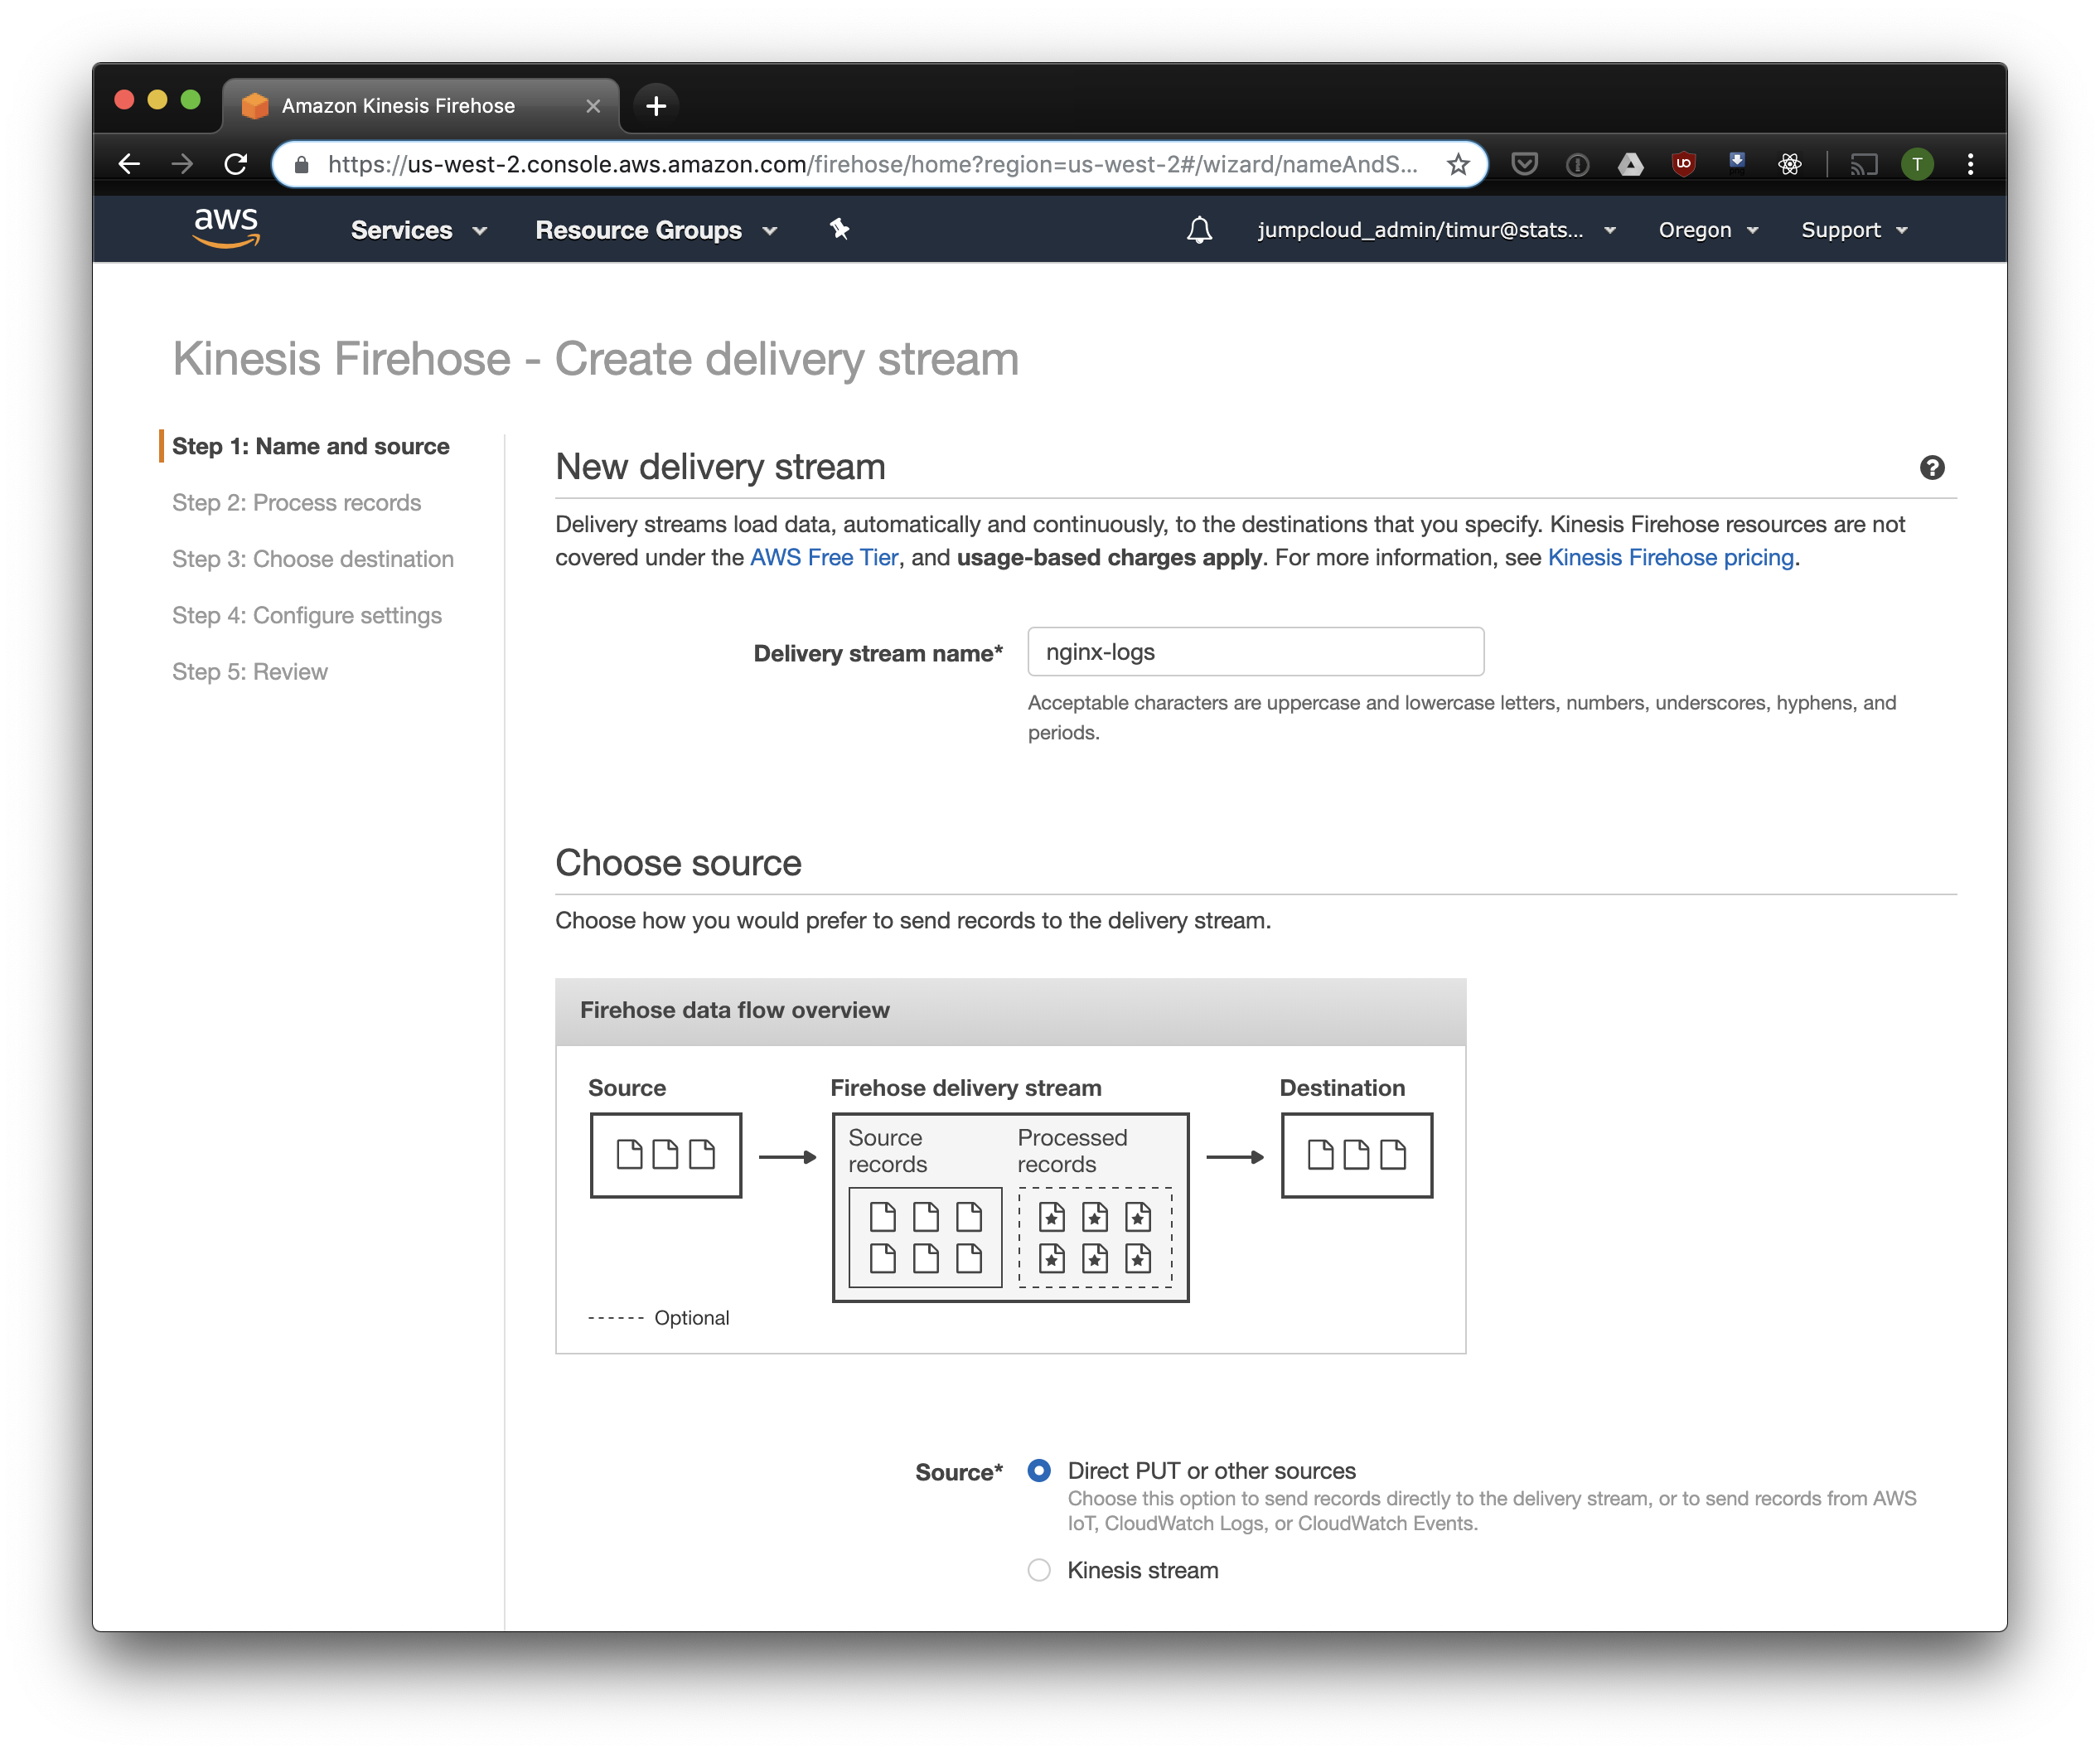
Kinesis Firehose will write the data received from Nginx to S3 in the selected format, divided into directories in the format YYYY / MM / DD / HH. This is useful when reading data. You can, of course, write directly to S3 from fluentd, but in this case you have to write JSON, which is inefficient due to the large file size. Also, when using PrestoDB or Athena, JSON is the slowest data format. So open the Kinesis Firehose console, click "Create delivery stream", select "direct PUT" in the "delivery" field:
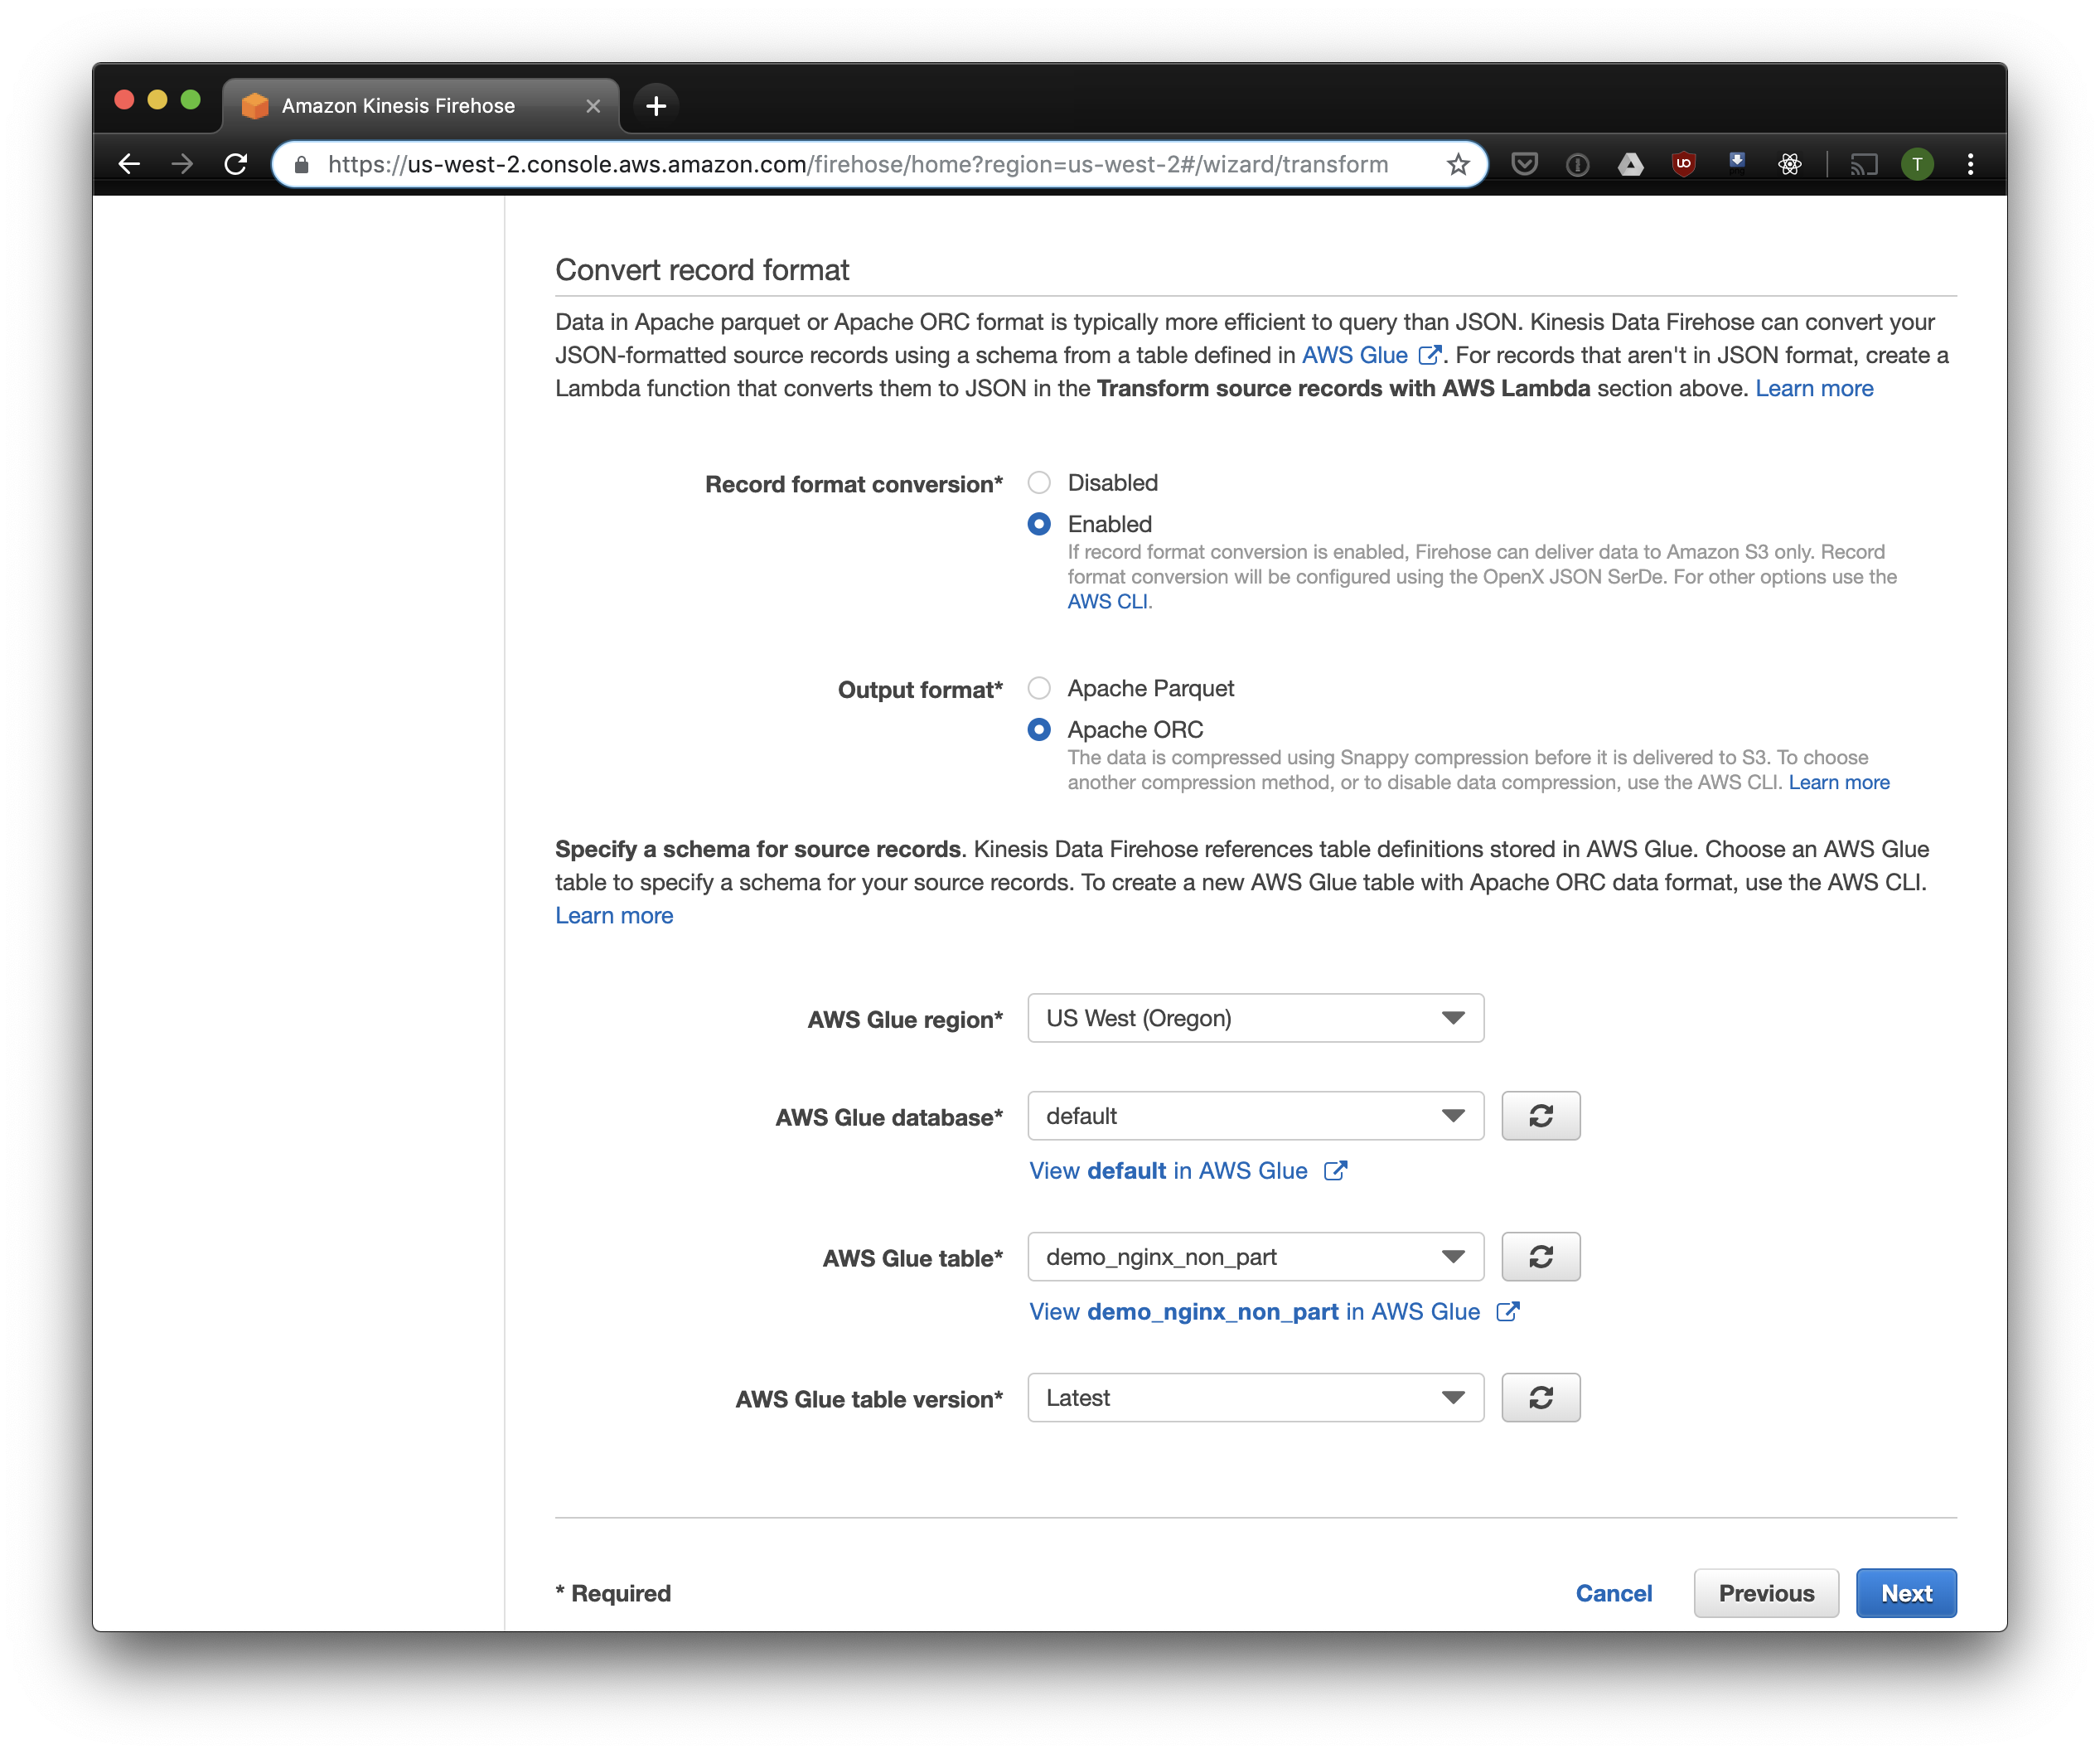
In the next tab, select "Record format conversion" - "Enabled" and select "Apache ORC" as the format for recording. According to some Owen O'Malley , this is the optimal format for PrestoDB and Athena. As a diagram, we indicate the table that we created above. Please note that you can specify any S3 location in kinesis, only the scheme is used from the table. But if you specify a different S3 location, then reading these records from this table will fail.
We choose S3 for storage and the bucket that we created earlier. Aws Glue Crawler, which I will talk about a little later, does not know how to work with prefixes in the S3 bucket, so it is important to leave it empty.

The remaining options can be changed depending on your load, I usually use the default ones. Note that S3 compression is not available, but ORC uses native compression by default.
Fluentd
Now that we have configured the storage and receipt of logs, you need to configure sending. We will use Fluentd because I love Ruby, but you can use Logstash or send logs to kinesis directly. You can start the Fluentd server in several ways, I will talk about docker, because it is simple and convenient.
First, we need the fluent.conf configuration file. Create it and add source:
type forward
port 24224
bind 0.0.0.0
Now you can start the Fluentd server. If you need a more advanced configuration, the Docker Hub has a detailed guide, including how to assemble your image.
$ docker run \
  -d \
  -p 24224:24224 \
  -p 24224:24224/udp \
  -v /data:/fluentd/log \
  -v <PATH-TO-FLUENT-CONF>:/fluentd/etc fluentd \
  -c /fluentd/etc/fluent.conf
  fluent/fluentd:stable
This configuration uses the path /fluentd/logto cache logs before sending. You can do without this, but then when you restart, you can lose everything cached by excessive labor. Any port can also be used, 24224 is the default Fluentd port.
Now that we have Fluentd running, we can send Nginx logs there. We usually run Nginx in a Docker container, in which case Docker has a native log driver for Fluentd:
$ docker run \
--log-driver=fluentd \
--log-opt fluentd-address=<FLUENTD-SERVER-ADDRESS>\
--log-opt tag=\"{{.Name}}\" \
-v /some/content:/usr/share/nginx/html:ro \
-d \
nginx
If you run Nginx differently, you can use the log files, Fluentd has a file tail plugin .
Add the log parsing configured above to the Fluent configuration:
<filterYOUR-NGINX-TAG.*>
  @type parser
  key_name log
  emit_invalid_record_to_error false
  <parse>
    @type json
  </parse></filter>
And sending logs to Kinesis using the kinesis firehose plugin :
<matchYOUR-NGINX-TAG.*>
    @type kinesis_firehose
    region region
    delivery_stream_name <YOUR-KINESIS-STREAM-NAME>
    aws_key_id <YOUR-AWS-KEY-ID>
    aws_sec_key <YOUR_AWS-SEC_KEY></match>
Athena
If you configured everything correctly, then after a while (by default, Kinesis writes the received data every 10 minutes) you should see the log files in S3. In the Kinesis Firehose "monitoring" menu, you can see how much data is written to S3, as well as errors. Remember to give write access to the S3 Bucket for the Kinesis role. If Kinesis wasn’t able to parse something, he will add errors in the same bucket.
Now you can see the data in Athena. Let’s find fresh requests for which we gave errors:
SELECT * FROM"db_name"."table_name"WHEREstatus > 499ORDERBY created_at DESClimit10;Scan all records for each request
Now our logs are processed and stacked in S3 in ORC, compressed and ready for analysis. Kinesis Firehose even put them in directories for every hour. However, while the table is not partitioned, Athena will load all-time data for each query, with rare exceptions. This is a big problem for two reasons:
- The amount of data is constantly growing, slowing down queries;
- Athena is billed based on the amount of data scanned, with a minimum of 10 MB for each request.
To fix this, we use AWS Glue Crawler, which will scan the data in S3 and record the partition information in the Glue Metastore. This will allow us to use partitions as a filter for requests in Athena, and it will only scan directories specified in the request.
Customize Amazon Glue Crawler
Amazon Glue Crawler scans all data in an S3 bucket and creates partition tables. Create a Glue Crawler from the AWS Glue console and add the bucket in which you store the data. You can use one crawler for several buckets, in this case it will create tables in the specified database with names that match the names of buckets. If you plan to use this data all the time, be sure to adjust the Crawler launch schedule to suit your needs. We use one Crawler for all tables, which runs every hour.
Partitioned Tables
After the crawler is first launched, the database for each scanned bucket should appear in the database specified in the settings. Open the Athena console and find the table with the Nginx logs. Let's try to read something:
SELECT * FROM"default"."part_demo_kinesis_bucket"WHERE(
  partition_0 = '2019'AND
  partition_1 = '04'AND
  partition_2 = '08'AND
  partition_3 = '06'
  );
This query will select all records received from 6 a.m. to 7 a.m. on April 8, 2019. But how much more efficient is this than just reading from a non-partitioned table? Let's find out and select the same records by filtering them by timestamp:
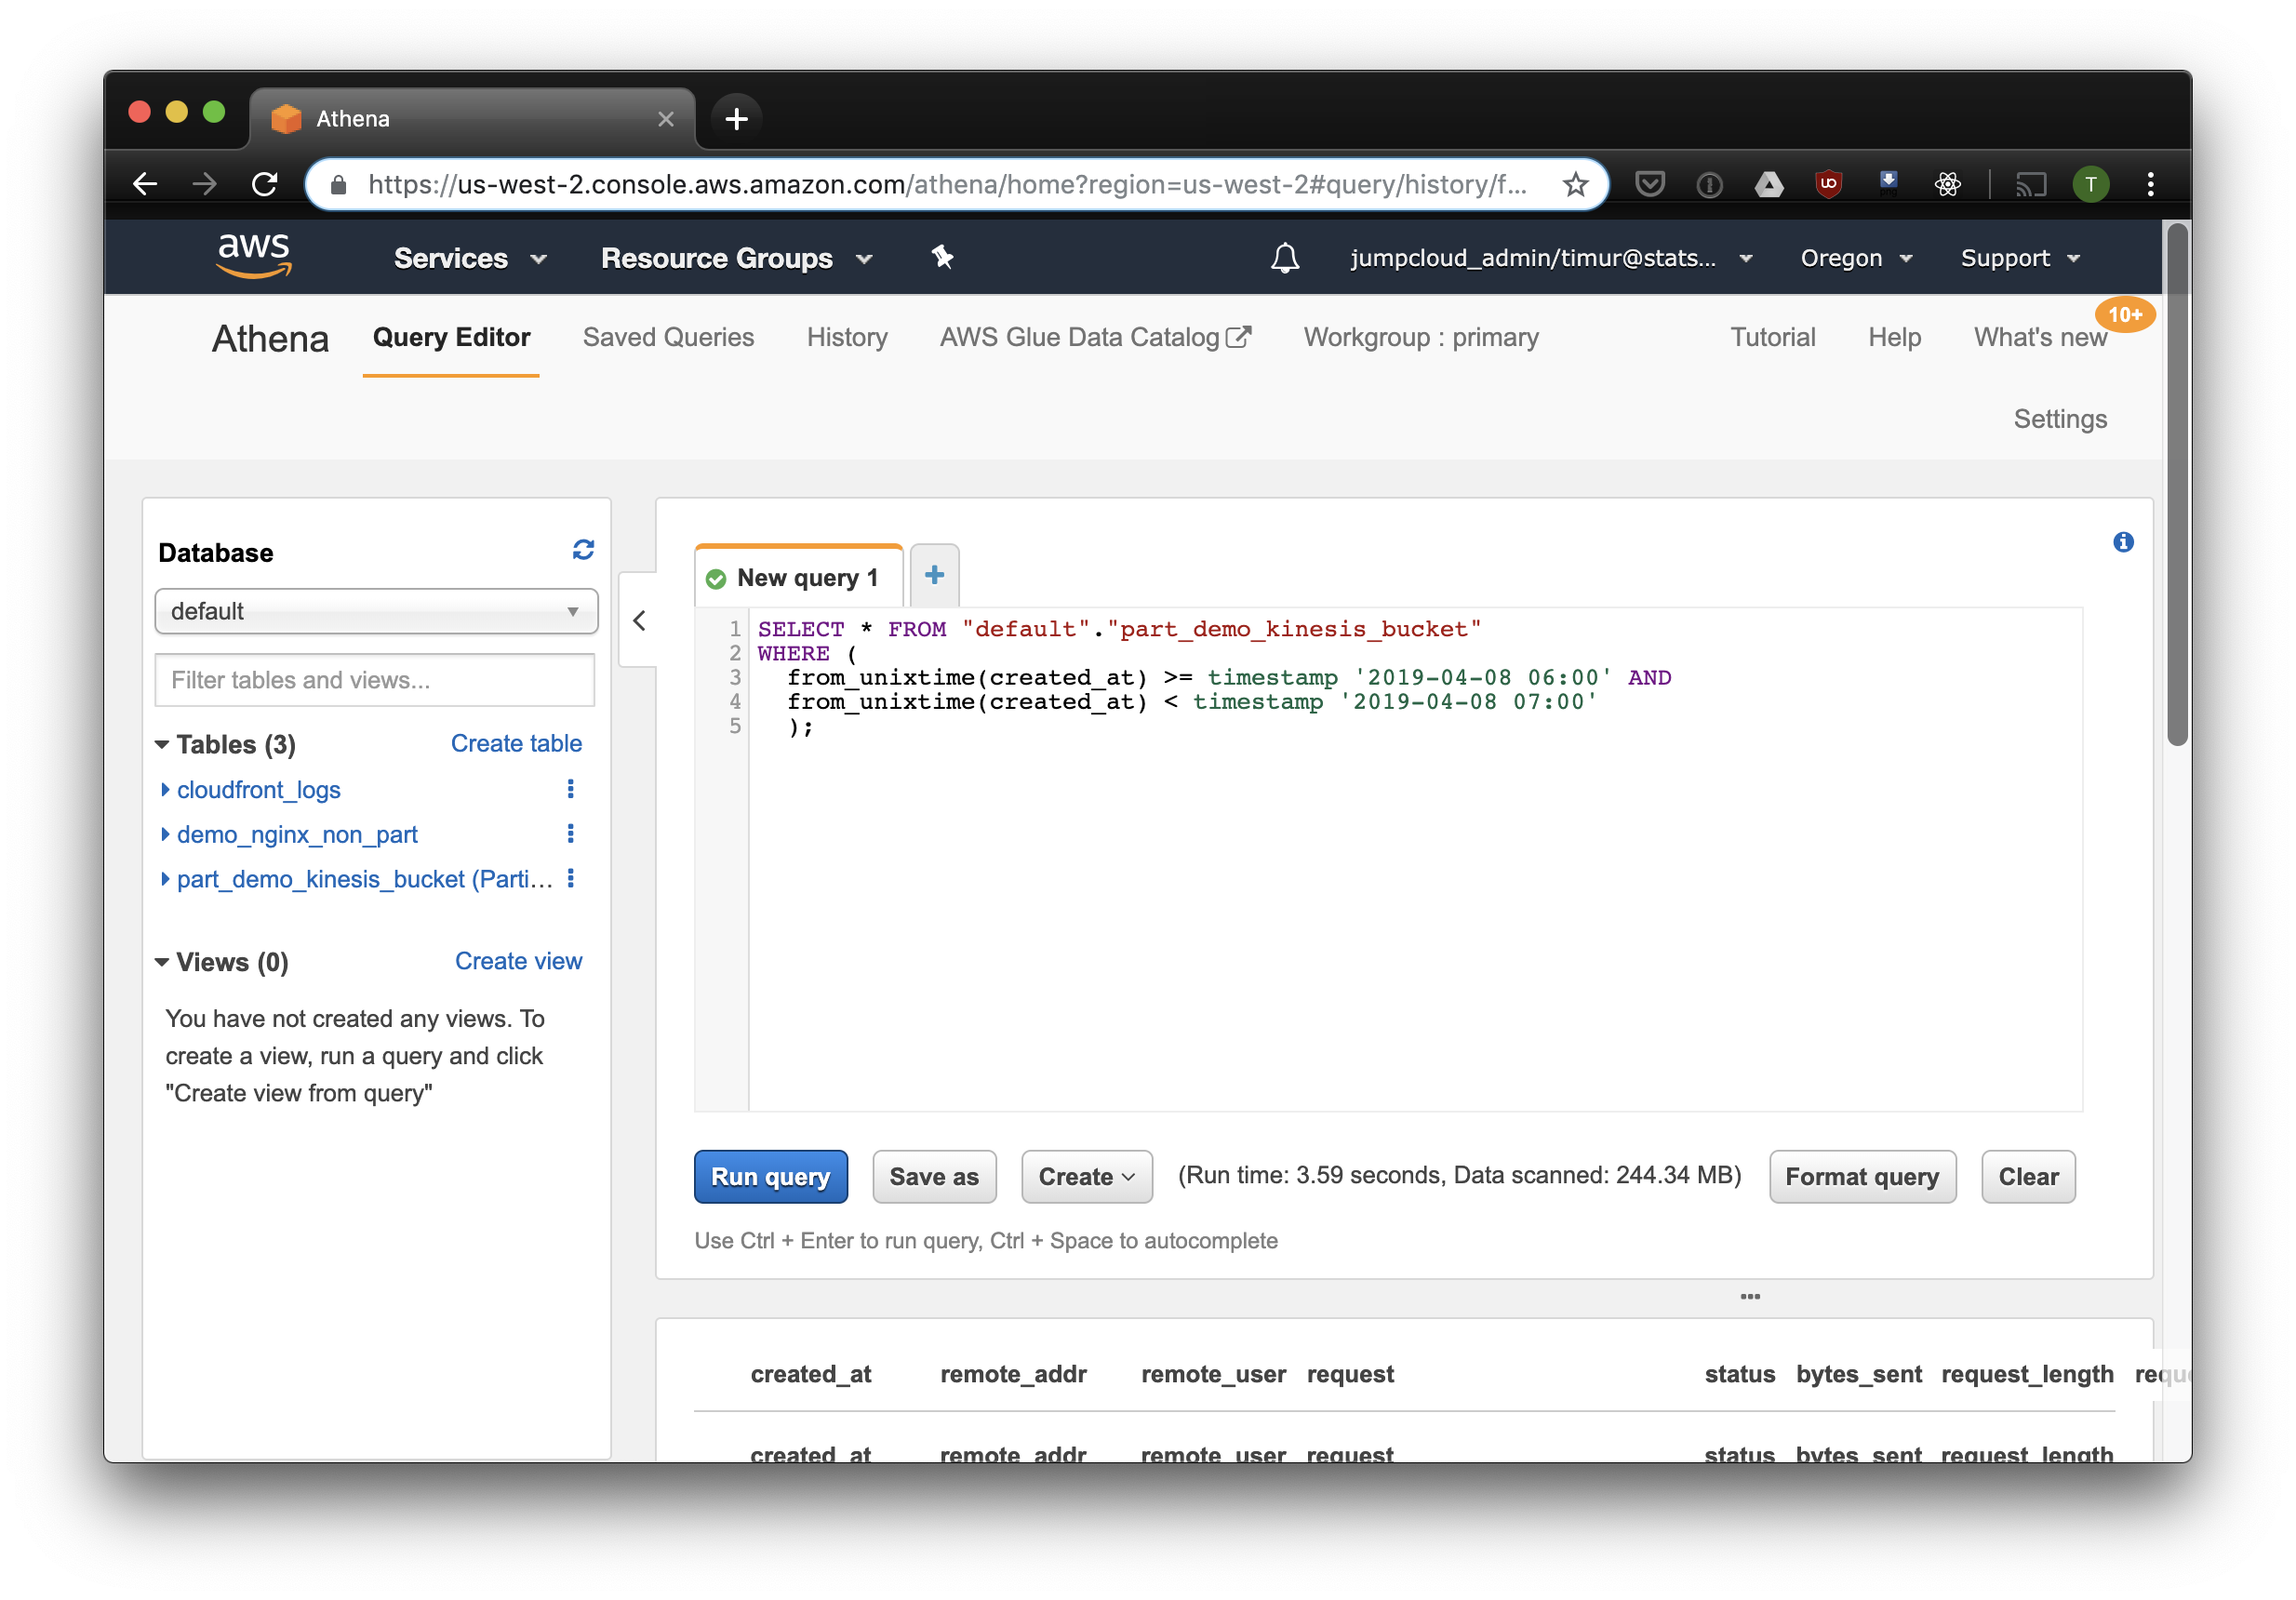
3.59 seconds and 244.34 megabytes of data on the dataset, in which there is only a week of logs. Let's try the filter by partitions:
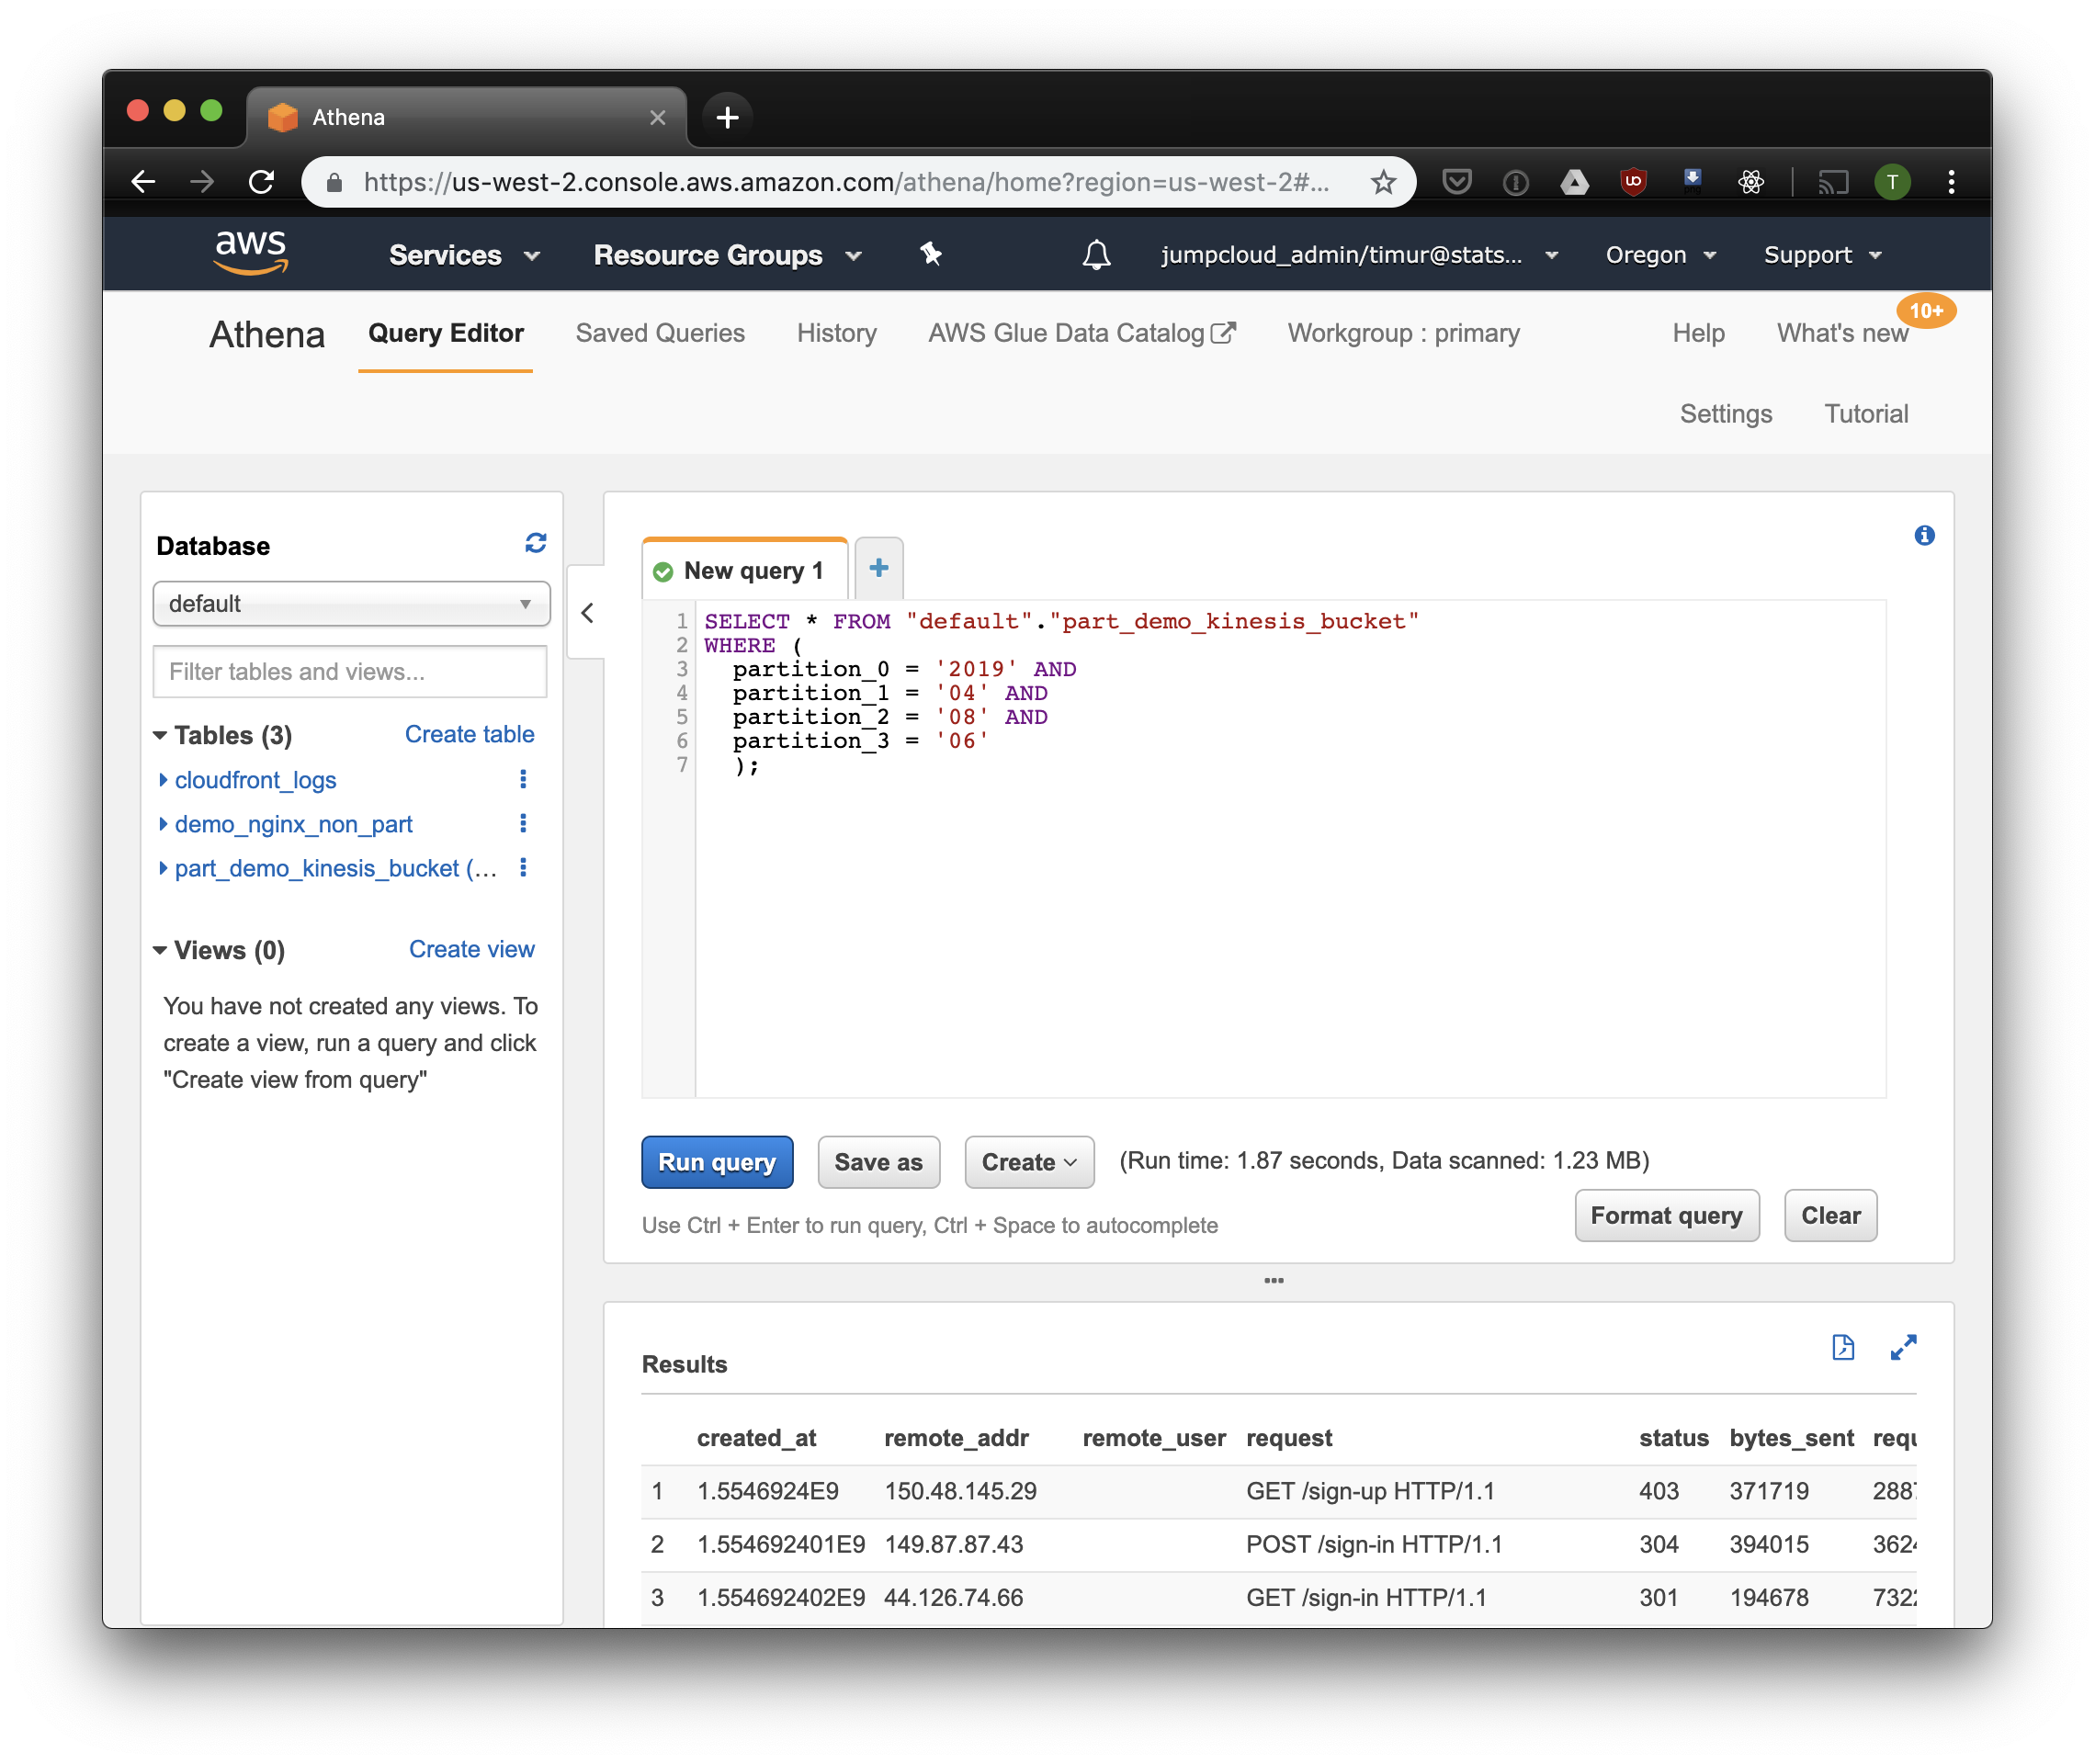
A little faster, but most importantly - only 1.23 megabytes of data! It would be much cheaper if it were not for the minimum 10 megabytes per request in pricing. But it’s much better anyway, and on large datasets the difference will be much more impressive.
Build a dashboard using Cube.js
To build a dashboard, we use the Cube.js. analytic framework. It has quite a few functions, but we are interested in two: the ability to automatically use filters on partitions and pre-aggregation of data. It uses a data schema written in Javascript to generate SQL and execute a database query. All that is required of us is to indicate how to use the partition filter in the data schema.
Let's create a new application Cube.js. Since we already use AWS-stack, it is logical to use Lambda for deployment. You can use the express template for generation if you plan to host the Cube.js backend in Heroku or Docker. The documentation describes other hosting methods .
$ npm install -g cubejs-cli
$ cubejs create nginx-log-analytics -t serverless -d athena
To configure access to the database in cube.js, environment variables are used. The generator will create a .env file in which you can specify your keys for Athena .
Now we need a data scheme in which we indicate how our logs are stored. There you can specify how to read metrics for dashboards.
In the directory schema, create a file Logs.js. Here is an example data model for nginx:
const partitionFilter = (from, to) =>`
    date(from_iso8601_timestamp(${from})) <= date_parse(partition_0 || partition_1 || partition_2, '%Y%m%d') AND
    date(from_iso8601_timestamp(${to})) >= date_parse(partition_0 || partition_1 || partition_2, '%Y%m%d')
    `
cube(`Logs`, {
  sql: `
  select * from part_demo_kinesis_bucket
  WHERE ${FILTER_PARAMS.Logs.createdAt.filter(partitionFilter)}
  `,
  measures: {
    count: {
      type: `count`,
    },
    errorCount: {
      type: `count`,
      filters: [
        { sql: `${CUBE.isError} = 'Yes'` }
      ]
    },
    errorRate: {
      type: `number`,
      sql: `100.0 * ${errorCount} / ${count}`,
      format: `percent`
    }
  },
  dimensions: {
    status: {
      sql: `status`,
      type: `number`
    },
    isError: {
      type: `string`,
      case: {
        when: [{
          sql: `${CUBE}.status >= 400`, label: `Yes`
        }],
        else: { label: `No` }
      }
    },
    createdAt: {
      sql: `from_unixtime(created_at)`,
      type: `time`
    }
  }
});
Here we use the FILTER_PARAMS variable to generate an SQL query with a partition filter.
We also specify the metrics and parameters that we want to display on the dashboard, and specify pre-aggregations. Cube.js will create additional tables with pre-aggregated data and will automatically update the data as it becomes available. This not only speeds up queries, but also reduces the cost of using Athena.
Add this information to the data schema file:
preAggregations: {
  main: {
    type: `rollup`,
    measureReferences: [count, errorCount],
    dimensionReferences: [isError, status],
    timeDimensionReference: createdAt,
    granularity: `day`,
    partitionGranularity: `month`,
    refreshKey: {
      sql: FILTER_PARAMS.Logs.createdAt.filter((from, to) =>`select
           CASE WHEN from_iso8601_timestamp(${to}) + interval '3' day > now()
           THEN date_trunc('hour', now()) END`
      )
    }
  }
}
In this model, we indicate that it is necessary to pre-aggregate the data for all used metrics, and to use monthly partitioning. Partitioning pre-aggregations can significantly speed up data collection and updating.
Now we can put together a dashboard!
The Cube.js backend provides a REST API and a set of client libraries for popular front-end frameworks. We will use the React version of the client to build the dashboard. Cube.js provides only data, so we need a library for visualizations - I like recharts , but you can use any.
The Cube.js server accepts the request in JSON format , which indicates the necessary metrics. For example, to calculate how many errors Nginx gave by day, you need to send the following request:
{
  "measures": ["Logs.errorCount"],
  "timeDimensions": [
    {
      "dimension": "Logs.createdAt",
      "dateRange": ["2019-01-01", "2019-01-07"],
      "granularity": "day"
    }
  ]
}
Install the Cube.js client and the React component library via NPM:
$ npm i --save @cubejs-client/core @cubejs-client/reactWe import components cubejsand QueryRendererto unload the data, and collect the dashboard:
import React from'react';
import { LineChart, Line, XAxis, YAxis } from'recharts';
import cubejs from'@cubejs-client/core';
import { QueryRenderer } from'@cubejs-client/react';
const cubejsApi = cubejs(
  'YOUR-CUBEJS-API-TOKEN',
  { apiUrl: 'http://localhost:4000/cubejs-api/v1' },
);
exportdefault () => {
  return (
    <QueryRenderer
      query={{
        measures: ['Logs.errorCount'],
        timeDimensions: [{
            dimension: 'Logs.createdAt',
            dateRange: ['2019-01-01', '2019-01-07'],
            granularity: 'day'
        }]
      }}
      cubejsApi={cubejsApi}
      render={({ resultSet }) => {
        if (!resultSet) {
          return 'Loading...';
        }
        return (
          <LineChart data={resultSet.rawData()}>
            <XAxis dataKey="Logs.createdAt"/>
            <YAxis/>
            <Line type="monotone" dataKey="Logs.errorCount" stroke="#8884d8"/>
          </LineChart>
        );
      }}
    />
  )
}
Dashboard sources are available on CodeSandbox .