Capacity Management: Looking for the Perfect Balance
Hello! My name is Ivan Davydov, I do research on performance in Yandex.Money.
Imagine that you have powerful servers, each of which hosts a number of applications. If the latter are not very many, they do not interfere with each other's work - they are comfortable and cozy. Once you come to microservices and bring some of the “heavy” functionality into separate applications.
Here you can get carried away, and microservices will become too much, as a result of which it will become difficult to manage them and ensure their fault tolerance. As a result, on each server will be a bunch of a dozen applications that are fighting for shared resources. It turns out "big family", but in a large family do not click with your beak!
Once we also encountered this. My story will be about hard and sleepless nights when I sat under a lamp in the night and fired on the prod. It all started with the fact that we began to notice on the combat servers the problems associated with the network.
They strongly influenced the performance and made a noticeable drawdown. At the same time, it turned out that the same errors also occur with a normal user thread, but to a much smaller extent.
The problem was hidden in the utilization of TCP sockets for more than 100%. This happens when all the sockets available on the servers are constantly opened and closed. Because of this, there are network problems of interaction between applications and various kinds of errors appear - the remote host is unavailable, the HTTP / HTTPS connection is disconnected (connection / read timeout, SSL peer shut down incorrectly) and others.
Even if you do not have your own electronic payment service, it is not very difficult to estimate the scale of pain during any regular sale - the traffic increases several times, and the degradation of performance can lead to significant losses. So we came to two conclusions - it is necessary to evaluate how current capacities are used, and to isolate applications from each other.
To isolate applications, we decided to resort to containerization. For this, we used a hypervisor that contains many separate containers with applications. This allows you to isolate processor, memory, I / O, network resources, as well as process trees, users, file systems, and so on.
With this approach, each application has its own environment, which provides flexibility, isolation, reliability, and increases the overall system performance. This is a beautiful and elegant solution, but before that you need to answer a number of questions:
- What performance margin does one application instance currently have?
- How does the application scale and is there resource redundancy in the current configuration?
- Is it possible to improve the performance of a single instance and what is the “bottleneck”?
With such questions, colleagues came to us - a team of productivity researchers.
What are we doing?
We do everything to ensure the performance of our service and, first of all, we investigate and improve it for the business processes of our production. Each business process, whether it be payment of goods in a purse store or transfer of money between users, in fact, represents for us a chain of requests in the system.
We conduct experiments and compile reports to evaluate system performance at high intensity of incoming requests. The reports contain performance metrics and a detailed description of the problems and bottlenecks identified. With this information, we improve and optimize our system.
Assessment of the potential of each application is complicated by the fact that several microservices that use the power of all the involved instances are involved in organizing the sequence of business process requests.
Speaking metaphorically, we know the power of our army, but we do not know the potential of each of the fighters. Therefore, in addition to ongoing research, it is necessary to assess the resources used in the capacity management process. This process is called “Capacity management.”
Our research helps to identify and prevent a shortage of resources, to predict iron purchases and to have accurate data on the current and potential capabilities of the system. As part of this process, the current application performance (both median and maximum) is monitored and current stock data is provided.
The essence of capacity management is finding a balance between consumed resources and performance.
Pros:
- At any moment, we know what happens with the performance of each application.
- Less risk when adding new microservices.
- Lower costs for the purchase of new equipment.
- Those capacities that are already there are used more intelligently.
How power management works
Let's return to our situation with a variety of applications. We conducted a study, the purpose of which was to assess how power is used on production servers.
In short, the action plan is as follows:
- Determine user intensity on specific applications.
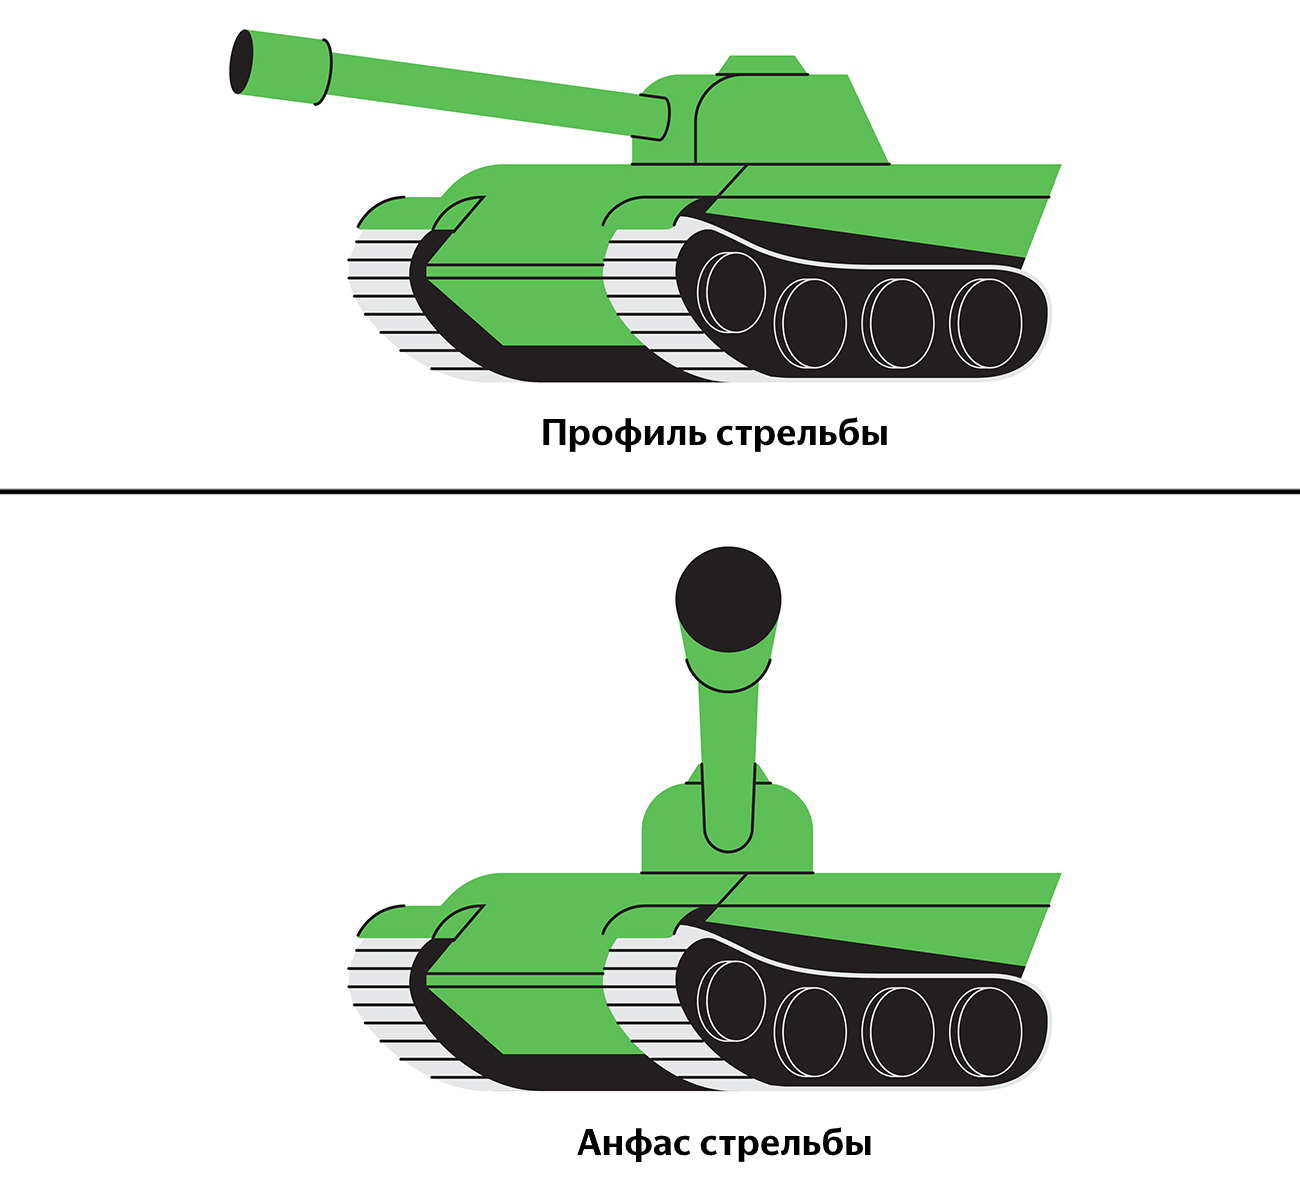
- Make a profile of shooting.
- Evaluate the performance of each application instance.
- Evaluate scalability.
- Compile reports and conclusions on the minimum required number of instances for each application in a combat environment.
And now more.
Instruments
We use Heka and Zabbix to collect custom intensity metrics. Grafana is used to visualize the collected metrics.
Zabbix is needed to monitor server resources, such as: CPU, Memory, Network connections, DB and others. Heka provides data on the number and execution time of incoming / outgoing requests, the collection of metrics for internal application queues and even an infinite amount of other data. Grafana is a flexible visualization tool that is used by various Yandex.Money teams. We are no exception.
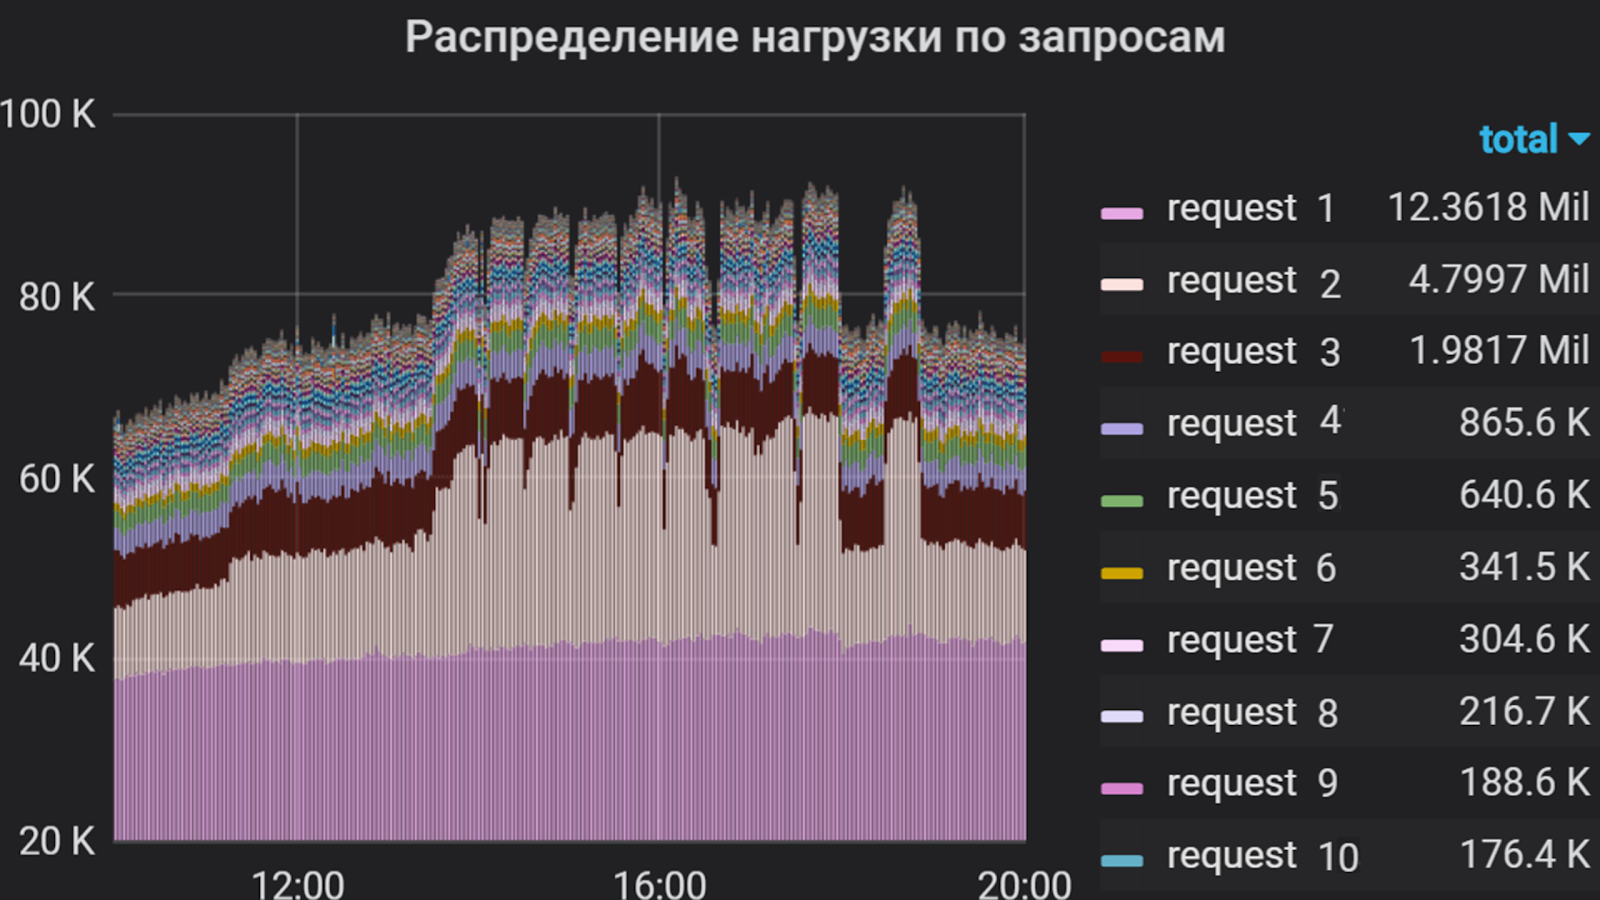
Grafana can show such things, for example.
Apache JMeter is used as a traffic generator . With it, a shooting script is compiled, which includes the implementation of requests, monitoring the validity of a response, flexible control of the feed stream and much more. This tool has both its advantages and disadvantages, but I will not go "why this particular product?"
In addition to JMeter, the yandex-tank framework is a tool for load testing and analyzing the performance of web services and applications. It allows you to connect your modules to get any desired functions and display the results in the console or in the form of graphs. The results of our shooting are displayed in Lunapark (similar to https://overload.yandex.net), where we can observe them in detail in real time, down to the second peaks, providing the necessary and sufficient discreteness, and thereby more quickly respond to bursts arising from shooting. In grafan, discreteness can also be configured, but this solution is more costly in physical and logical resources. And sometimes we even upload raw data and visualize it through the JIET GUI. But only - shhh!
By the way, about degradation. Virtually any failures that occur in the application under a large flow of traffic are promptly analyzed using Kibana . But this is also not a panacea - some network problems can be analyzed only through the removal and analysis of traffic.
With the help of Grafana, we analyzed the user intensity in the application for several months. We decided to take the total processor time for executing queries for a unit of measurement, that is, the number of queries and the time of their execution were taken into account. So we made a list of the most "heavy" requests that make up the bulk of the flow to the application. It was this list that formed the basis of the shooting profile.

User intensity per application for several months
Shooting profile and zeroing
We call shooting a script launch as part of an experiment. The profile is made up of two parts.
The first part is the creation of a query script. When implemented, it is necessary to analyze the user intensity for each incoming application request and make a percentage ratio between them to identify the top most caused and long-running ones. The second part is the selection of flow growth parameters: with what intensity and for how long the load is applied.
For greater clarity, the method of compiling a profile is best demonstrated by example.
In Grafana, a graph is plotted that reflects the user intensity and the proportion of each request in the total flow. Based on this distribution and the response time for each of the requests, groups are created in JMeter, each of which is an independent traffic generator. The scenario is based on only the most "heavy" requests, since it is difficult to implement everything (in some applications there are more than a hundred), and this is not always required because of their relatively low intensity.

The percentage of requests
In this study, the user intensity at a constant flow is considered, and occasional “bursts” occurring are most often considered in private.
In our example, two groups are considered. The first group includes “request 1” and “request 2” in the ratio of 1 to 2. Similarly, requests 3 and 4 are included in the second group. The remaining requests of the component have much lower intensity, so we do not include them in the script.

Distribution of requests by groups in Jmeter
Based on the median response time for each group, the performance is estimated using the formula:
x = 1000 / t, where t is the median time, ms
We obtain the result of the calculation and estimate the approximate intensity with increasing number of streams:
TPS = x * p, where p is the number of threads, TPS is transaction per second, and x is the result of the previous calculation.
If the request is processed in 500 ms, then at one stream we have 2 Tps, and at 100 streams, ideally should have 200 Tps. Based on the results obtained, the initial growth parameters can be selected. After the first iterations of research, these parameters are usually adjusted.
When the shooting scenario is ready, we launch the shooting - shooting for one minute in one stream. This is done in order to test the performance of the script at a constant flow, estimate the response time to queries in each of the groups and get a percentage of the queries.
When running such a profile, we found that with the same intensity, the percentage ratio of requests is maintained, since the average response time in the second group is longer than in the first. Therefore, we set the same flow rate for both groups. In other cases, it would be necessary to experimentally select the parameters for each group separately.
In this example, the intensity was applied in steps, that is, a certain number of flows were added at a certain interval.

Intensity growth parameters
The growth intensity parameters were as follows:
- The target number of streams is 100 (determined during adjustment).
- Growth for 1000 seconds (~ 16 min.).
- 100 steps.
Thus, every 10 seconds we add one thread. The interval between the addition of flows and the number of added flows vary depending on the behavior of the system at a particular step. Often the intensity is supplied with a smooth growth, so that you can monitor the status of the system at each of the steps.
Battle Shooting
Usually shooting starts at night from remote servers. At this time, user traffic is minimal - this means that shooting will have almost no effect on users, and the error in the results will be less.
According to the results of the first firing in one instance, we adjust the number of flows and the growth time, analyze the behavior of the system as a whole and find deviations in the work. After all the adjustments, re-shooting in one instance is launched. At this stage, we determine the maximum performance and monitor the use of hardware resources as the server with the application, and all that stands behind it.
According to the results of the shooting, the performance of one instance of our application was about 1000 Tps. At the same time, an increase in the response time for all requests without an increase in productivity was recorded, that is, we reached saturation, but not degradation.
At the next stage, we compare the results obtained from other instances. This is important, as the iron can be different, which means that different instances can give very different indicators. So it was with us - some of the servers turned out to be an order of magnitude more productive due to generation and characteristics. Therefore, we have identified a group of servers with the best results and investigated the scalability of them.
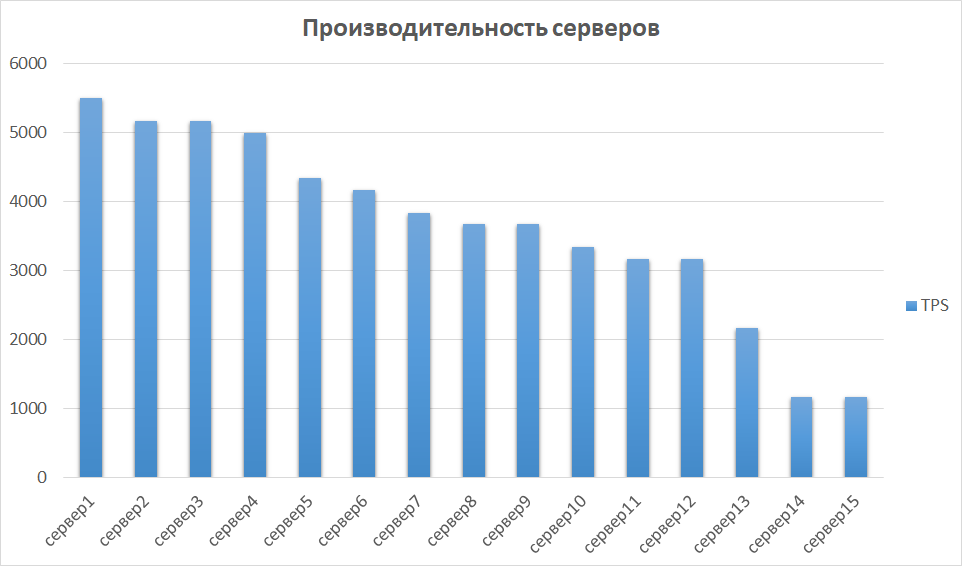
Server performance comparison
Scalability and bottleneck search
The next step is to examine performance on 2, 3, and 4 instances. In theory, performance should grow linearly with an increase in the number of instances. In practice, this is usually not the case.
In our example, it turned out almost perfect.

The reason for the saturation of productivity growth was the exhaustion of connector pools before the subsequent backend. This is solved by controlling the size of the pools on the outgoing and incoming side and leads to an increase in application performance.
In other studies, we have come up with more interesting things. Experiments have shown that, along with performance, utilization of CPU and database connections is greatly increasing. In our case, this happened due to the fact that in the configuration with one instance we rested on the application settings of our own pools, and with two instances we doubled this number, thereby doubling the outgoing flow. The database was not ready for this volume. Because of this, pools began to get clogged up to the database, the percentage of consumed CPU reached the critical level of 99%, and the query processing time increased, and some of the traffic fell off altogether. And we got these results already with two instances!
In order to finally be convinced of our fears, we fired 3 instances. The results turned out to be approximately the same as in the first two, except that they quickly arrived at a breakdown.
There is another example of “gags” that, in my opinion, is the most painful - this is poorly written code. There can be anything, starting with queries to the database, which are executed in minutes, ending with code that is not efficiently using the memory of a Java machine.
Results
As a result, the performance instance studied in our example application instance was more than 5 times higher in performance.
To increase performance, it is necessary to calculate a sufficient number of handler pools in the application settings. Two instances for a specific application are enough, and the use of all 15 that are available is redundant.
After the study, the following results were obtained:
- User intensity for 1 month was determined and monitored.
- Revealed performance margin for one instance of the application.
- The results of errors occurring under a large flow.
- Identified bottlenecks for further work on increasing productivity.
- Identified the minimum number of instances for the application to work correctly. And, as a result, revealed the redundancy of capacity utilization.
The results of the study formed the basis of the project on the transfer of components into containers, which we will discuss in future articles. Now we can say for sure how many containers and with what characteristics it is necessary to have, how to efficiently use their capacities and what it takes to work to ensure the performance at the proper level.
Come to our cozy telegram chat , where you can always ask for advice, help colleagues and just talk about performance research.
That's all for today. Ask questions in the comments and subscribe to the Yandex.Money blog - we will soon tell you about phishing and how not to fall for it.