Technical differences of BI systems (Power BI, Qlik Sense, Tableau)
Reading time 11 minutes
The purpose of this article is to compare the three leading BI platforms that are leaders in the Gartner quadrant:
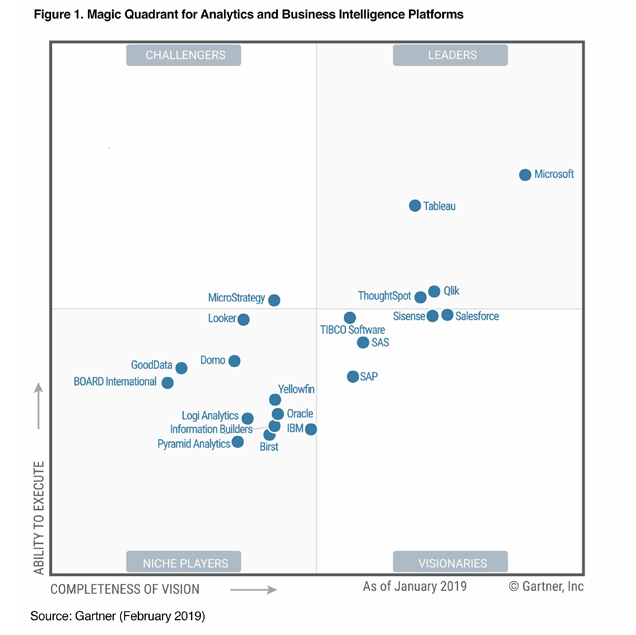
Figure 1. Gartner BI Magic Quadrant 2019
My name is Andrey Zhdanov, I am the head of analytics at Analytics Group. We build visual reports on marketing, sales, finance, logistics, in other words, we do business analytics and data visualization.
My colleagues and I have been working with various BI platforms for several years. We have very good project experience, which allows us to compare platforms from the point of view of developers, analysts, business users and implementers of BI systems.
We will have a separate article on comparing prices and the visual design of these BI systems, so here we will try to evaluate these systems precisely from the point of view of the analyst and developer.
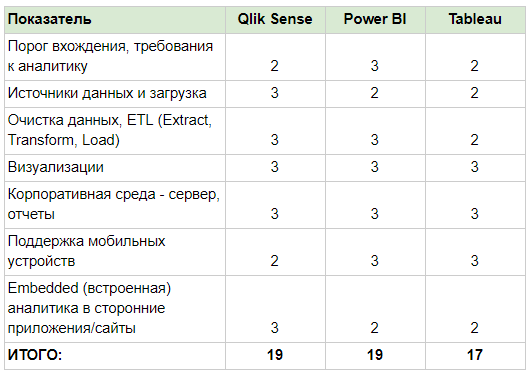
We single out several areas for analysis and evaluate according to a 3-point system:

I saw many Power BI users who were not IT specialists, but who could create a good report. Power BI uses the same query language as Excel - Power Query and the DAX formula language. Many analysts know Excel well, so switching to this BI system is pretty easy for them.
Most of the actions are not complicated enough in the query editor. Plus there is an advanced editor with the M language for professionals.
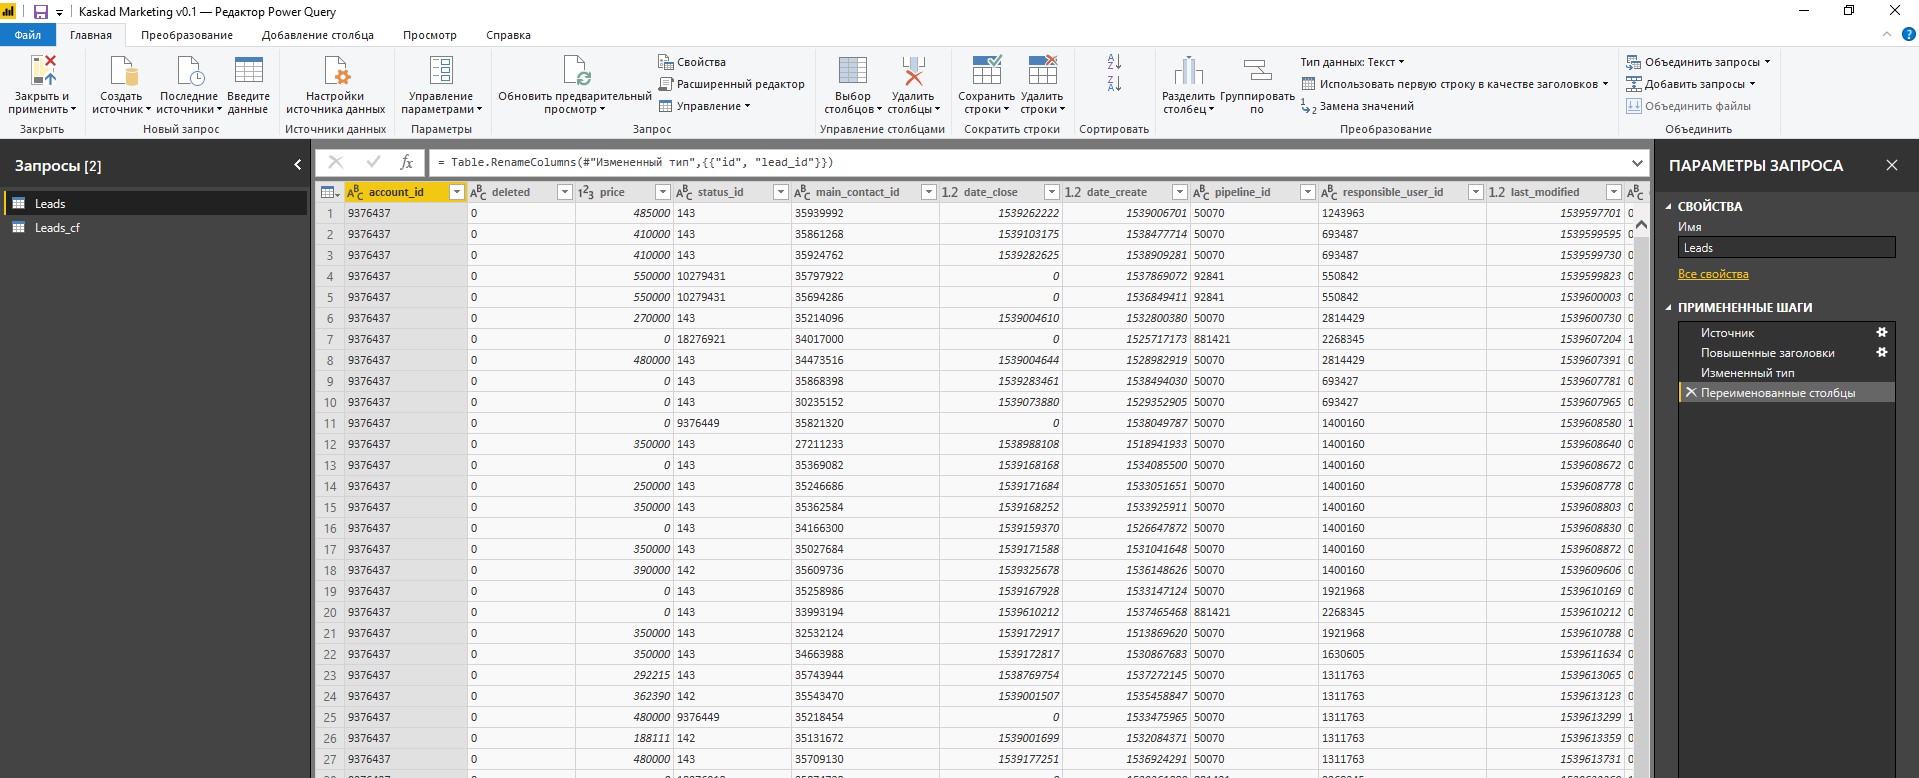
Figure 2. Power BI query designer
Qlik Sense looks very friendly - a small number of settings, a quick ability to create a report, you can use the data loading constructor.
At first, it seems simpler than Power BI and Tableau. But from experience I’ll say that after a while, when the analyst creates a couple of simple reports and needs something more complicated, he will be faced with the need to program.
Qlik has a very powerful language for loading and processing data. There is a proprietary formula language Set Analysis. Therefore, the analyst must be able to write queries and connections, put data in virtual tables, and actively use variables. The possibilities of the language are very wide, but it will require its study. Probably all the Qlik analysts I know have some kind of serious IT background.
Qlik integrators, like us, often like to talk about the associative model, when when loading data they are all placed in RAM, and the communication between the data is carried out by the internal mechanism of the platform. That at a choice of values, internal subqueries are not made, as in classical databases. Data is generated almost instantly due to pre-indexed values and relationships.
True in practice, this leads to the creation of automatic table joins when field names match. For example, you cannot have different tables without relationships that have the same field. You have to get used to it. You have to either rename the columns and make sure that the names do not match, or combine all the fact tables into one and surround them with directories of the “star” type. Probably it’s convenient for beginners, but for experienced analysts it makes no difference.
A typical analytics data loading and processing interface looks like this.
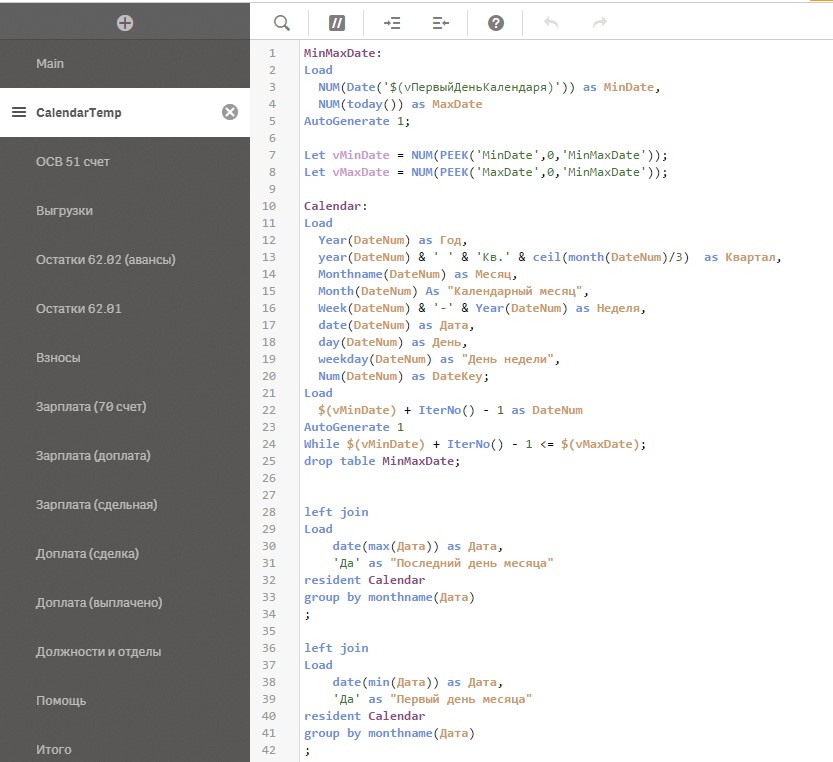
Figure 3. Qlik Sense data loading editor, Calendar table
Note: In Power BI, the situation usually looks different, you leave different fact tables and reference books, you can manually join the tables in the classical way, i.e. I map the columns to each other manually.
Tableau developers position themselves as BI with a convenient and user-friendly interface that will allow the analyst to independently study their data. Yes, in our company there were analysts who could make their reports without IT experience. But I’ll lower the evaluation of Tableau for several reasons:
- Weak localization with the Russian language
- Tableau Online servers are not in the Russian Federation
- A fairly simple download constructor starts to cause problems when you need to build a rather complex data model.
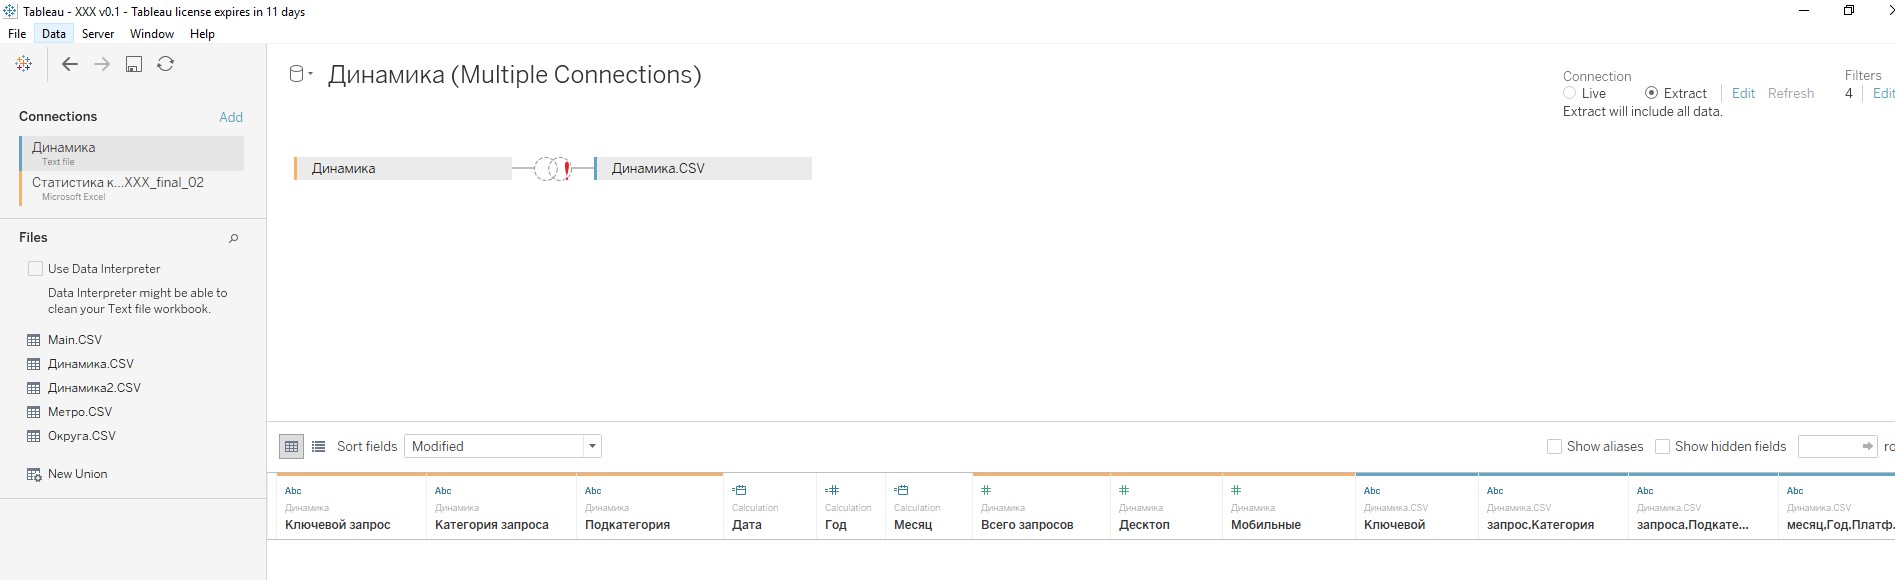
Figure 4. Tableau data load constructor
One of the questions we ask at the interview with Tableau analysts is “How to build a model of fact tables with reference tables without bringing everything into a single table ?!” Data blending requires thoughtful use. I have corrected many times my analytics data duplication errors after such associations.
Plus, Tableau has a rather peculiar system, when you make each chart on a separate sheet Sheet, and then create a Dashboard, where you start to place the created sheets. Then you can create a Story, this is a combination of different Dashboards. Development in Qlik and Power BI is easier in this regard, you immediately threw chart templates on the sheet, set measures and dimensions, and the Dashboard is ready. It seems to me that the labor costs for preparing at Tableau are increasing.

There is no clear leader in this section, but we will highlight Qlik due to a couple of nice features.
Tableau in the free version is limited in sources, but in our articles we focus more on business, and business can afford commercial products and analysts. Therefore, Tableau did not lower the score for this parameter.
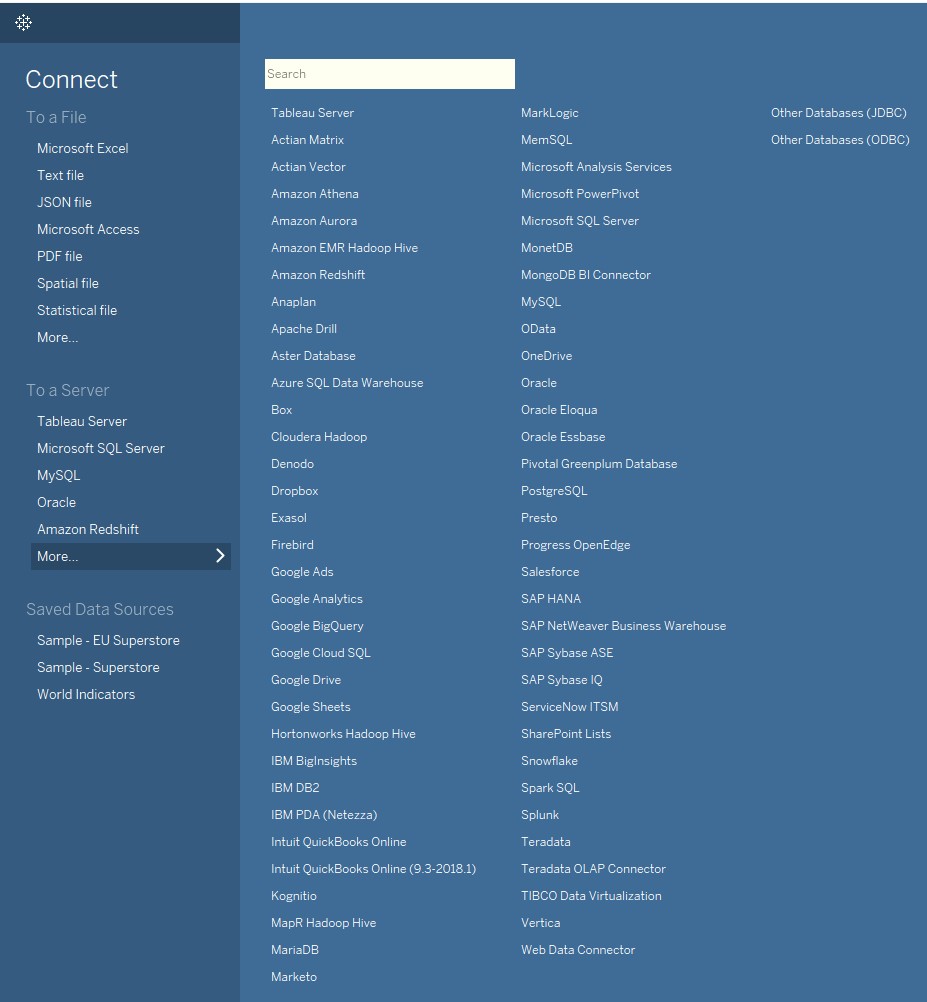
Figure 5. List of possible Tableau sources
Otherwise, the list of sources is impressive everywhere - all table files, all standard databases, web connections, everything works everywhere. I didn’t come across non-standard data storages, maybe there are some nuances there, but in most cases you will not have problems loading data. The exception is perhaps only 1C. There are no direct connectors to 1C.
Qlik partners in Russia sell their own connectors for 100,000 - 200,000 rubles, but in most cases it is cheaper to upload from 1C to FTP to Excel or SQL database. And you can publish the 1C database on the web and connect to it using the Odata protocol.
PowerBI and Tableau can do this as standard, but Qlik will ask for a paid connector, so it’s also easier to upload to an intermediate database. In any case, all connection issues can be resolved.
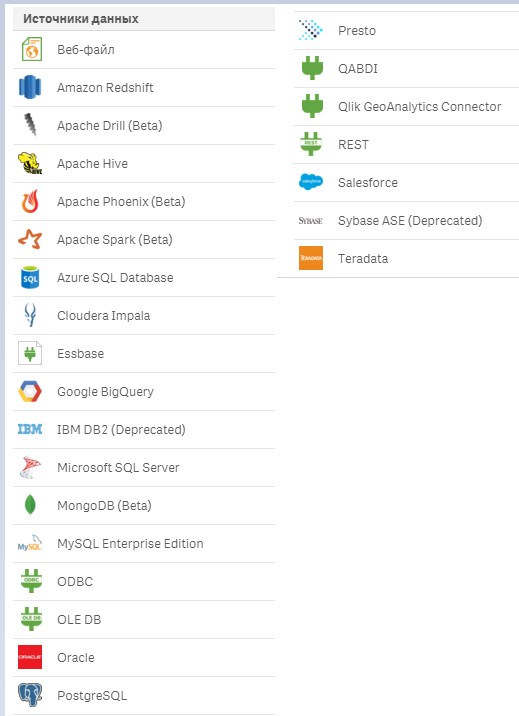
Figure 6. List of possible sources of Qlik Sense In
addition, it is worth noting the feature of Qlik that they supply both paid and free connectors as a separate product.
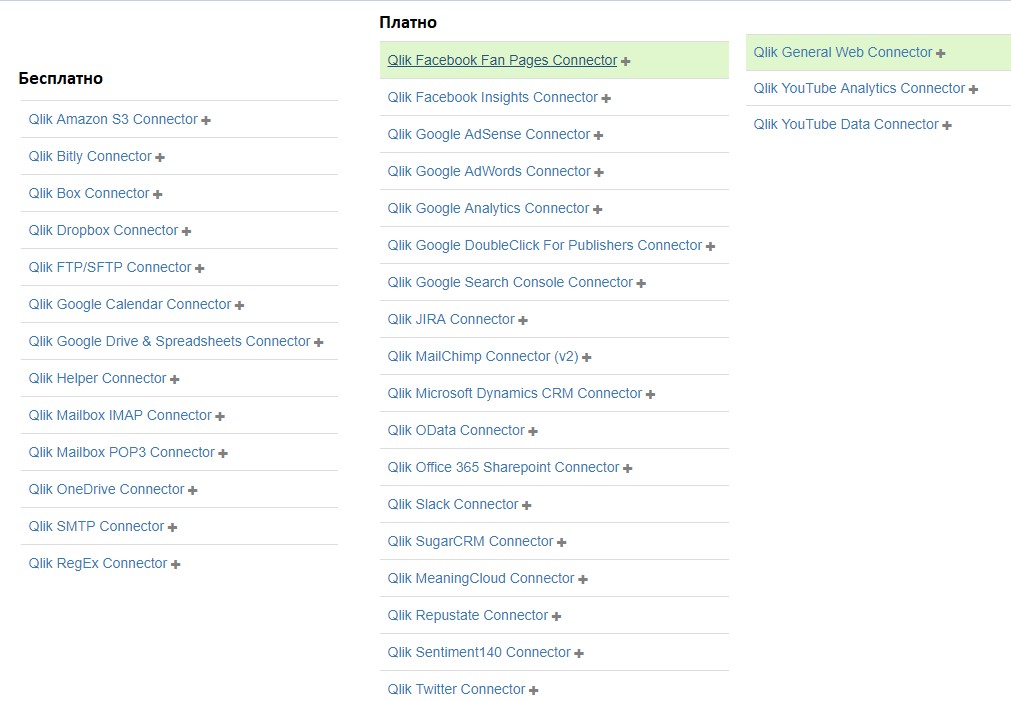
Figure 7. Additional Qlik Sense Connectors
I’ll add from experience that with large amounts of data or numerous sources it is not always advisable to connect a BI system right away. Serious projects usually use a data warehouse, a database with data already prepared for analysis, etc. You can’t take and upload say 1 billion records in the BI system. Here it is already necessary to think over the architecture of the solution.
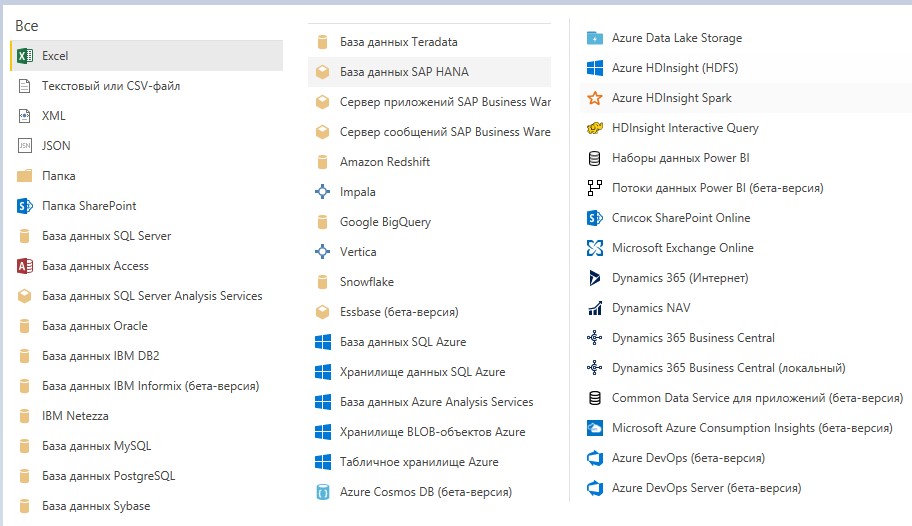
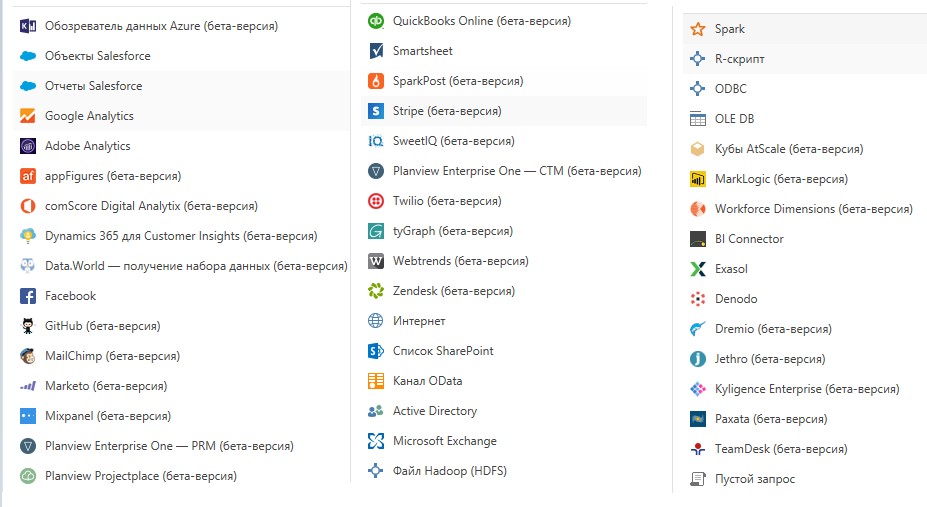
Figure 8. Power BI data sources
But why isolate Qlik? I really like 3 things:
- QVD files
Own data storage format. Sometimes you can build serious commercial projects only on QVD files. For example, the first level is raw data. The second level is processed files. The third level is aggregated data, etc. These files can be used in different applications, different employees and services can be responsible for them. The download speed from such files is ten times faster than from conventional data sources. This allows you to save on the database and exchange information between different Qlik applications.
- Incremental data loading
Yes, Power BI and Tableau can also do this. But Power BI will require an expensive Premium version, and Tableau does not have the same flexibility as Qlik. In Qlik on QVD files, you can take system snapshots at different times and then process this data as you like
- Connection of external scripts
In addition to QVD files for data storage, in Qlik script code can also be moved outside the application and connected using the Include command. This already allows you to organize teamwork, use version control systems, manage a single code for different applications. Power BI has an advanced query editor, but we could not configure such teamwork as in Qlik. In general, all BIs have problems with this; it is simply impossible to manage data and code and visualizations in all applications from a single place. The maximum that we were able to do was render QVD files and script code. Visual elements have to be edited inside the reports themselves, which does not allow us to massively change the visualizations of all clients at the same time.
But what about a mechanism like a Live connection? Tableau and Power BI support a LIVE connection to a number of sources, unlike Qlik. We are rather indifferent to this feature, because practice shows that when it comes to big data, working with a LIVE connection becomes simply impossible. And in most cases, BI is needed for big data.

In this section, I have 2 leaders, Qlik Sense and Power Bi.
Let's just say Qlik is powerful, but difficult. You will understand their SQL-like language and you will be able to do almost everything - virtual tables, joins and joining tables, cycle through the table and generate new tables, a bunch of row processing commands. For example, a field in 1 cell, which is clogged with data like “Ivanov 851 White” on the fly, can be decomposed not only into 3 columns (as everyone knows), but immediately into 3 lines, for example. The same thing on the fly to make combining 3 lines in 1 is also easy.
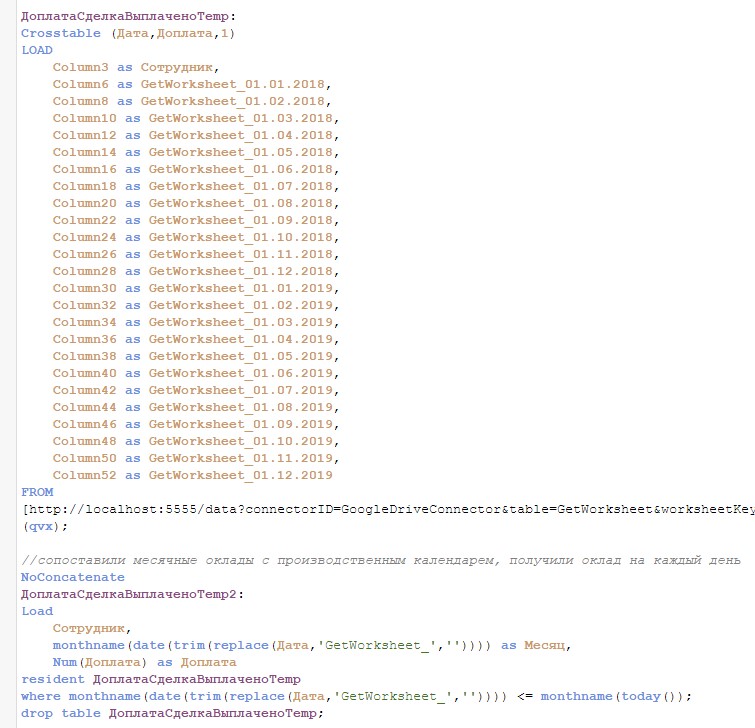
Figure 9. How to load and transpose a table in Qlik Sense from Google Sheets
Power BI in this regard is simpler, but most tasks are easily solved through the query designer. Set a number of parameters, transposed the table, worked on the data, and all this without a single line of code.
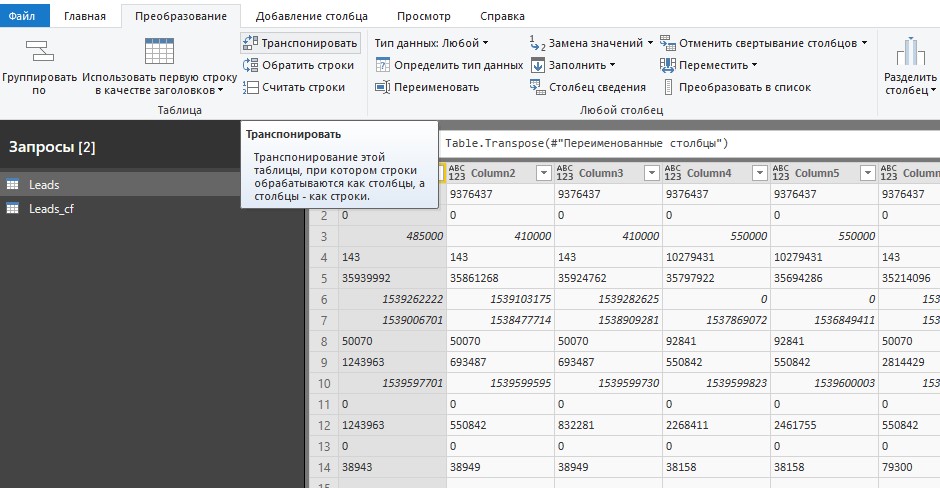
Figure 10. How to load and transpose a table in Power BI from AmoCRM
Tableau seems to have a different ideology. They are more for beauty and design. Connecting a bunch of different sources, combining them all and processing inside Tableau seems to me very difficult. In commercial projects, in most cases Tableau already prepares and accumulates data in storages and databases.
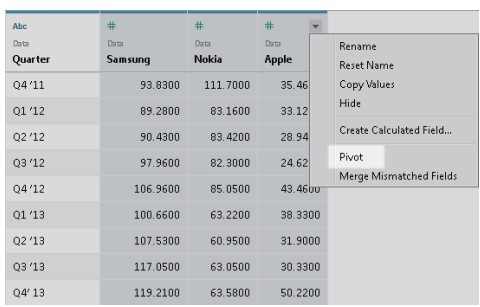
Figure 11. How to load and transpose a table in Tableau

In this section, we did not highlight the leader. We will have a separate article where, using the example of one case, we will show the same report in all 3 systems (Article “Analytics of girls with low social responsibility”) . There is more to do with the taste and skill of the analyst. On the Internet, you can find very beautiful pictures built on the basis of any of these systems. Basic visualization capabilities are about the same for everyone. The rest is solved using Extensons. There are paid, free. There are extensions from the vendors themselves, as well as from freelancers and integrators. You yourself can write your own visualization extension for any platform.
I like the style of Tableau, I consider it strict and corporate. But getting a truly beautiful picture in Tableau is hard. A great example of Tableau renderings that use only extensions. I will not be able to repeat this, because I do not have these extensions, but it looks beautiful.

Figure 12. Appearance of Tableau reports with Extensions
Power BI can also be made interesting.
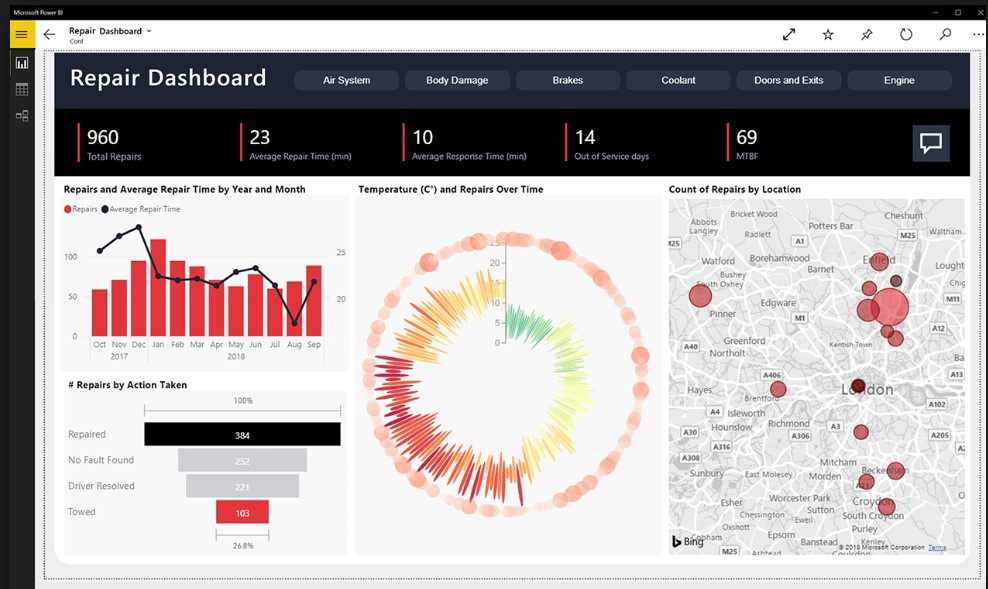
Figure 13. Appearance of Power Bi reports with Extensions
The only thing I don’t understand in Power BI is why they have such strange colors by default. On any chart, I have to change the color to my own corporate, corporate one and am amazed at the standard color.
Qlik Sense is also dependent on Extensions. The use of add-ons can alter reports beyond recognition. You can also roll your own theme and design.
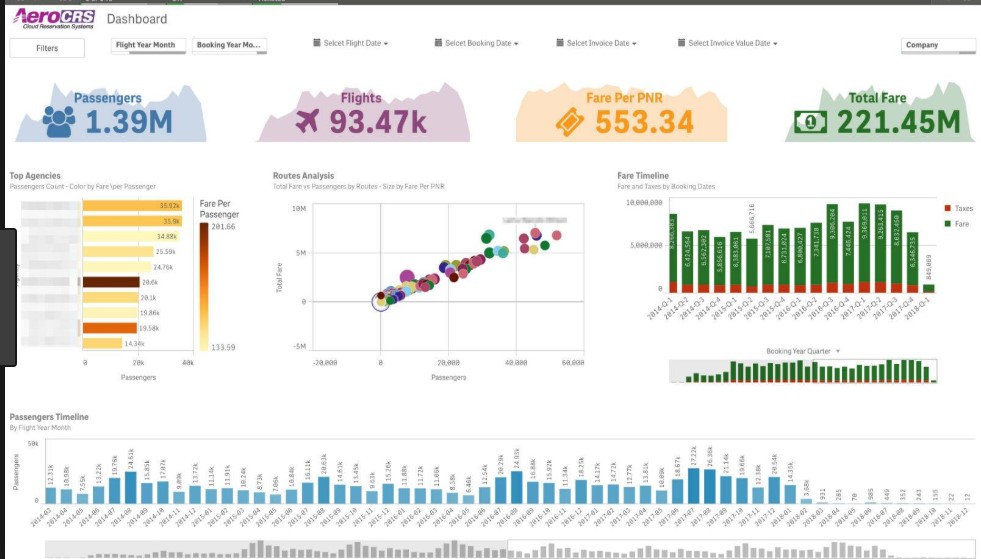
Figure 14. Appearance of Qlik Sense reports with Extensions
From the point of view of the developer, Qlik Sense is more convenient for me because of the standard options as alternative measurements and measures. It is possible to set several dimensions and measures in the visualization settings, and the user can easily specify what he should look at on a particular chart.
In Power Bi and Tableau, I have to configure the parameters, buttons, and program the behavior of the system depending on these parameters. I wonder why it is so difficult. The same thing with the ability to change the type of viloise.
In Qlik, you can hide different types of visualizations in one object, and in Power BI and Tableau this is more difficult. Again, it depends more on the skill of the performer. You can make a masterpiece in any system, but without experience, inexpressive graphics will be obtained everywhere.

All products have enterprise server versions. I worked with all editions and I can say that everyone has strengths and weaknesses. The choice of product should be selected from your software requirements, taking into account their nuances. All vendors can be granted rights both at the level of accounts and groups, and at the level of Data Row Level Security. Scheduled reports are automatically updated.
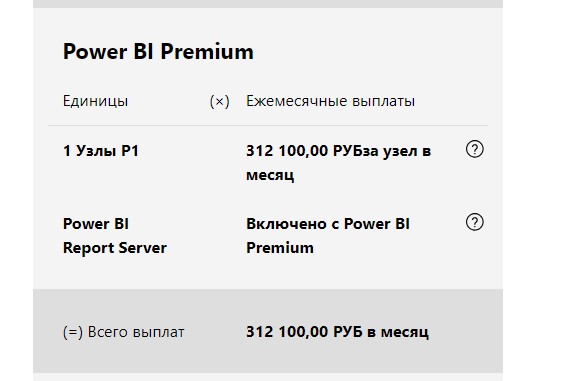
Qlik Sense Enterprise is a great opportunity to build analytics within your organization for medium-sized businesses. It may seem more expensive than Power BI Pro, but do not forget that Power BI Pro servers are located in the cloud on the territory of Microsoft and you can not affect performance, and when you need Power BI Premium, which can be deployed on your servers, then The price starts from $ 5000 per month.
Qlik Sense Enterprise starts at 230,000 rubles. for 5 licenses (annual fee, then only technical support), which is much more affordable than Power BI Premium. And Qlik Sense Enterprise will enable you to take full advantage of Qlik. Perhaps except one. For some reason, Qlik decided that such a function as the ability to send reports to PDF by e-mail should be delivered as a separate NPrinting service.
But Qlik Sense Enterprise is more powerful than Power BI Pro, and so the following comparison can be made here.
Qlik Sense Enterprise = Power BI Premium, with equal capabilities, is cheaper with average deployments. Large implementations are usually calculated already on the side of the vendor, where they can give individual conditions for your company.
In this regard, we will give preference to Qlik Sense Enterprise, there is every opportunity to build serious analytics on huge data. In our opinion, Qlik will run faster than Power BI on large arrays, at Qlik conferences there were clients who at first tested their data in billions of records and Power BI showed worse results.
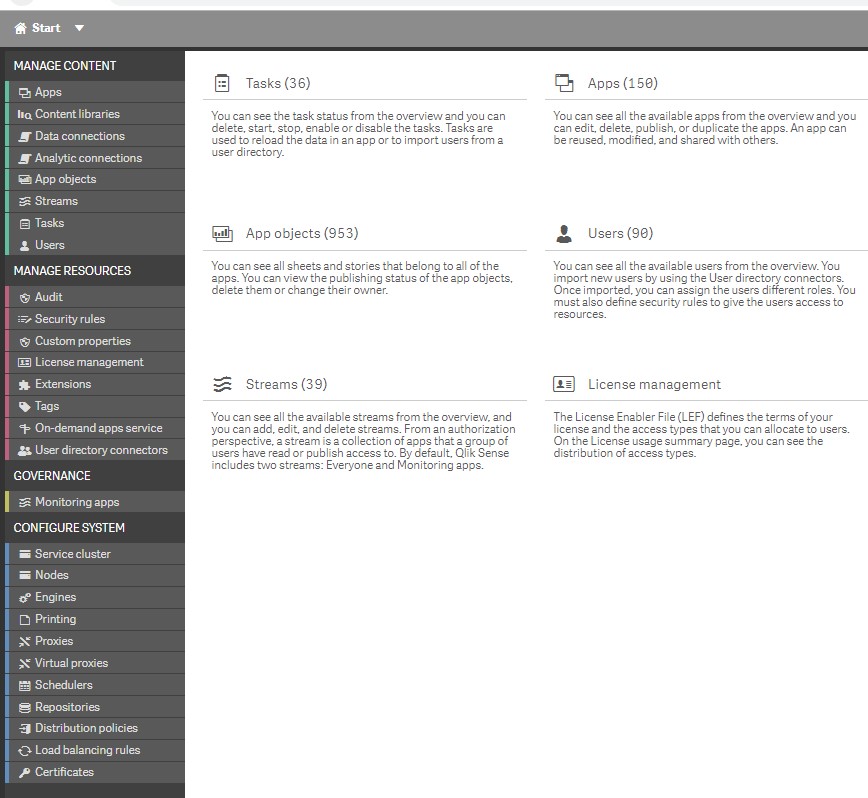
Figure 15. Appearance of Qlik Sense Enterprise server reports
Qlik Sense Cloud = Power BI Pro. Qlik Sense Cloud is 1.5 times more expensive * and there is a very significant limitation that this platform does not allow us to. You can not use Extensions, even built-in. And without extensions, Qlik somewhat loses its visual beauty.
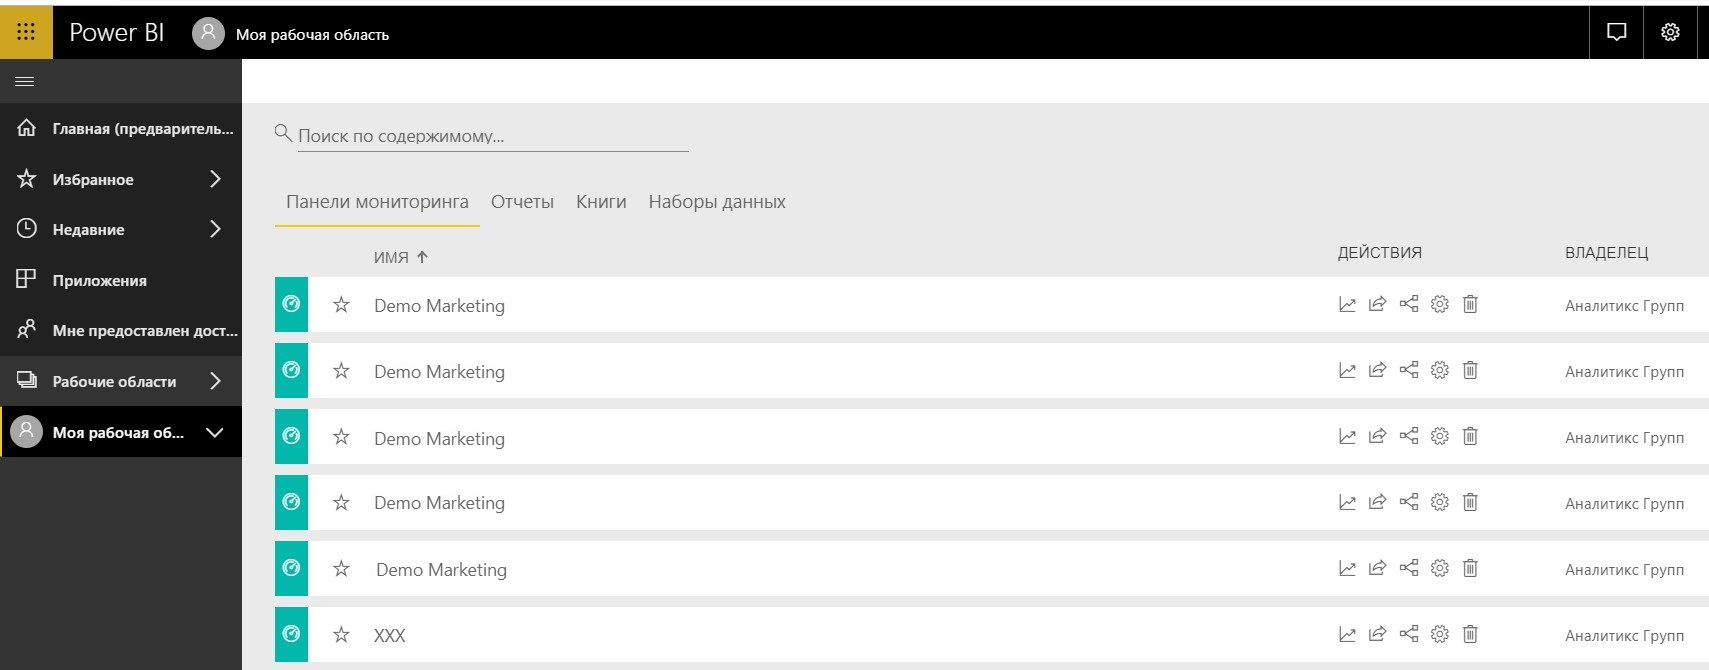
Figure 16. Appearance of the Power BI Pro control panel
And Tableau is a little out of the way for us. They have both cloud subscriptions of $ 70 per developer and $ 15 per view, and expensive server solutions. But the main idea of Tableau is that for big data you need to process data and store it on the side. Objectively less functionality does not allow serious data processing in Tableau. Visualize, analyze, yes. But for small and medium-sized businesses it is usually difficult to create a separate storage. I would have underestimated the score for Tableau therefore, if not for their 1 chip. The Tableau server sends emails without a problem on a schedule with attachments in CSV or PDF. And you can do the distribution of rights, autofilters and more. For some reason, Power BI and Qlik cannot do this, but to someone it can be critical. Due to this, Tableau maintains a position in our dispute.

Figure 17. Appearance of the Tableau Server control panel
Also in the corporate environment, you need to think about the cost of implementation and maintenance. In Russia, the practice has developed that Power BI is more common in small businesses. This led to the emergence of a large number of vacancies and resumes, the emergence of small integrators. This will allow you to find specialists for a small project. But most likely all of them will not have the experience of large implementations and work with big data. Qlik and Tableau are the other way around. There are few Qlik partners, and Tableau even fewer. These partners specialize in large deployments with a large average bill. There are not many vacancies and resumes on the market, the threshold for entering these products is more complicated than in Power BI. But in Russia there are successful introductions of these products to thousands of users and these products show themselves well on big data.

In this section, we highlight Power BI and Tableau. You can install mobile applications and they will look quite adequately on the screens of mobile devices. Although it seems to us analytics on mobile devices loses analytics on a PC. All the same, it’s not so convenient to use filters, the pictures are small, the numbers are hard to see, etc.
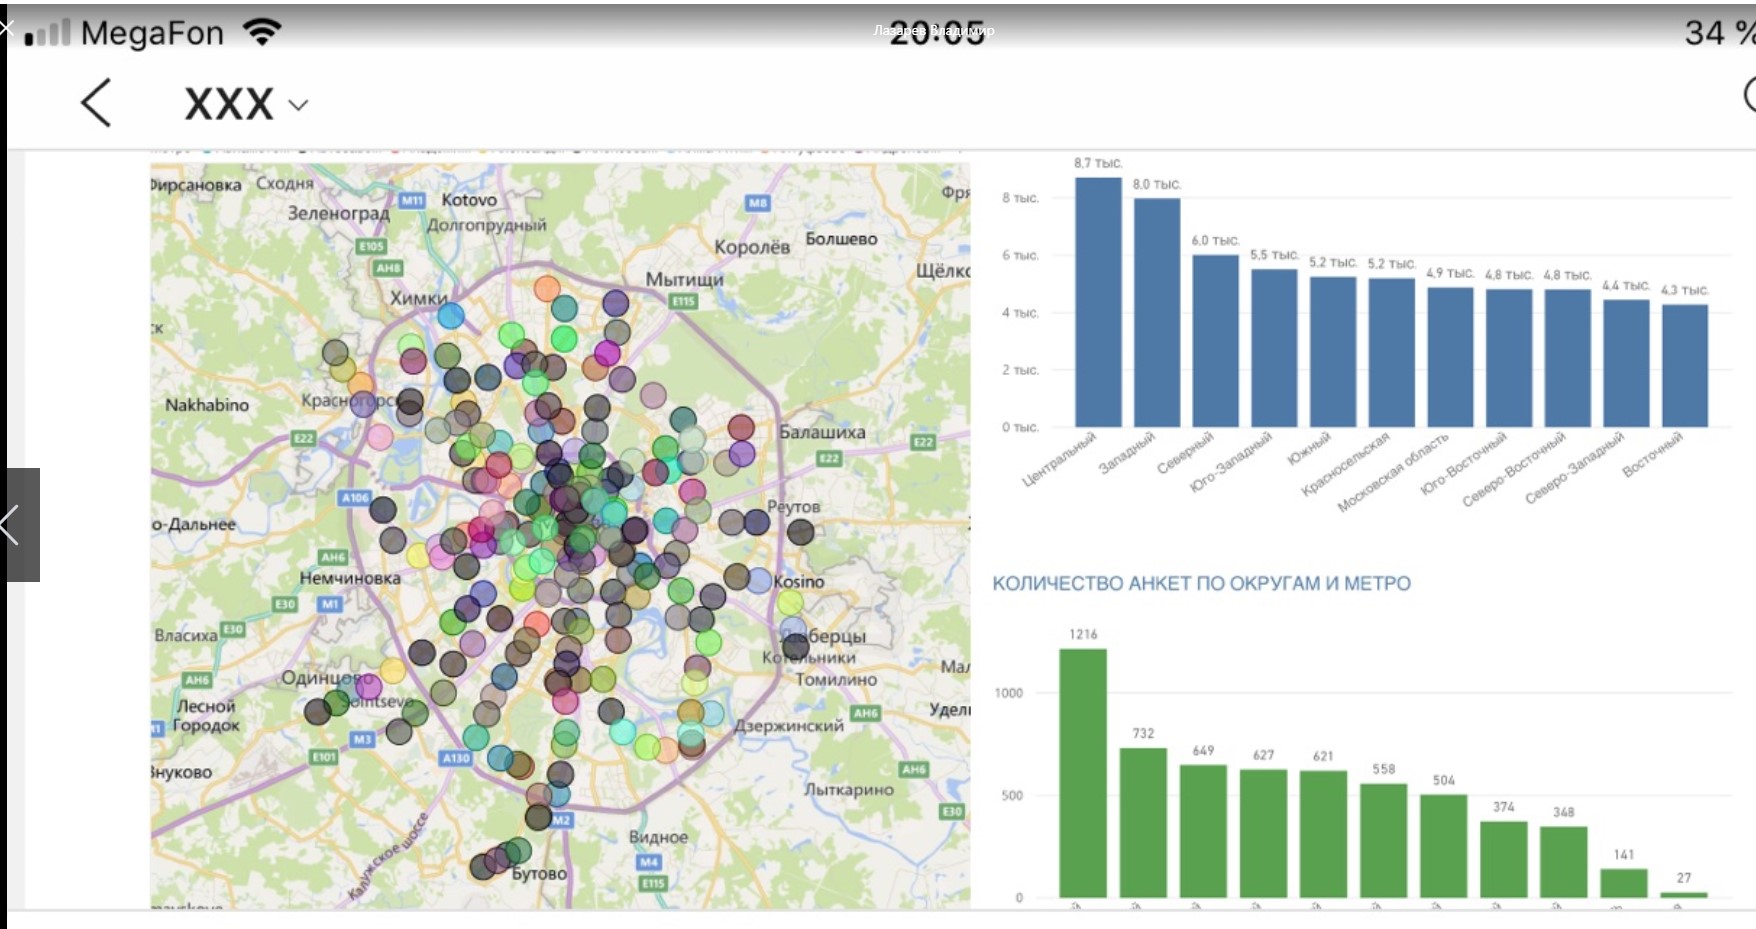
Figure 18. Appearance of Power BI report on iPhone
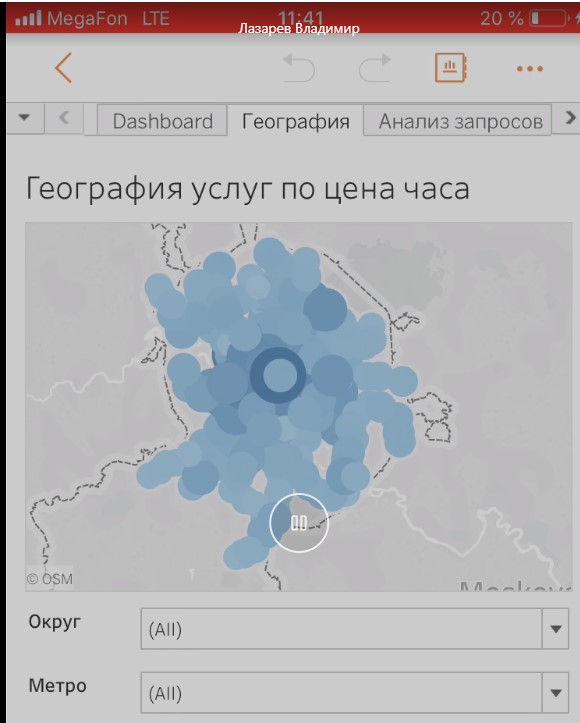
Figure 19. Appearance of Tableau report on iPhone
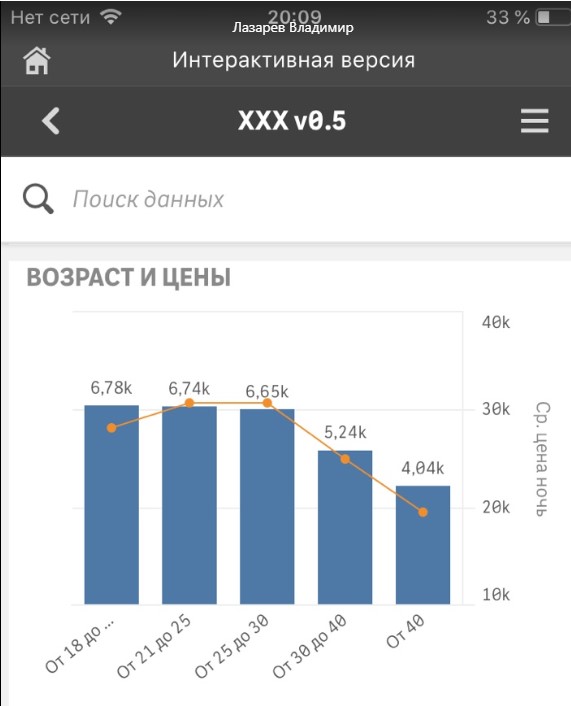
Figure 20. Appearance of Qlik Sense report on iPhone
Why are Qlik points underestimated? For reasons unknown to us, the mobile client is available only on the iPhone; on Android, you will have to use a regular browser. Plus, when using Qlik, you immediately have to understand that a number of Extension or visualizations are not reduced or auto positioned in mobile devices as expected. A report that looks very nice on a PC looks much worse on a small screen. It is necessary for mobile devices to make a separate report, where to remove filters, KPI and a number of objects. This also applies to Power BI or Tableau, but in Qlik is especially pronounced. We hope Qlik will work on its mobile client.
If you plan to conduct analytics from mobile devices a lot of time, then it makes sense to put all 3 clients and check their display on test reports. Any vendor on its website has a gallery of test reports for review.

Using analytics as a third-party service is not always convenient. Perhaps you are developing your product, but you are not ready to start developing the visualization and analytics engine from scratch. Perhaps you want to deploy analytics on your website so that the client registers, uploads his data and analyzes inside his personal account. To do this, you need Embedded Analytics.
All products allow you to do this, but in this category we highlight Qlik.
Power Bi and Tableau clearly say that for such purposes you need to buy a separate product Tableau Embedded Analytics or Power BI Embedded. These are not cheap solutions in thousands of dollars per month, which immediately limits their use. Most projects immediately become unprofitable for our customers. This means that you need not only to publish a report of the entire Internet, but to ensure the publication of reports according to certain accesses, with data protection, user authorization, etc.
And Qlik will let you get out. Of course, they also have a Qlik Analytics Platform which is licensed to the server and organizes an unlimited number of connections. It will also be expensive like the competitors Tableau and Power Bi. And in the case of unlimited connections, there are not particularly options.
But Qlik has a concept like Mashup. Let's say you have Qlik Sense Enterprise and 10 licenses. Standard analytics, appearance, everything is already tired. You raise your own website or application, and you can implement all your analytics right there. The trick is that, to put it simply, Mashup is a visualization in program code. By API, you can programmatically set up the creation of visualization inside your application or site. You will still need Qlik Sense Enterprise for licensing (licenses for connecting to the site = licenses for connecting to BI), for downloading data, etc., but the visualizations will not already be displayed on the server side, but will be built into your application or site. You can use CSS styles, set new fonts, colors. Your 10 users will no longer log into the analytics server, They will use your corporate portal or application. Analytics will reach a new level.
Figure 21. Appearance of the Qlik Sense report embedded on the website
It will already be difficult to understand where the elements of the site are and where Qlik Sense is already starting.
Of course, you will need a programmer, or rather a few. One for web programming, one for working with the Qlik API. But the result is worth it.
It is difficult to say unequivocally who is better and who is worse. Power BI and Qlik in our competition are on a par, Tableau is slightly inferior. But perhaps for your business the result will be different. In BI platforms, the visual component is very important. If you have watched dozens of demo reports and pictures on the Internet for all BI systems and you don’t like how one of the platforms looks, then most likely you will not implement it, even if you are satisfied with the price or those. specifications.
Next, you will definitely need to calculate the cost of licenses, implementation and content of the BI platform. Perhaps in your case a leader will be revealed. Of great importance is the contractor or the ability to hire a suitable specialist. Without professionals in any platform, the result will be disastrous.
Successful BI-integration for you, Andrey Zhdanov and Vladimir Lazarev, Analitiks Group
We and Gartner Square 2019 BI :-)
The purpose of this article is to compare the three leading BI platforms that are leaders in the Gartner quadrant:
- Power BI (Microsoft)
- Tableau
- Qlik
Figure 1. Gartner BI Magic Quadrant 2019
My name is Andrey Zhdanov, I am the head of analytics at Analytics Group. We build visual reports on marketing, sales, finance, logistics, in other words, we do business analytics and data visualization.
My colleagues and I have been working with various BI platforms for several years. We have very good project experience, which allows us to compare platforms from the point of view of developers, analysts, business users and implementers of BI systems.
We will have a separate article on comparing prices and the visual design of these BI systems, so here we will try to evaluate these systems precisely from the point of view of the analyst and developer.
We single out several areas for analysis and evaluate according to a 3-point system:
- Entry threshold and analyst requirements;
- data sources;
- Data cleaning, ETL (Extract, Transform, Load)
- Visualization and development
- Corporate environment - server, reports
- Mobile device support
- Embedded (built-in) analytics in third-party applications / sites
1. Entry Threshold and Analyst Requirements
Power BI
I saw many Power BI users who were not IT specialists, but who could create a good report. Power BI uses the same query language as Excel - Power Query and the DAX formula language. Many analysts know Excel well, so switching to this BI system is pretty easy for them.
Most of the actions are not complicated enough in the query editor. Plus there is an advanced editor with the M language for professionals.
Figure 2. Power BI query designer
Qlik Sense
Qlik Sense looks very friendly - a small number of settings, a quick ability to create a report, you can use the data loading constructor.
At first, it seems simpler than Power BI and Tableau. But from experience I’ll say that after a while, when the analyst creates a couple of simple reports and needs something more complicated, he will be faced with the need to program.
Qlik has a very powerful language for loading and processing data. There is a proprietary formula language Set Analysis. Therefore, the analyst must be able to write queries and connections, put data in virtual tables, and actively use variables. The possibilities of the language are very wide, but it will require its study. Probably all the Qlik analysts I know have some kind of serious IT background.
Qlik integrators, like us, often like to talk about the associative model, when when loading data they are all placed in RAM, and the communication between the data is carried out by the internal mechanism of the platform. That at a choice of values, internal subqueries are not made, as in classical databases. Data is generated almost instantly due to pre-indexed values and relationships.
True in practice, this leads to the creation of automatic table joins when field names match. For example, you cannot have different tables without relationships that have the same field. You have to get used to it. You have to either rename the columns and make sure that the names do not match, or combine all the fact tables into one and surround them with directories of the “star” type. Probably it’s convenient for beginners, but for experienced analysts it makes no difference.
A typical analytics data loading and processing interface looks like this.
Figure 3. Qlik Sense data loading editor, Calendar table
Note: In Power BI, the situation usually looks different, you leave different fact tables and reference books, you can manually join the tables in the classical way, i.e. I map the columns to each other manually.
Tableau
Tableau developers position themselves as BI with a convenient and user-friendly interface that will allow the analyst to independently study their data. Yes, in our company there were analysts who could make their reports without IT experience. But I’ll lower the evaluation of Tableau for several reasons:
- Weak localization with the Russian language
- Tableau Online servers are not in the Russian Federation
- A fairly simple download constructor starts to cause problems when you need to build a rather complex data model.
Figure 4. Tableau data load constructor
One of the questions we ask at the interview with Tableau analysts is “How to build a model of fact tables with reference tables without bringing everything into a single table ?!” Data blending requires thoughtful use. I have corrected many times my analytics data duplication errors after such associations.
Plus, Tableau has a rather peculiar system, when you make each chart on a separate sheet Sheet, and then create a Dashboard, where you start to place the created sheets. Then you can create a Story, this is a combination of different Dashboards. Development in Qlik and Power BI is easier in this regard, you immediately threw chart templates on the sheet, set measures and dimensions, and the Dashboard is ready. It seems to me that the labor costs for preparing at Tableau are increasing.
2. Data Sources and Download
There is no clear leader in this section, but we will highlight Qlik due to a couple of nice features.
Tableau in the free version is limited in sources, but in our articles we focus more on business, and business can afford commercial products and analysts. Therefore, Tableau did not lower the score for this parameter.
Figure 5. List of possible Tableau sources
Otherwise, the list of sources is impressive everywhere - all table files, all standard databases, web connections, everything works everywhere. I didn’t come across non-standard data storages, maybe there are some nuances there, but in most cases you will not have problems loading data. The exception is perhaps only 1C. There are no direct connectors to 1C.
Qlik partners in Russia sell their own connectors for 100,000 - 200,000 rubles, but in most cases it is cheaper to upload from 1C to FTP to Excel or SQL database. And you can publish the 1C database on the web and connect to it using the Odata protocol.
PowerBI and Tableau can do this as standard, but Qlik will ask for a paid connector, so it’s also easier to upload to an intermediate database. In any case, all connection issues can be resolved.
Figure 6. List of possible sources of Qlik Sense In
addition, it is worth noting the feature of Qlik that they supply both paid and free connectors as a separate product.
Figure 7. Additional Qlik Sense Connectors
I’ll add from experience that with large amounts of data or numerous sources it is not always advisable to connect a BI system right away. Serious projects usually use a data warehouse, a database with data already prepared for analysis, etc. You can’t take and upload say 1 billion records in the BI system. Here it is already necessary to think over the architecture of the solution.
Figure 8. Power BI data sources
But why isolate Qlik? I really like 3 things:
- QVD files
Own data storage format. Sometimes you can build serious commercial projects only on QVD files. For example, the first level is raw data. The second level is processed files. The third level is aggregated data, etc. These files can be used in different applications, different employees and services can be responsible for them. The download speed from such files is ten times faster than from conventional data sources. This allows you to save on the database and exchange information between different Qlik applications.
- Incremental data loading
Yes, Power BI and Tableau can also do this. But Power BI will require an expensive Premium version, and Tableau does not have the same flexibility as Qlik. In Qlik on QVD files, you can take system snapshots at different times and then process this data as you like
- Connection of external scripts
In addition to QVD files for data storage, in Qlik script code can also be moved outside the application and connected using the Include command. This already allows you to organize teamwork, use version control systems, manage a single code for different applications. Power BI has an advanced query editor, but we could not configure such teamwork as in Qlik. In general, all BIs have problems with this; it is simply impossible to manage data and code and visualizations in all applications from a single place. The maximum that we were able to do was render QVD files and script code. Visual elements have to be edited inside the reports themselves, which does not allow us to massively change the visualizations of all clients at the same time.
But what about a mechanism like a Live connection? Tableau and Power BI support a LIVE connection to a number of sources, unlike Qlik. We are rather indifferent to this feature, because practice shows that when it comes to big data, working with a LIVE connection becomes simply impossible. And in most cases, BI is needed for big data.
3. Data cleaning, ETL (Extract, Transform, Load)
In this section, I have 2 leaders, Qlik Sense and Power Bi.
Let's just say Qlik is powerful, but difficult. You will understand their SQL-like language and you will be able to do almost everything - virtual tables, joins and joining tables, cycle through the table and generate new tables, a bunch of row processing commands. For example, a field in 1 cell, which is clogged with data like “Ivanov 851 White” on the fly, can be decomposed not only into 3 columns (as everyone knows), but immediately into 3 lines, for example. The same thing on the fly to make combining 3 lines in 1 is also easy.
Figure 9. How to load and transpose a table in Qlik Sense from Google Sheets
Power BI in this regard is simpler, but most tasks are easily solved through the query designer. Set a number of parameters, transposed the table, worked on the data, and all this without a single line of code.
Figure 10. How to load and transpose a table in Power BI from AmoCRM
Tableau seems to have a different ideology. They are more for beauty and design. Connecting a bunch of different sources, combining them all and processing inside Tableau seems to me very difficult. In commercial projects, in most cases Tableau already prepares and accumulates data in storages and databases.
Figure 11. How to load and transpose a table in Tableau
4. Visualization
In this section, we did not highlight the leader. We will have a separate article where, using the example of one case, we will show the same report in all 3 systems (Article “Analytics of girls with low social responsibility”) . There is more to do with the taste and skill of the analyst. On the Internet, you can find very beautiful pictures built on the basis of any of these systems. Basic visualization capabilities are about the same for everyone. The rest is solved using Extensons. There are paid, free. There are extensions from the vendors themselves, as well as from freelancers and integrators. You yourself can write your own visualization extension for any platform.
I like the style of Tableau, I consider it strict and corporate. But getting a truly beautiful picture in Tableau is hard. A great example of Tableau renderings that use only extensions. I will not be able to repeat this, because I do not have these extensions, but it looks beautiful.
Figure 12. Appearance of Tableau reports with Extensions
Power BI can also be made interesting.
Figure 13. Appearance of Power Bi reports with Extensions
The only thing I don’t understand in Power BI is why they have such strange colors by default. On any chart, I have to change the color to my own corporate, corporate one and am amazed at the standard color.
Qlik Sense is also dependent on Extensions. The use of add-ons can alter reports beyond recognition. You can also roll your own theme and design.
Figure 14. Appearance of Qlik Sense reports with Extensions
From the point of view of the developer, Qlik Sense is more convenient for me because of the standard options as alternative measurements and measures. It is possible to set several dimensions and measures in the visualization settings, and the user can easily specify what he should look at on a particular chart.
In Power Bi and Tableau, I have to configure the parameters, buttons, and program the behavior of the system depending on these parameters. I wonder why it is so difficult. The same thing with the ability to change the type of viloise.
In Qlik, you can hide different types of visualizations in one object, and in Power BI and Tableau this is more difficult. Again, it depends more on the skill of the performer. You can make a masterpiece in any system, but without experience, inexpressive graphics will be obtained everywhere.
5. Corporate environment - server, reports
All products have enterprise server versions. I worked with all editions and I can say that everyone has strengths and weaknesses. The choice of product should be selected from your software requirements, taking into account their nuances. All vendors can be granted rights both at the level of accounts and groups, and at the level of Data Row Level Security. Scheduled reports are automatically updated.
Qlik Sense Enterprise is a great opportunity to build analytics within your organization for medium-sized businesses. It may seem more expensive than Power BI Pro, but do not forget that Power BI Pro servers are located in the cloud on the territory of Microsoft and you can not affect performance, and when you need Power BI Premium, which can be deployed on your servers, then The price starts from $ 5000 per month.
Qlik Sense Enterprise starts at 230,000 rubles. for 5 licenses (annual fee, then only technical support), which is much more affordable than Power BI Premium. And Qlik Sense Enterprise will enable you to take full advantage of Qlik. Perhaps except one. For some reason, Qlik decided that such a function as the ability to send reports to PDF by e-mail should be delivered as a separate NPrinting service.
But Qlik Sense Enterprise is more powerful than Power BI Pro, and so the following comparison can be made here.
Qlik Sense Enterprise = Power BI Premium, with equal capabilities, is cheaper with average deployments. Large implementations are usually calculated already on the side of the vendor, where they can give individual conditions for your company.
In this regard, we will give preference to Qlik Sense Enterprise, there is every opportunity to build serious analytics on huge data. In our opinion, Qlik will run faster than Power BI on large arrays, at Qlik conferences there were clients who at first tested their data in billions of records and Power BI showed worse results.
Figure 15. Appearance of Qlik Sense Enterprise server reports
Qlik Sense Cloud = Power BI Pro. Qlik Sense Cloud is 1.5 times more expensive * and there is a very significant limitation that this platform does not allow us to. You can not use Extensions, even built-in. And without extensions, Qlik somewhat loses its visual beauty.
Figure 16. Appearance of the Power BI Pro control panel
* An alternative is to use Qlik Sense Enterprise by subscription. But so that this article is not perceived as advertising, we will not cover our pricing
And Tableau is a little out of the way for us. They have both cloud subscriptions of $ 70 per developer and $ 15 per view, and expensive server solutions. But the main idea of Tableau is that for big data you need to process data and store it on the side. Objectively less functionality does not allow serious data processing in Tableau. Visualize, analyze, yes. But for small and medium-sized businesses it is usually difficult to create a separate storage. I would have underestimated the score for Tableau therefore, if not for their 1 chip. The Tableau server sends emails without a problem on a schedule with attachments in CSV or PDF. And you can do the distribution of rights, autofilters and more. For some reason, Power BI and Qlik cannot do this, but to someone it can be critical. Due to this, Tableau maintains a position in our dispute.
Figure 17. Appearance of the Tableau Server control panel
Also in the corporate environment, you need to think about the cost of implementation and maintenance. In Russia, the practice has developed that Power BI is more common in small businesses. This led to the emergence of a large number of vacancies and resumes, the emergence of small integrators. This will allow you to find specialists for a small project. But most likely all of them will not have the experience of large implementations and work with big data. Qlik and Tableau are the other way around. There are few Qlik partners, and Tableau even fewer. These partners specialize in large deployments with a large average bill. There are not many vacancies and resumes on the market, the threshold for entering these products is more complicated than in Power BI. But in Russia there are successful introductions of these products to thousands of users and these products show themselves well on big data.
6. Support mobile devices.
In this section, we highlight Power BI and Tableau. You can install mobile applications and they will look quite adequately on the screens of mobile devices. Although it seems to us analytics on mobile devices loses analytics on a PC. All the same, it’s not so convenient to use filters, the pictures are small, the numbers are hard to see, etc.
Figure 18. Appearance of Power BI report on iPhone
Figure 19. Appearance of Tableau report on iPhone
Figure 20. Appearance of Qlik Sense report on iPhone
Why are Qlik points underestimated? For reasons unknown to us, the mobile client is available only on the iPhone; on Android, you will have to use a regular browser. Plus, when using Qlik, you immediately have to understand that a number of Extension or visualizations are not reduced or auto positioned in mobile devices as expected. A report that looks very nice on a PC looks much worse on a small screen. It is necessary for mobile devices to make a separate report, where to remove filters, KPI and a number of objects. This also applies to Power BI or Tableau, but in Qlik is especially pronounced. We hope Qlik will work on its mobile client.
If you plan to conduct analytics from mobile devices a lot of time, then it makes sense to put all 3 clients and check their display on test reports. Any vendor on its website has a gallery of test reports for review.
7. Embedded analytics in third-party applications / sites
Using analytics as a third-party service is not always convenient. Perhaps you are developing your product, but you are not ready to start developing the visualization and analytics engine from scratch. Perhaps you want to deploy analytics on your website so that the client registers, uploads his data and analyzes inside his personal account. To do this, you need Embedded Analytics.
All products allow you to do this, but in this category we highlight Qlik.
Power Bi and Tableau clearly say that for such purposes you need to buy a separate product Tableau Embedded Analytics or Power BI Embedded. These are not cheap solutions in thousands of dollars per month, which immediately limits their use. Most projects immediately become unprofitable for our customers. This means that you need not only to publish a report of the entire Internet, but to ensure the publication of reports according to certain accesses, with data protection, user authorization, etc.
And Qlik will let you get out. Of course, they also have a Qlik Analytics Platform which is licensed to the server and organizes an unlimited number of connections. It will also be expensive like the competitors Tableau and Power Bi. And in the case of unlimited connections, there are not particularly options.
But Qlik has a concept like Mashup. Let's say you have Qlik Sense Enterprise and 10 licenses. Standard analytics, appearance, everything is already tired. You raise your own website or application, and you can implement all your analytics right there. The trick is that, to put it simply, Mashup is a visualization in program code. By API, you can programmatically set up the creation of visualization inside your application or site. You will still need Qlik Sense Enterprise for licensing (licenses for connecting to the site = licenses for connecting to BI), for downloading data, etc., but the visualizations will not already be displayed on the server side, but will be built into your application or site. You can use CSS styles, set new fonts, colors. Your 10 users will no longer log into the analytics server, They will use your corporate portal or application. Analytics will reach a new level.
Figure 21. Appearance of the Qlik Sense report embedded on the website
It will already be difficult to understand where the elements of the site are and where Qlik Sense is already starting.
Of course, you will need a programmer, or rather a few. One for web programming, one for working with the Qlik API. But the result is worth it.
Conclusions. To summarize.
It is difficult to say unequivocally who is better and who is worse. Power BI and Qlik in our competition are on a par, Tableau is slightly inferior. But perhaps for your business the result will be different. In BI platforms, the visual component is very important. If you have watched dozens of demo reports and pictures on the Internet for all BI systems and you don’t like how one of the platforms looks, then most likely you will not implement it, even if you are satisfied with the price or those. specifications.
Next, you will definitely need to calculate the cost of licenses, implementation and content of the BI platform. Perhaps in your case a leader will be revealed. Of great importance is the contractor or the ability to hire a suitable specialist. Without professionals in any platform, the result will be disastrous.
Successful BI-integration for you, Andrey Zhdanov and Vladimir Lazarev, Analitiks Group