What inflates memory in Ruby?
- Transfer
We at Phusion have a simple multi-threaded HTTP proxy in Ruby (distributes DEB and RPM packages). I saw on it a memory consumption of 1.3 GB. But this is crazy for a stateless process ...
Question: What is it? Answer: Ruby uses memory over time!
It turns out I'm not alone in this problem. Ruby applications can use a lot of memory. But why? According to Heroku and Nate Burkopek , bloating is mainly due to memory fragmentation and excessive heap distribution.
Berkopek concluded that there are two solutions:
I am worried about the description of the problem and the proposed solutions. There is something wrong here ... I am not sure that the problem is fully described correctly or that these are the only solutions available. It also annoys me that many refer to jemalloc as a magical silver pool.
Magic is just a science that we don’t understand yet . So I went on a research trip to find out the whole truth. This article will cover the following topics:
Note: this article is relevant only for Linux, and only for multi-threaded Ruby applications.
Ruby allocates memory at three levels, from top to bottom:
Let's go through each level.
On its side, Ruby organizes objects in areas of memory called the Ruby heap pages . Such a heap page is divided into slots of the same size, where one object occupies one slot. Whether it is a string, a hash table, an array, a class, or something else, it occupies one slot.

The slots on the heap page may be busy or free. When Ruby selects a new object, it immediately tries to occupy a free slot. If there are no free slots, a new heap page will be highlighted.
The slot is small, about 40 bytes. Obviously, some objects will not fit in it, for example, 1 MB lines. Then Ruby stores the information elsewhere outside the heap page, and places a pointer to this external memory area in the slot.

Data that does not fit in the slot is stored outside the heap page. Ruby places a pointer to this external data in the slot.
Both the pages of the Ruby heap and any external memory areas are allocated using the system memory allocator.
The operating system memory allocator is part of glibc (C runtime). It is used by almost all applications, not just Ruby. It has a simple API:
Unlike Ruby, where slots of the same size are allocated, the memory allocator deals with requests for allocating memory of any size. As you will learn later, this fact leads to some complications.
In turn, the memory allocator accesses the kernel API. It takes much larger chunks of memory from the kernel than its own subscribers request, since the kernel call is expensive and the kernel API has a limitation: it can only allocate memory in multiples of 4 KB.
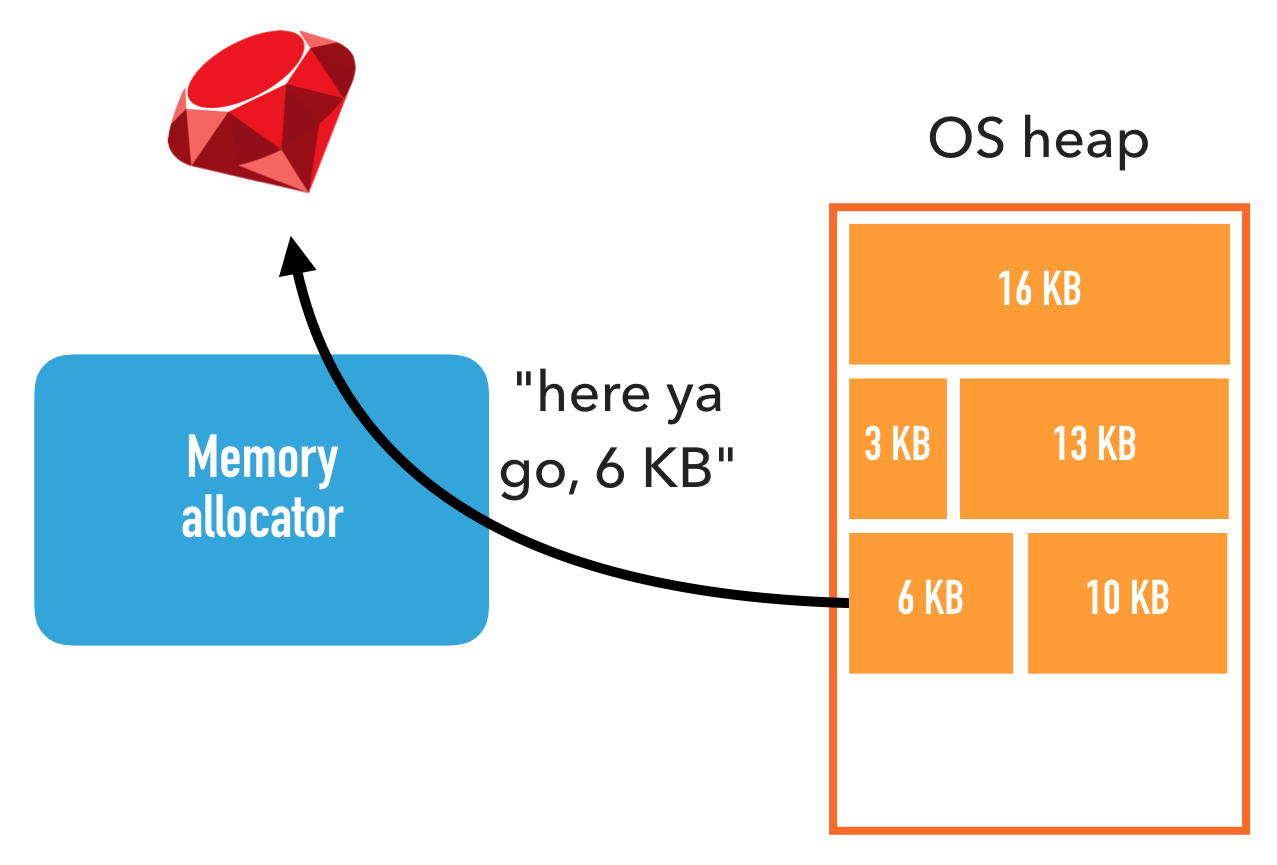
The memory allocator allocates large chunks - they are called system heaps - and divides their contents to satisfy requests from applications
The area of memory that the memory allocator allocates from the kernel is called the heap. Note that it has nothing to do with the pages of the Ruby heap, so for clarity we will use the term system heap .
The memory allocator then assigns parts of the system heaps to its callers until there is free space. In this case, the memory allocator allocates a new system heap from the kernel. This is similar to how Ruby selects objects from the pages of a Ruby heap.
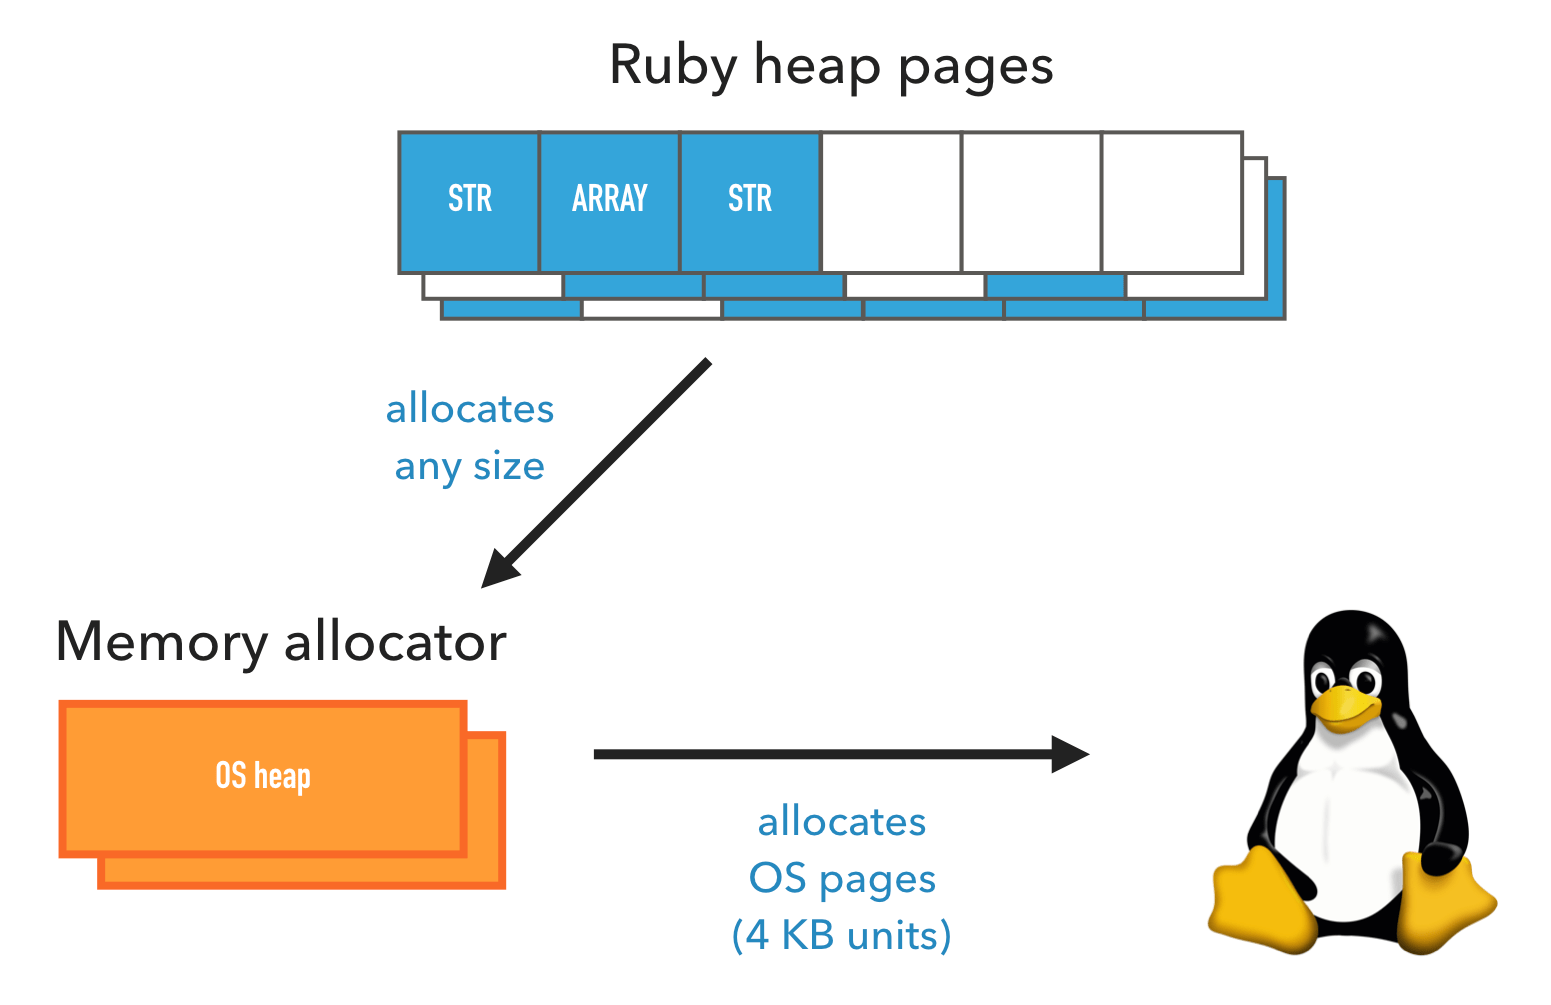
Ruby allocates memory from the memory allocator, which in turn allocates memory from the kernel
The kernel can only allocate memory in 4 KB units. One such 4K block is called a page. To avoid confusion with the Ruby heap pages, for clarity we will use the term system page (OS page).
The reason is difficult to explain, but this is how all modern kernels work.
Allocating memory through the kernel has a significant impact on performance, which is why memory allocators try to minimize the number of kernel calls.
Thus, memory is allocated at several levels, and each level allocates more memory than it really needs. Ruby heap pages can have free slots, as well as system heaps. Therefore, the answer to the question “How much memory is used?” Completely depends on what level you are asking!
Tools like
Memory fragmentation means that memory allocations are randomly scattered. This can cause interesting problems.
Consider Ruby garbage collection. Garbage collection for an object means marking the Ruby heap page slot as free, allowing it to be reused. If the entire page of the Ruby heap consists only of free slots, then its entire page can be freed back to the memory allocator (and, possibly, back to the kernel).
But what happens if not all slots are free? What if we have many pages of the Ruby heap and the garbage collector frees objects in different places, so that in the end there are many free slots, but on different pages? In this situation, Ruby has free slots for placing objects, but the memory allocator and kernel will continue to allocate memory!
The memory allocator has a similar but completely different problem. He does not need to immediately clear entire system heaps. Theoretically, it can free up any single system page. But since the memory allocator deals with memory allocations of arbitrary size, there may be several allocations on the system page. It cannot free the system page until all selections are freed.
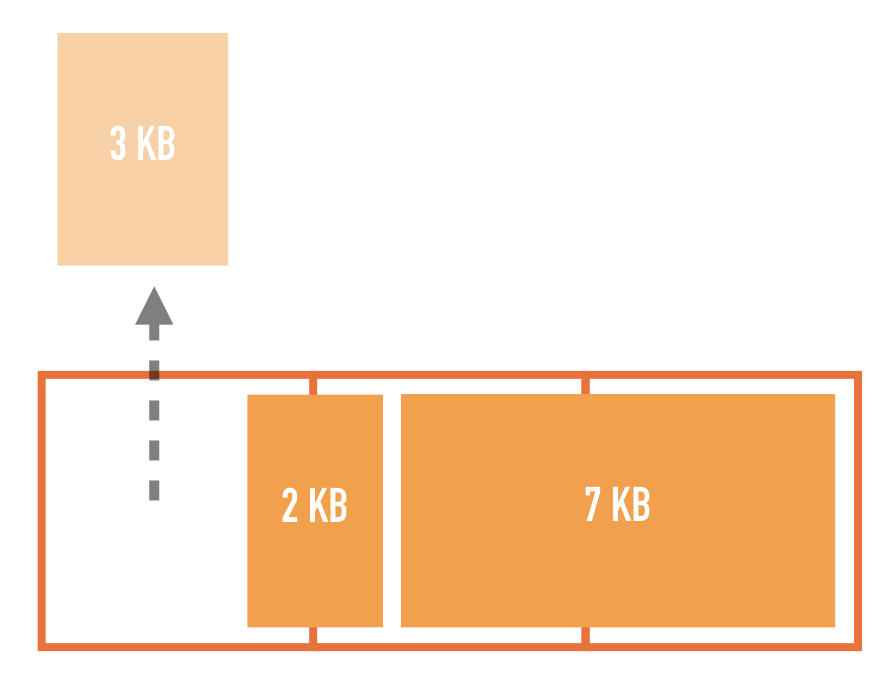
Think about what happens if we have a 3 KB allocation, as well as a 2 KB allocation, divided into two system pages. If you free the first 3 KB, both system pages will remain partially occupied and cannot be freed.

Therefore, if circumstances fail, there will be a lot of free space on the system pages, but they will not be freed up entirely.
Even worse: what if there are a lot of free places, but not one of them is large enough to satisfy a new allocation request? The memory allocator will have to allocate a whole new system heap.
It is likely that fragmentation is causing memory overuse in Ruby. If so, which of the two fragmentations is more harmful? It…
The first option is quite simple to check. Ruby provides two APIs:

To summarize them, this is all the memory that Ruby knows about, and it involves fragmenting the pages of the Ruby heap. If, from a kernel point of view, memory usage is higher, then the remaining memory goes somewhere outside the control of Ruby, for example, to third-party libraries or fragmentation.
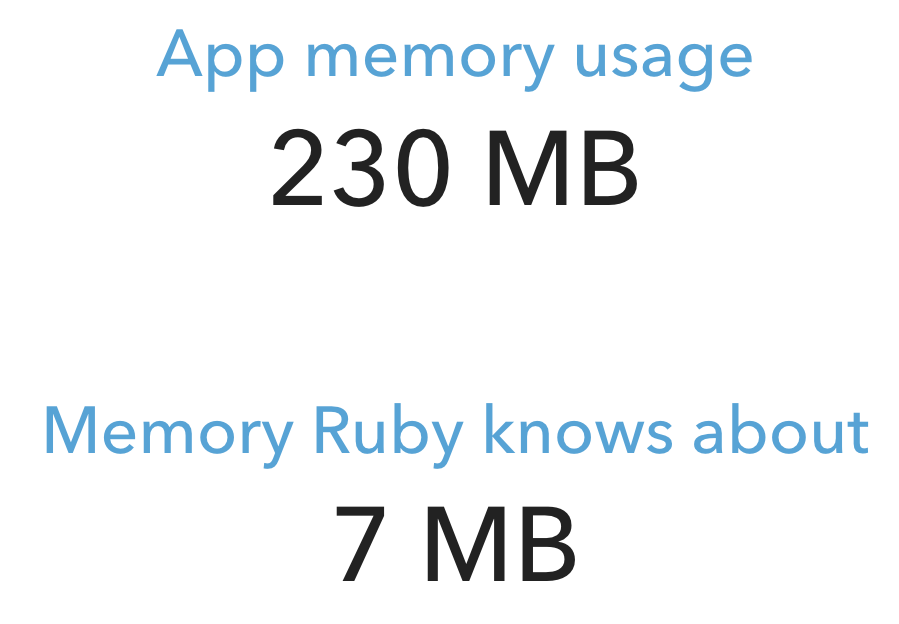
I wrote a simple test program that creates a bunch of threads, each of which selects lines in a loop. Here is the result after a while:
it's ... just ... crazy!
The result shows that Ruby has such a weak effect on the total amount of memory used, it does not matter if the pages of the Ruby heap are fragmented or not.
Have to look for the culprit elsewhere. At least now we know that Ruby is not to blame.
Another likely suspect is a memory allocator. In the end, Nate Berkopek and Heroku noticed that fussing with a memory allocator (either a full replacement for jemalloc or setting a magic environment variable
Let's first see what it does
The reason why it helps

Only one thread at a time can work with the system heap. In multi-threaded tasks, a conflict arises and, consequently, performance decreases.
There is optimization in the memory allocator for this case. He tries to create several system heaps and assign them to different threads. Most of the time a thread only works with its own heap, avoiding conflicts with other threads.
In fact, the maximum number of system heaps allocated in this way is by default equal to the number of virtual processors multiplied by 8. That is, in a dual-core system with two hyper-threads, each produces
Why is the default multiplier so big? Because the leading developer of the memory allocator is Red Hat. Their customers are large companies with powerful servers and a ton of RAM. The above optimization allows you to increase the average multithreading performance by 10% due to a significant increase in memory usage. For Red Hat customers, this is a good compromise. For most of the rest - hardly.
Nate in her blog and Heroku article claim that increasing the number of system heaps increases fragmentation, and cite official documentation. The variable
Is the statement by Nate and Heroku true that increasing the number of system heaps increases fragmentation? In fact, is there any problem with fragmentation at the memory allocator level? I did not want to take any of these assumptions for granted, so I started the study.
Unfortunately, there are no tools for visualizing system heaps, so I wrote such a visualizer myself .
First, you need to somehow preserve the distribution scheme of system heaps. I studied the source of the memory allocatorand watched how he internally represents the memory. Then he wrote a library that iterates over these data structures and writes the schema to a file. Finally, he wrote a tool that takes such a file as input and compiles the visualization as HTML and PNG images ( source code ).
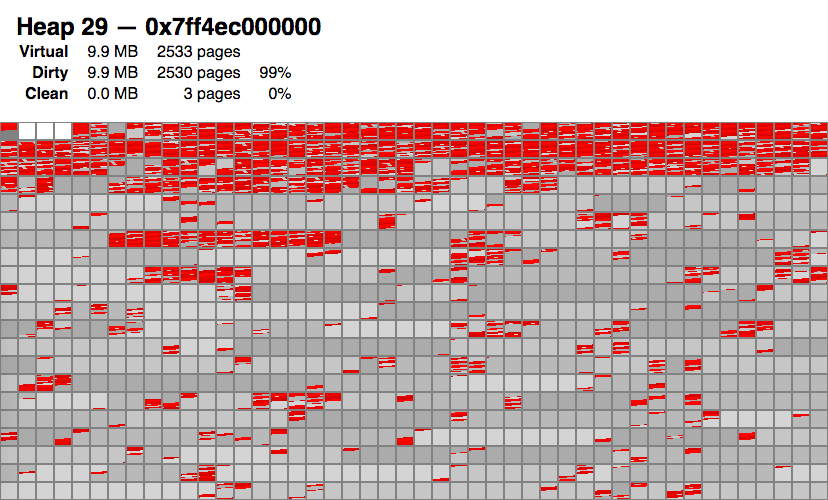
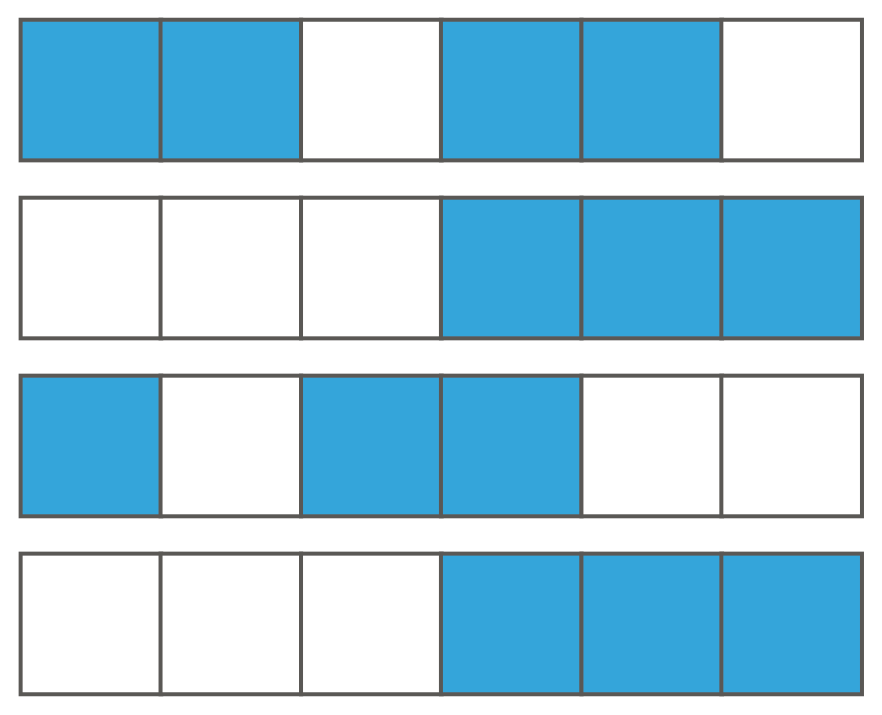
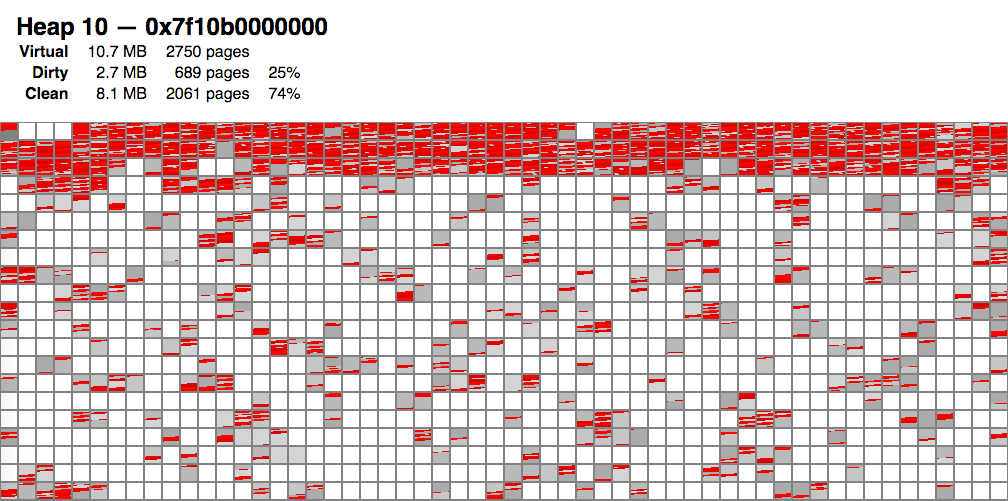
Here is an example of visualizing one specific system heap (there are many more). Small blocks in this visualization represent system pages.
The following conclusions can be drawn from visualization:
And then it dawned on me:
Although fragmentation remains a problem, it is not the point!
Rather, the problem is a lot of gray: this memory allocator does not send memory back to the kernel !
After re-studying the source code of the memory allocator, it turned out that by default it only sends system pages to the kernel at the end of the system heap, and even rarely does it . Probably, such an algorithm is implemented for performance reasons.
Fortunately, I found one trick. There is one programming interface that will force the memory allocator to release for the kernel not only the last, but all the relevant system pages. It is called malloc_trim .
I knew about this function, but I did not think it was useful, because the manual says the following:
The manual is wrong! Analysis of the source code says that the program frees up all relevant system pages, not just the top.
What happens if this function is called during garbage collection? I modified the Ruby 2.6 source code to call
And here are the test results:
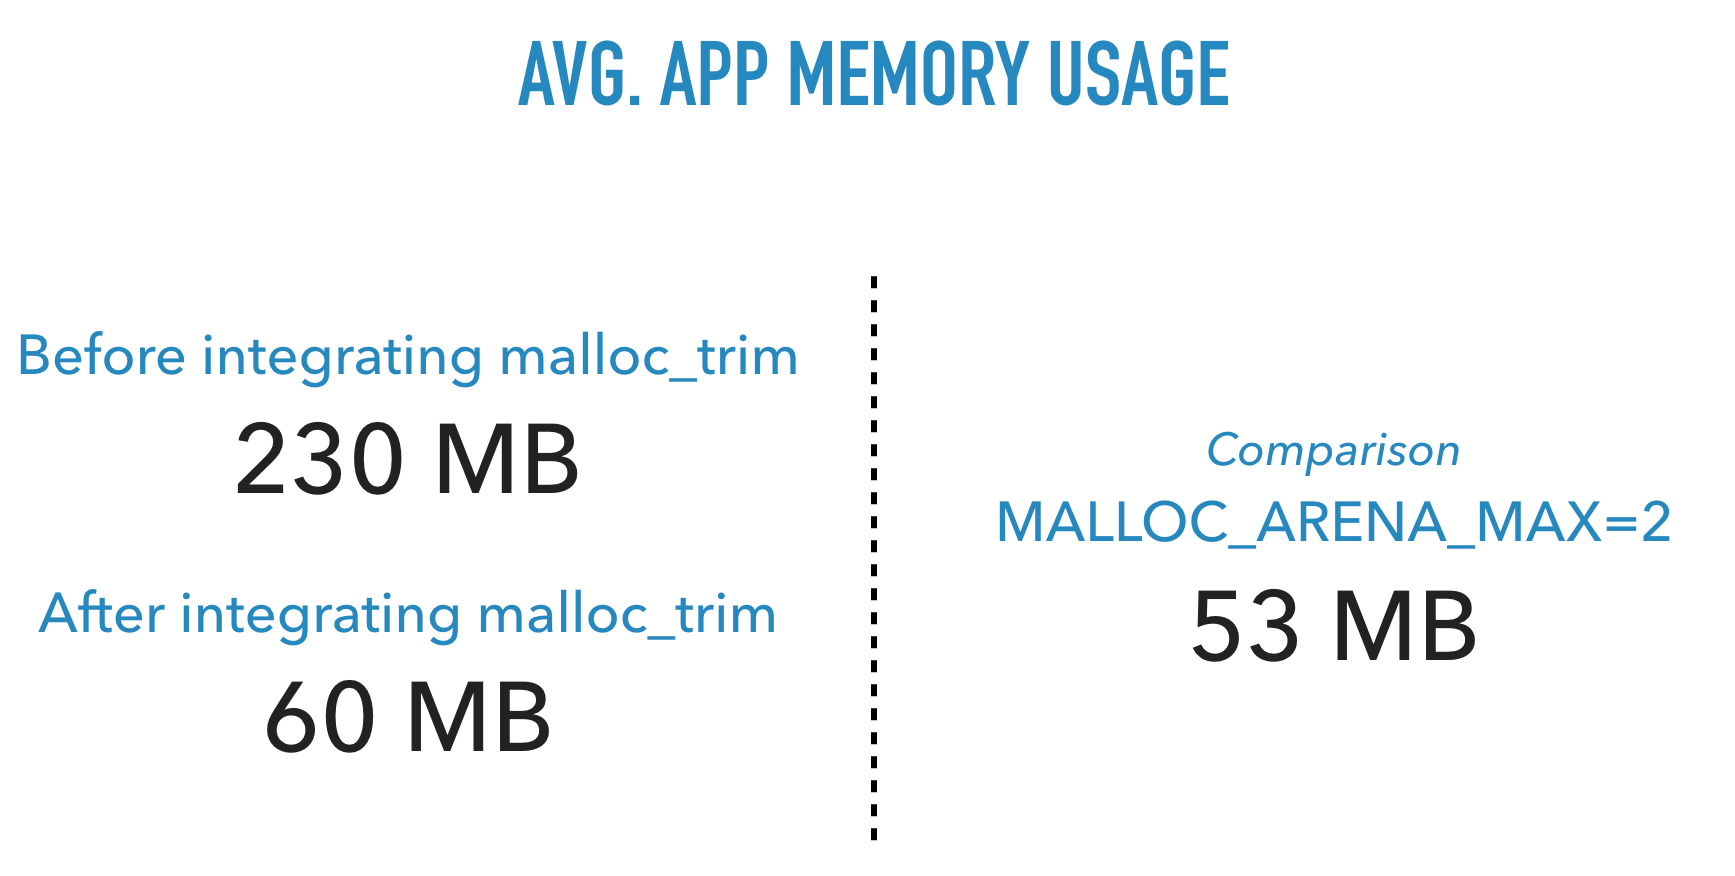
What a big difference! A simple patch reduced memory consumption by almost a level
Here's how it looks in the visualization:
We see many white areas that correspond to system pages freed back to the kernel.
It turned out that fragmentation, basically, had nothing to do with it. Defragmentation is still useful, but the main problem is that the memory allocator does not like to free memory back to the kernel.
Fortunately, the solution turned out to be very simple. The main thing was to find the root cause.
Source
Performance remained one of the main concerns. A call

It blew my mind. The effect is incomprehensible, but the news is good.
As part of this study, only a limited number of cases have been verified. It is not known what the impact on other workloads is. If you want to help with testing, please contact me .
Question: What is it? Answer: Ruby uses memory over time!
It turns out I'm not alone in this problem. Ruby applications can use a lot of memory. But why? According to Heroku and Nate Burkopek , bloating is mainly due to memory fragmentation and excessive heap distribution.
Berkopek concluded that there are two solutions:
- Either use a completely different memory allocator than glibc - usually jemalloc , or:
- Set the magic environment variable
MALLOC_ARENA_MAX=2.
I am worried about the description of the problem and the proposed solutions. There is something wrong here ... I am not sure that the problem is fully described correctly or that these are the only solutions available. It also annoys me that many refer to jemalloc as a magical silver pool.
Magic is just a science that we don’t understand yet . So I went on a research trip to find out the whole truth. This article will cover the following topics:
- How memory allocation works.
- What is this “fragmentation” and “excessive distribution” of memory that everyone is talking about?
- What causes a large memory consumption? Is the situation consistent with what people are saying, or is there something else? (spoiler: yes, there is something else).
- Are there any alternative solutions? (spoiler: I found one).
Note: this article is relevant only for Linux, and only for multi-threaded Ruby applications.
Content
- Ruby Memory Allocation: An Introduction
- What is fragmentation?
- Is Ruby heap page fragmentation causing memory bloat?
- Memory Allocation Fragmentation Study
- Magic Trick: Circumcision
- Conclusion
Ruby Memory Allocation: An Introduction
Ruby allocates memory at three levels, from top to bottom:
- Ruby interpreter that manages Ruby objects.
- The memory allocator library of the operating system.
- Core.
Let's go through each level.
Ruby
On its side, Ruby organizes objects in areas of memory called the Ruby heap pages . Such a heap page is divided into slots of the same size, where one object occupies one slot. Whether it is a string, a hash table, an array, a class, or something else, it occupies one slot.
The slots on the heap page may be busy or free. When Ruby selects a new object, it immediately tries to occupy a free slot. If there are no free slots, a new heap page will be highlighted.
The slot is small, about 40 bytes. Obviously, some objects will not fit in it, for example, 1 MB lines. Then Ruby stores the information elsewhere outside the heap page, and places a pointer to this external memory area in the slot.
Data that does not fit in the slot is stored outside the heap page. Ruby places a pointer to this external data in the slot.
Both the pages of the Ruby heap and any external memory areas are allocated using the system memory allocator.
System memory allocator
The operating system memory allocator is part of glibc (C runtime). It is used by almost all applications, not just Ruby. It has a simple API:
- The memory is allocated by a call
malloc(size). You give it the number of bytes you want to allocate, and it returns either the allocation address or an error. - The allocated memory is freed by the call
free(address).
Unlike Ruby, where slots of the same size are allocated, the memory allocator deals with requests for allocating memory of any size. As you will learn later, this fact leads to some complications.
In turn, the memory allocator accesses the kernel API. It takes much larger chunks of memory from the kernel than its own subscribers request, since the kernel call is expensive and the kernel API has a limitation: it can only allocate memory in multiples of 4 KB.
The memory allocator allocates large chunks - they are called system heaps - and divides their contents to satisfy requests from applications
The area of memory that the memory allocator allocates from the kernel is called the heap. Note that it has nothing to do with the pages of the Ruby heap, so for clarity we will use the term system heap .
The memory allocator then assigns parts of the system heaps to its callers until there is free space. In this case, the memory allocator allocates a new system heap from the kernel. This is similar to how Ruby selects objects from the pages of a Ruby heap.
Ruby allocates memory from the memory allocator, which in turn allocates memory from the kernel
Core
The kernel can only allocate memory in 4 KB units. One such 4K block is called a page. To avoid confusion with the Ruby heap pages, for clarity we will use the term system page (OS page).
The reason is difficult to explain, but this is how all modern kernels work.
Allocating memory through the kernel has a significant impact on performance, which is why memory allocators try to minimize the number of kernel calls.
Memory usage definition
Thus, memory is allocated at several levels, and each level allocates more memory than it really needs. Ruby heap pages can have free slots, as well as system heaps. Therefore, the answer to the question “How much memory is used?” Completely depends on what level you are asking!
Tools like
topor psshow memory usage from a kernel perspective . This means that higher levels must work in concert to free memory from a kernel point of view. As you will learn later, this is harder than it sounds.What is fragmentation?
Memory fragmentation means that memory allocations are randomly scattered. This can cause interesting problems.
Ruby Level Fragmentation
Consider Ruby garbage collection. Garbage collection for an object means marking the Ruby heap page slot as free, allowing it to be reused. If the entire page of the Ruby heap consists only of free slots, then its entire page can be freed back to the memory allocator (and, possibly, back to the kernel).
But what happens if not all slots are free? What if we have many pages of the Ruby heap and the garbage collector frees objects in different places, so that in the end there are many free slots, but on different pages? In this situation, Ruby has free slots for placing objects, but the memory allocator and kernel will continue to allocate memory!
Memory Allocation Fragmentation
The memory allocator has a similar but completely different problem. He does not need to immediately clear entire system heaps. Theoretically, it can free up any single system page. But since the memory allocator deals with memory allocations of arbitrary size, there may be several allocations on the system page. It cannot free the system page until all selections are freed.
Think about what happens if we have a 3 KB allocation, as well as a 2 KB allocation, divided into two system pages. If you free the first 3 KB, both system pages will remain partially occupied and cannot be freed.
Therefore, if circumstances fail, there will be a lot of free space on the system pages, but they will not be freed up entirely.
Even worse: what if there are a lot of free places, but not one of them is large enough to satisfy a new allocation request? The memory allocator will have to allocate a whole new system heap.
Is Ruby heap page fragmentation causing memory bloat?
It is likely that fragmentation is causing memory overuse in Ruby. If so, which of the two fragmentations is more harmful? It…
- Ruby heap page fragmentation? Or
- Memory allocator fragmentation?
The first option is quite simple to check. Ruby provides two APIs:
ObjectSpace.memsize_of_alland GC.stat. Thanks to this information, you can calculate all the memory that Ruby received from the allocator.ObjectSpace.memsize_of_allreturns the memory occupied by all active Ruby objects. That is, all the space in their slots and any external data. In the above diagram, this is the size of all blue and orange objects. GC.statallows you to find out the size of all free slots, i.e. the entire gray area in the illustration above. Here is the algorithm:GC.stat[:heap_free_slots] * GC::INTERNAL_CONSTANTS[:RVALUE_SIZE]To summarize them, this is all the memory that Ruby knows about, and it involves fragmenting the pages of the Ruby heap. If, from a kernel point of view, memory usage is higher, then the remaining memory goes somewhere outside the control of Ruby, for example, to third-party libraries or fragmentation.
I wrote a simple test program that creates a bunch of threads, each of which selects lines in a loop. Here is the result after a while:
it's ... just ... crazy!
The result shows that Ruby has such a weak effect on the total amount of memory used, it does not matter if the pages of the Ruby heap are fragmented or not.
Have to look for the culprit elsewhere. At least now we know that Ruby is not to blame.
Memory Allocation Fragmentation Study
Another likely suspect is a memory allocator. In the end, Nate Berkopek and Heroku noticed that fussing with a memory allocator (either a full replacement for jemalloc or setting a magic environment variable
MALLOC_ARENA_MAX=2) drastically reduces memory usage. Let's first see what it does
MALLOC_ARENA_MAX=2and why it helps. Then we examine fragmentation at the distributor level.Excessive memory allocation and glibc
The reason why it helps
MALLOC_ARENA_MAX=2is multithreading. When multiple threads simultaneously try to allocate memory from the same system heap, they fight for access. Only one thread at a time can receive memory, which reduces the performance of multi-threaded memory allocation.Only one thread at a time can work with the system heap. In multi-threaded tasks, a conflict arises and, consequently, performance decreases.
There is optimization in the memory allocator for this case. He tries to create several system heaps and assign them to different threads. Most of the time a thread only works with its own heap, avoiding conflicts with other threads.
In fact, the maximum number of system heaps allocated in this way is by default equal to the number of virtual processors multiplied by 8. That is, in a dual-core system with two hyper-threads, each produces
2 * 2 * 8 = 32system heaps! This is what I call excessive distribution .Why is the default multiplier so big? Because the leading developer of the memory allocator is Red Hat. Their customers are large companies with powerful servers and a ton of RAM. The above optimization allows you to increase the average multithreading performance by 10% due to a significant increase in memory usage. For Red Hat customers, this is a good compromise. For most of the rest - hardly.
Nate in her blog and Heroku article claim that increasing the number of system heaps increases fragmentation, and cite official documentation. The variable
MALLOC_ARENA_MAXreduces the maximum number of system heaps allocated for multithreading. By this logic, it reduces fragmentation.Visualization of system heaps
Is the statement by Nate and Heroku true that increasing the number of system heaps increases fragmentation? In fact, is there any problem with fragmentation at the memory allocator level? I did not want to take any of these assumptions for granted, so I started the study.
Unfortunately, there are no tools for visualizing system heaps, so I wrote such a visualizer myself .
First, you need to somehow preserve the distribution scheme of system heaps. I studied the source of the memory allocatorand watched how he internally represents the memory. Then he wrote a library that iterates over these data structures and writes the schema to a file. Finally, he wrote a tool that takes such a file as input and compiles the visualization as HTML and PNG images ( source code ).
Here is an example of visualizing one specific system heap (there are many more). Small blocks in this visualization represent system pages.
- Red areas are used memory cells.
- Grays are free areas not released back to the core.
- White areas are freed for the nucleus.
The following conclusions can be drawn from visualization:
- There is some fragmentation. Red spots are scattered from memory, and some system pages are only half red.
- To my surprise, most system heaps contain a significant amount of completely free system pages (gray)!
And then it dawned on me:
Although fragmentation remains a problem, it is not the point!
Rather, the problem is a lot of gray: this memory allocator does not send memory back to the kernel !
After re-studying the source code of the memory allocator, it turned out that by default it only sends system pages to the kernel at the end of the system heap, and even rarely does it . Probably, such an algorithm is implemented for performance reasons.
Magic Trick: Circumcision
Fortunately, I found one trick. There is one programming interface that will force the memory allocator to release for the kernel not only the last, but all the relevant system pages. It is called malloc_trim .
I knew about this function, but I did not think it was useful, because the manual says the following:
The malloc_trim () function tries to free up free memory at the top of the heap.
The manual is wrong! Analysis of the source code says that the program frees up all relevant system pages, not just the top.
What happens if this function is called during garbage collection? I modified the Ruby 2.6 source code to call
malloc_trim()in functions gc_startfrom gc.c, for example:gc_prof_timer_start(objspace);
{
gc_marks(objspace, do_full_mark);
// BEGIN MODIFICATION
if (do_full_mark)
{
malloc_trim(0);
}
// END MODIFICATION
}
gc_prof_timer_stop(objspace);And here are the test results:
What a big difference! A simple patch reduced memory consumption by almost a level
MALLOC_ARENA_MAX=2. Here's how it looks in the visualization:
We see many white areas that correspond to system pages freed back to the kernel.
Conclusion
It turned out that fragmentation, basically, had nothing to do with it. Defragmentation is still useful, but the main problem is that the memory allocator does not like to free memory back to the kernel.
Fortunately, the solution turned out to be very simple. The main thing was to find the root cause.
Visualizer Source Code
Source
What about performance?
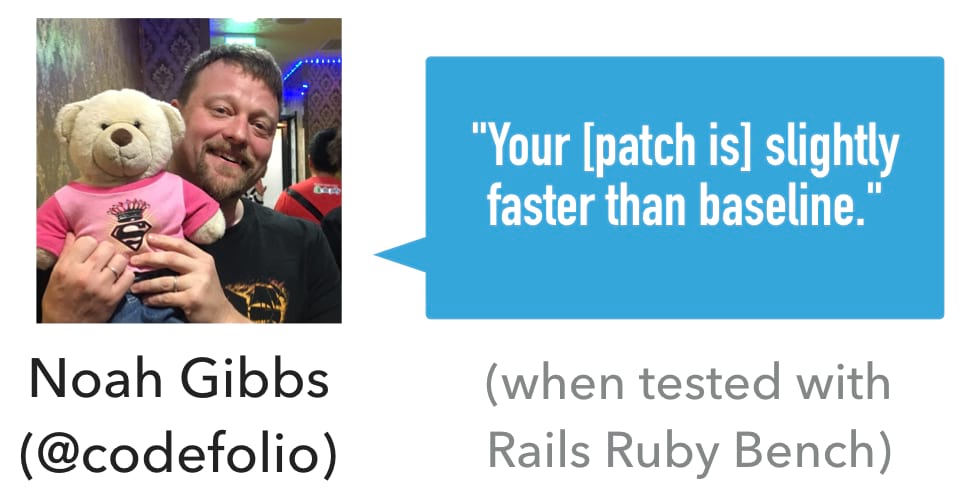
Performance remained one of the main concerns. A call
malloc_trim()cannot cost for free, but according to the code, the algorithm works in linear time. So I turned to Noah Gibbs , who launched the Rails Ruby Bench benchmark. To my surprise, the patch caused a slight increase in performance.It blew my mind. The effect is incomprehensible, but the news is good.
Need more tests.
As part of this study, only a limited number of cases have been verified. It is not known what the impact on other workloads is. If you want to help with testing, please contact me .