6 entertaining system bugs in the operation of Kubernetes [and their solution]

Over the years of operating Kubernetes in production, we have accumulated many interesting stories, as bugs in various system components led to unpleasant and / or incomprehensible consequences that affect the operation of containers and pods. In this article, we have made a selection of some of the most frequent or interesting ones. Even if you are never lucky enough to encounter such situations, reading about such brief detectives - all the more, first-hand - is always entertaining, isn’t that so? ..
History 1. Supercronic and freezing Docker
On one of the clusters, we periodically received a “frozen” Docker, which interfered with the normal functioning of the cluster. At the same time, the following was observed in the Docker logs
level=error msg="containerd: start init process" error="exit status 2: \"runtime/cgo: pthread_create failed: No space left on device
SIGABRT: abort
PC=0x7f31b811a428 m=0
goroutine 0 [idle]:
goroutine 1 [running]:
runtime.systemstack_switch() /usr/local/go/src/runtime/asm_amd64.s:252 fp=0xc420026768 sp=0xc420026760
runtime.main() /usr/local/go/src/runtime/proc.go:127 +0x6c fp=0xc4200267c0 sp=0xc420026768
runtime.goexit() /usr/local/go/src/runtime/asm_amd64.s:2086 +0x1 fp=0xc4200267c8 sp=0xc4200267c0
goroutine 17 [syscall, locked to thread]:
runtime.goexit() /usr/local/go/src/runtime/asm_amd64.s:2086 +0x1
…
This error most interests us a message:
pthread_create failed: No space left on device. A quick study of the documentation explained that Docker could not fork the process, which caused it to “freeze” periodically. In monitoring, what is happening corresponds to the following picture:

A similar situation is observed on other nodes:


On the same nodes we see:
root@kube-node-1 ~ # ps auxfww | grep curl -c
19782
root@kube-node-1 ~ # ps auxfww | grep curl | head
root     16688  0.0  0.0      0     0 ?        Z    Feb06   0:00      |       \_ [curl]
root     17398  0.0  0.0      0     0 ?        Z    Feb06   0:00      |       \_ [curl]
root     16852  0.0  0.0      0     0 ?        Z    Feb06   0:00      |       \_ [curl]
root      9473  0.0  0.0      0     0 ?        Z    Feb06   0:00      |       \_ [curl]
root      4664  0.0  0.0      0     0 ?        Z    Feb06   0:00      |       \_ [curl]
root     30571  0.0  0.0      0     0 ?        Z    Feb06   0:00      |       \_ [curl]
root     24113  0.0  0.0      0     0 ?        Z    Feb06   0:00      |       \_ [curl]
root     16475  0.0  0.0      0     0 ?        Z    Feb06   0:00      |       \_ [curl]
root      7176  0.0  0.0      0     0 ?        Z    Feb06   0:00      |       \_ [curl]
root      1090  0.0  0.0      0     0 ?        Z    Feb06   0:00      |       \_ [curl]
It turned out that this behavior is a consequence of the work of the pod with supercronic (the utility on Go that we use to run cron tasks in pods):
 \_ docker-containerd-shim 833b60bb9ff4c669bb413b898a5fd142a57a21695e5dc42684235df907825567 /var/run/docker/libcontainerd/833b60bb9ff4c669bb413b898a5fd142a57a21695e5dc42684235df907825567 docker-runc
|   \_ /usr/local/bin/supercronic -json /crontabs/cron
|       \_ /usr/bin/newrelic-daemon --agent --pidfile /var/run/newrelic-daemon.pid --logfile /dev/stderr --port /run/newrelic.sock --tls --define utilization.detect_aws=true --define utilization.detect_azure=true --define utilization.detect_gcp=true --define utilization.detect_pcf=true --define utilization.detect_docker=true
|       |   \_ /usr/bin/newrelic-daemon --agent --pidfile /var/run/newrelic-daemon.pid --logfile /dev/stderr --port /run/newrelic.sock --tls --define utilization.detect_aws=true --define utilization.detect_azure=true --define utilization.detect_gcp=true --define utilization.detect_pcf=true --define utilization.detect_docker=true -no-pidfile
|       \_ [newrelic-daemon]
|       \_ [curl]
|       \_ [curl]
|       \_ [curl]
…
The problem is this: when a task starts in supercronic, the process generated by it cannot complete correctly , turning into a zombie .
Note : To be more precise, processes are generated by cron-tasks, however, supercronic is not an init-system and cannot “adopt” the processes that its children spawned. When SIGHUP or SIGTERM signals occur, they are not transmitted to the spawned processes, as a result of which the child processes do not terminate, remaining in zombie status. You can read more about all this, for example, in such an article .
There are a couple of ways to solve problems:
- As a temporary workaround - increase the number of PIDs in the system at a single point in time:
/proc/sys/kernel/pid_max (since Linux 2.5.34) This file specifies the value at which PIDs wrap around (i.e., the value in this file is one greater than the maximum PID). PIDs greater than this value are not allo‐ cated; thus, the value in this file also acts as a system-wide limit on the total number of processes and threads. The default value for this file, 32768, results in the same range of PIDs as on earlier kernels - Or, make the launch of tasks in supercronic not directly, but with the help of the same tini , which is able to correctly terminate processes and not generate a zombie.
History 2. "Zombies" when removing cgroup
Kubelet began to consume a large amount of CPU:
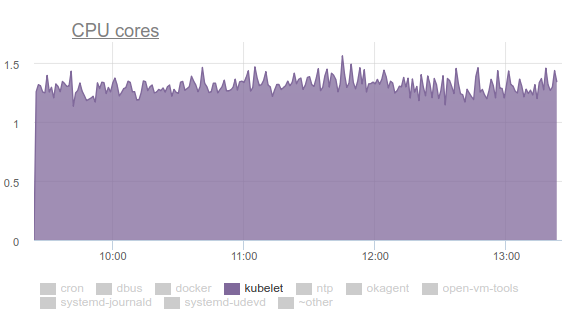
Nobody likes this, so we armed ourselves with perf and began to deal with the problem. The results of the investigation were as follows:
- Kubelet spends more than a third of CPU time pulling memory data from all cgroups:

- In the kernel developers mailing list, you can find a discussion of the problem . In short, the bottom line is that different tmpfs files and other similar things are not completely removed from the system when cgroup is deleted - the so-called memcg zombie remain . Sooner or later, they will still be removed from the page cache, but the memory on the server is much and the kernel does not see the point of wasting time. Therefore, they continue to accumulate. Why is this even happening? This is a server with cron jobs that constantly creates new jobs, and with them new pods. Thus, new cgroups are created for containers in them, which will be deleted soon.
- Why does cAdvisor in kubelet spend so much time? It is easy to see the simplest implementation
time cat /sys/fs/cgroup/memory/memory.stat. If the operation takes 0.01 seconds on a healthy machine, then 1.2 seconds on a problematic cron02. The thing is that cAdvisor, which reads data from sysfs very slowly, tries to take into account the used memory in zombie cgroups as well. - To forcefully remove the zombies, we tried to clear the caches, as recommended in LKML:,
sync; echo 3 > /proc/sys/vm/drop_caches- but the kernel was more complicated and hung the car.
What to do? The problem is fixed ( commit , and the description, see the release message ) by updating the Linux kernel to version 4.16.
History 3. Systemd and its mount
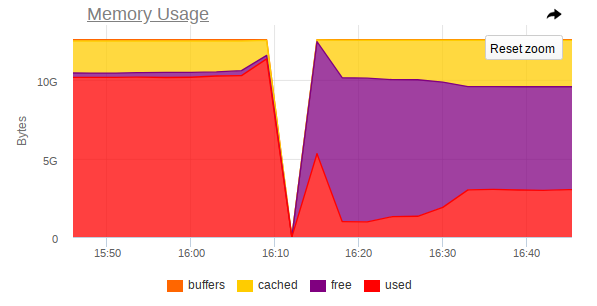
Again, kubelet consumes too many resources on some nodes, but this time it’s already memory:

It turned out that there is a problem in the systemd used in Ubuntu 16.04, and it occurs when controlling the mounts that are created to connect
subPathfrom ConfigMap or secret 'ov. After the pod completes, the systemd service and its service mount remain on the system. Over time, they accumulate a huge amount. There are even issues on this topic:... in the last of which refer to PR in systemd: # 7811 (issue in systemd is # 7798 ).
The problem is no longer in Ubuntu 18.04, but if you want to continue to use Ubuntu 16.04, our workaround on this topic may come in handy.
So, we made the following DaemonSet:
---
apiVersion: extensions/v1beta1
kind: DaemonSet
metadata:
  labels:
    app: systemd-slices-cleaner
  name: systemd-slices-cleaner
  namespace: kube-system
spec:
  updateStrategy:
    type: RollingUpdate
  selector:
    matchLabels:
      app: systemd-slices-cleaner
  template:
    metadata:
      labels:
        app: systemd-slices-cleaner
    spec:
      containers:
      - command:
        - /usr/local/bin/supercronic
        - -json
        - /app/crontab
        Image: private-registry.org/systemd-slices-cleaner/systemd-slices-cleaner:v0.1.0
        imagePullPolicy: Always
        name: systemd-slices-cleaner
        resources: {}
        securityContext:
          privileged: true
        volumeMounts:
        - name: systemd
          mountPath: /run/systemd/private
        - name: docker
          mountPath: /run/docker.sock
        - name: systemd-etc
          mountPath: /etc/systemd
        - name: systemd-run
          mountPath: /run/systemd/system/
        - name: lsb-release
          mountPath: /etc/lsb-release-host
      imagePullSecrets:
      - name: antiopa-registry
      priorityClassName: cluster-low
      tolerations:
      - operator: Exists
      volumes:
      - name: systemd
        hostPath:
          path: /run/systemd/private
      - name: docker
        hostPath:
          path: /run/docker.sock
      - name: systemd-etc
        hostPath:
          path: /etc/systemd
      - name: systemd-run
        hostPath:
          path: /run/systemd/system/
      - name: lsb-release
        hostPath:
          path: /etc/lsb-release
... and it uses the following script:
#!/bin/bash
# we will work only on xenial
hostrelease="/etc/lsb-release-host"
test -f ${hostrelease} && grep xenial ${hostrelease} > /dev/null || exit 0
# sleeping max 30 minutes to dispense load on kube-nodes
sleep $((RANDOM % 1800))
stoppedCount=0
# counting actual subpath units in systemd
countBefore=$(systemctl list-units | grep subpath | grep "run-" | wc -l)
# let's go check each unit
for unit in $(systemctl list-units | grep subpath | grep "run-" | awk '{print $1}'); do
  # finding description file for unit (to find out docker container, who born this unit)
  DropFile=$(systemctl status ${unit} | grep Drop | awk -F': ' '{print $2}')
  # reading uuid for docker container from description file
  DockerContainerId=$(cat ${DropFile}/50-Description.conf | awk '{print $5}' | cut -d/ -f6)
  # checking container status (running or not)
  checkFlag=$(docker ps | grep -c ${DockerContainerId})
  # if container not running, we will stop unit
  if [[ ${checkFlag} -eq 0 ]]; then
    echo "Stopping unit ${unit}"
    # stoping unit in action
    systemctl stop $unit
    # just counter for logs
    ((stoppedCount++))
    # logging current progress
    echo "Stopped ${stoppedCount} systemd units out of ${countBefore}"
  fi
done
... and it starts every 5 minutes with the supercronic already mentioned. His Dockerfile looks like this:
FROM ubuntu:16.04
COPY rootfs /
WORKDIR /app
RUN apt-get update && \
    apt-get upgrade -y && \
    apt-get install -y gnupg curl apt-transport-https software-properties-common wget
RUN add-apt-repository "deb [arch=amd64] https://download.docker.com/linux/ubuntu xenial stable" && \
    curl -fsSL https://download.docker.com/linux/ubuntu/gpg | apt-key add - && \
    apt-get update && \
    apt-get install -y docker-ce=17.03.0*
RUN wget https://github.com/aptible/supercronic/releases/download/v0.1.6/supercronic-linux-amd64 -O \
    /usr/local/bin/supercronic && chmod +x /usr/local/bin/supercronic
ENTRYPOINT ["/bin/bash", "-c", "/usr/local/bin/supercronic -json /app/crontab"]
History 4. Competition in planning pods
It was noted that: if a pod is placed on our node and its image is pumped out for a very long time, then the other pod that "got" to the same node simply does not start pulling the image of the new pod . Instead, he waits for the image of the previous pod to be pulled. As a result, a pod that has already been planned and whose image could be downloaded in just a minute, will be in a status for a long time
containerCreating. In events, there will be something like this:
Normal Pulling 8m kubelet, ip-10-241-44-128.ap-northeast-1.compute.internal pulling image "registry.example.com/infra/openvpn/openvpn:master"It turns out that a single image from the slow registry can block the deployment to the node.
Unfortunately, there are not so many ways out of the situation:
- Try to use your Docker Registry directly in the cluster or directly with the cluster (for example, GitLab Registry, Nexus, etc.);
- Use utilities like kraken .
History 5. Hanging nodes with out of memory
During the operation of various applications, we also received a situation where the node completely ceases to be accessible: SSH does not respond, all monitoring daemons fall off, and then nothing (or almost nothing) is abnormal in the logs.
I'll tell you in the pictures on the example of one node where MongoDB functioned.
This is how atop looks before the crash:

And this is how it looks after the crash:

In monitoring, too, there is a sharp jump at which the node ceases to be accessible:
Thus, from the screenshots it is clear that:
- RAM on the machine is near the end;
- A sharp jump in RAM consumption is observed, after which access to the entire machine is sharply disabled;
- A big task arrives at Mongo, which forces the DBMS process to use more memory and actively read from disk.
It turns out that if Linux runs out of free memory (memory pressure occurs) and there is no swap, then before the OOM killer arrives, an equilibrium may occur between throwing pages in the page cache and writing them back to disk. This is done by kswapd, which courageously frees as many pages of memory as possible for later distribution.
Unfortunately, with a large load of I / O, coupled with a small amount of free memory, kswapd becomes the bottleneck of the entire system , because all page faults of the memory pages in the system are tied to it . This can go on for a very long time if the processes do not want to use memory anymore, but are fixed on the very edge of the OOM-killer-abyss.
The logical question is: why does the OOM killer come so late? In the current OOM iteration, killer is extremely stupid: it will kill the process only when the attempt to allocate a memory page fails, i.e. if the page fault fails. This does not happen for a long time, because kswapd courageously frees up pages of memory by flushing the page cache (all disk I / O in the system, in fact) back to disk. In more detail, with a description of the steps necessary to eliminate such problems in the kernel, you can read here .
This behavior should improve with the Linux 4.6+ kernel.
Story 6. Pods are Pending
In some clusters, in which there are really many pods, we began to notice that most of them are “hanging” for a very long time
Pending, although at the same time the Docker containers themselves are already running on the nodes and you can manually work with them. There is
describenothing wrong with that: Type Reason Age From Message
---- ------ ---- ---- -------
Normal Scheduled 1m default-scheduler Successfully assigned sphinx-0 to ss-dev-kub07
Normal SuccessfulAttachVolume 1m attachdetach-controller AttachVolume.Attach succeeded for volume "pvc-6aaad34f-ad10-11e8-a44c-52540035a73b"
Normal SuccessfulMountVolume 1m kubelet, ss-dev-kub07 MountVolume.SetUp succeeded for volume "sphinx-config"
Normal SuccessfulMountVolume 1m kubelet, ss-dev-kub07 MountVolume.SetUp succeeded for volume "default-token-fzcsf"
Normal SuccessfulMountVolume 49s (x2 over 51s) kubelet, ss-dev-kub07 MountVolume.SetUp succeeded for volume "pvc-6aaad34f-ad10-11e8-a44c-52540035a73b"
Normal Pulled 43s kubelet, ss-dev-kub07 Container image "registry.example.com/infra/sphinx-exporter/sphinx-indexer:v1" already present on machine
Normal Created 43s kubelet, ss-dev-kub07 Created container
Normal Started 43s kubelet, ss-dev-kub07 Started container
Normal Pulled 43s kubelet, ss-dev-kub07 Container image "registry.example.com/infra/sphinx/sphinx:v1" already present on machine
Normal Created 42s kubelet, ss-dev-kub07 Created container
Normal Started 42s kubelet, ss-dev-kub07 Started containerAfter digging around, we made the assumption that kubelet just does not have time to send the API server all the information about the state of the pods, liveness / readiness samples.
And having studied help, we found the following parameters:
--kube-api-qps - QPS to use while talking with kubernetes apiserver (default 5)
--kube-api-burst  - Burst to use while talking with kubernetes apiserver (default 10)
--event-qps - If > 0, limit event creations per second to this value. If 0, unlimited. (default 5)
--event-burst - Maximum size of a bursty event records, temporarily allows event records to burst to this number, while still not exceeding event-qps. Only used if --event-qps > 0 (default 10)
--registry-qps - If > 0, limit registry pull QPS to this value.
--registry-burst - Maximum size of bursty pulls, temporarily allows pulls to burst to this number, while still not exceeding registry-qps. Only used if --registry-qps > 0 (default 10)
As you can see, the default values are quite small , and in 90% they cover all the needs ... However, in our case this was not enough. Therefore, we set these values:
--event-qps=30 --event-burst=40 --kube-api-burst=40 --kube-api-qps=30 --registry-qps=30 --registry-burst=40... and restarted kubelets, after which they saw the following picture on the graphs of accessing the API server:

... and yes, everything started to fly!
PS
For help in collecting bugs and preparing the article, I express my deep gratitude to the numerous engineers of our company, and in particular to Andrei Klimentyev (colleague from our R&D team ) ( zuzzas ).
PPS
Read also in our blog:
- “ Kubectl-debug plugin for debugging in Kubernetes pods ”;
- “ Monitoring and Kubernetes (review and video report) ”;
- Kubernetes tips & tricks cycle: