Mines under performance are waiting in the wings
In this article I will talk about mines laid under the performance, as well as their detection (preferably before the explosion) and disposal.

What is a mine?
Let's start with what lies at the origins of any knowledge - with definition. The ancients said that to name correctly means to understand correctly. I think that the definition of mines under performance is best expressed by contrasting an obvious mistake, for example, this:
String concat(String... strings){
  String result = "";
  for (String str : strings) {
    result += str;
  }
  return result;
}
Even novice developers know that the lines are immutable, and gluing them together in a loop does not mean adding data to the tail of an existing line, but creating a new line with each pass. If you are mistaken, then do not be discouraged - the “Idea” will immediately warn you about the danger, and the “Sonar” will surely flood your assembly.
But this code will attract much less attention, and the Idea ( before version 2018.2 ) will be silent:
Long total = 0L;
List<Long> totals = query.getResultList();
for (Long element : totals) {
  total += element == null ? 0 : element;
}
The problem here is the same: the wrappers for simple types are immutable, which means adding 5 units to the object number means creating a new wrapper and writing the number 6 into it.
The cruel joke here is the presence in Java of two representations of certain types of data - simple and object, as well as their automatic transformation by means of the language itself. Because of this, many novice developers think something like this: "Well, the execution somehow transforms them there itself, it's just a number."
In fact, not everything is so simple. Take the benchmark and try to add the numbers in the specified way:
                (size)   Mode  Cnt     Score   Error  Units
wrapper             10   avgt  100      23,5 ±   0,1  ns/op
wrapper            100   avgt  100     352,3 ±   2,1  ns/op
wrapper           1000   avgt  100    4424,5 ±  25,2  ns/op
wrapper             10   avgt  100         0 ±     0   B/op
wrapper            100   avgt  100      1872 ±     0   B/op
wrapper           1000   avgt  100     23472 ±     0   B/op
Сравните с простым типом:
primitive           10   avgt  100       6,4 ±   0,0  ns/op
primitive          100   avgt  100      39,8 ±   0,1  ns/op
primitive         1000   avgt  100     252,5 ±   1,3  ns/op
primitive           10   avgt  100         0 ±     0   B/op
primitive          100   avgt  100         0 ±     0   B/op
primitive         1000   avgt  100         0 ±     0   B/op
From here we derive one of the definitions of mines under performance - this is code that is not striking, is not detected (at least at the time when you came across it) by static analyzers, but it can slow down in some uses. In our case, while the sum does not exceed 127 objects are taken from the cache and Longonly 4 times slower than long. However, for an array of size 100, the speed is almost 10 times lower.
Big little things
Sometimes, a slight change that almost does not change the meaning of execution, in some circumstances becomes a strong brake.
Suppose we have a code:
// org.springframework.data.convert.CustomConversions$ConversionTargetsCache
Map<Object, TypeInformation<?>> cache = new ConcurrentHashMap<>();
private TypeInformation<?> getFromCacheOrCreate(Alias alias) {
  TypeInformation<?> info = cache.get(alias);
  if (info == null) {
    info = getAlias.apply(alias);
    cache.put(alias, info);
  }
  return info;
}
What does the method logic look like?
Это же ConcurrentHashMap::computeIfAbsent!
We have the "eight" and we can coolly improve the code: replace 6 lines with one, making the code shorter and easier to understand. By the way, connoisseurs of multithreading will probably point to another improvement that brings with it ConcurrentHashMap::computeIfAbsent, but about it a little later;)
Let's make a great thought come true:
// org.springframework.data.convert.CustomConversions$ConversionTargetsCache
Map<Object, TypeInformation<?>> cache = new ConcurrentHashMap<>();
private TypeInformation<?> getFromCacheOrCreate(Alias alias) {
  return cache.computeIfAbsent(alias, getAlias);
}Чтобы увидеть полный размер нажмите правой клавишей по рисунку и выберите "Открыть изображение в новой вкладке"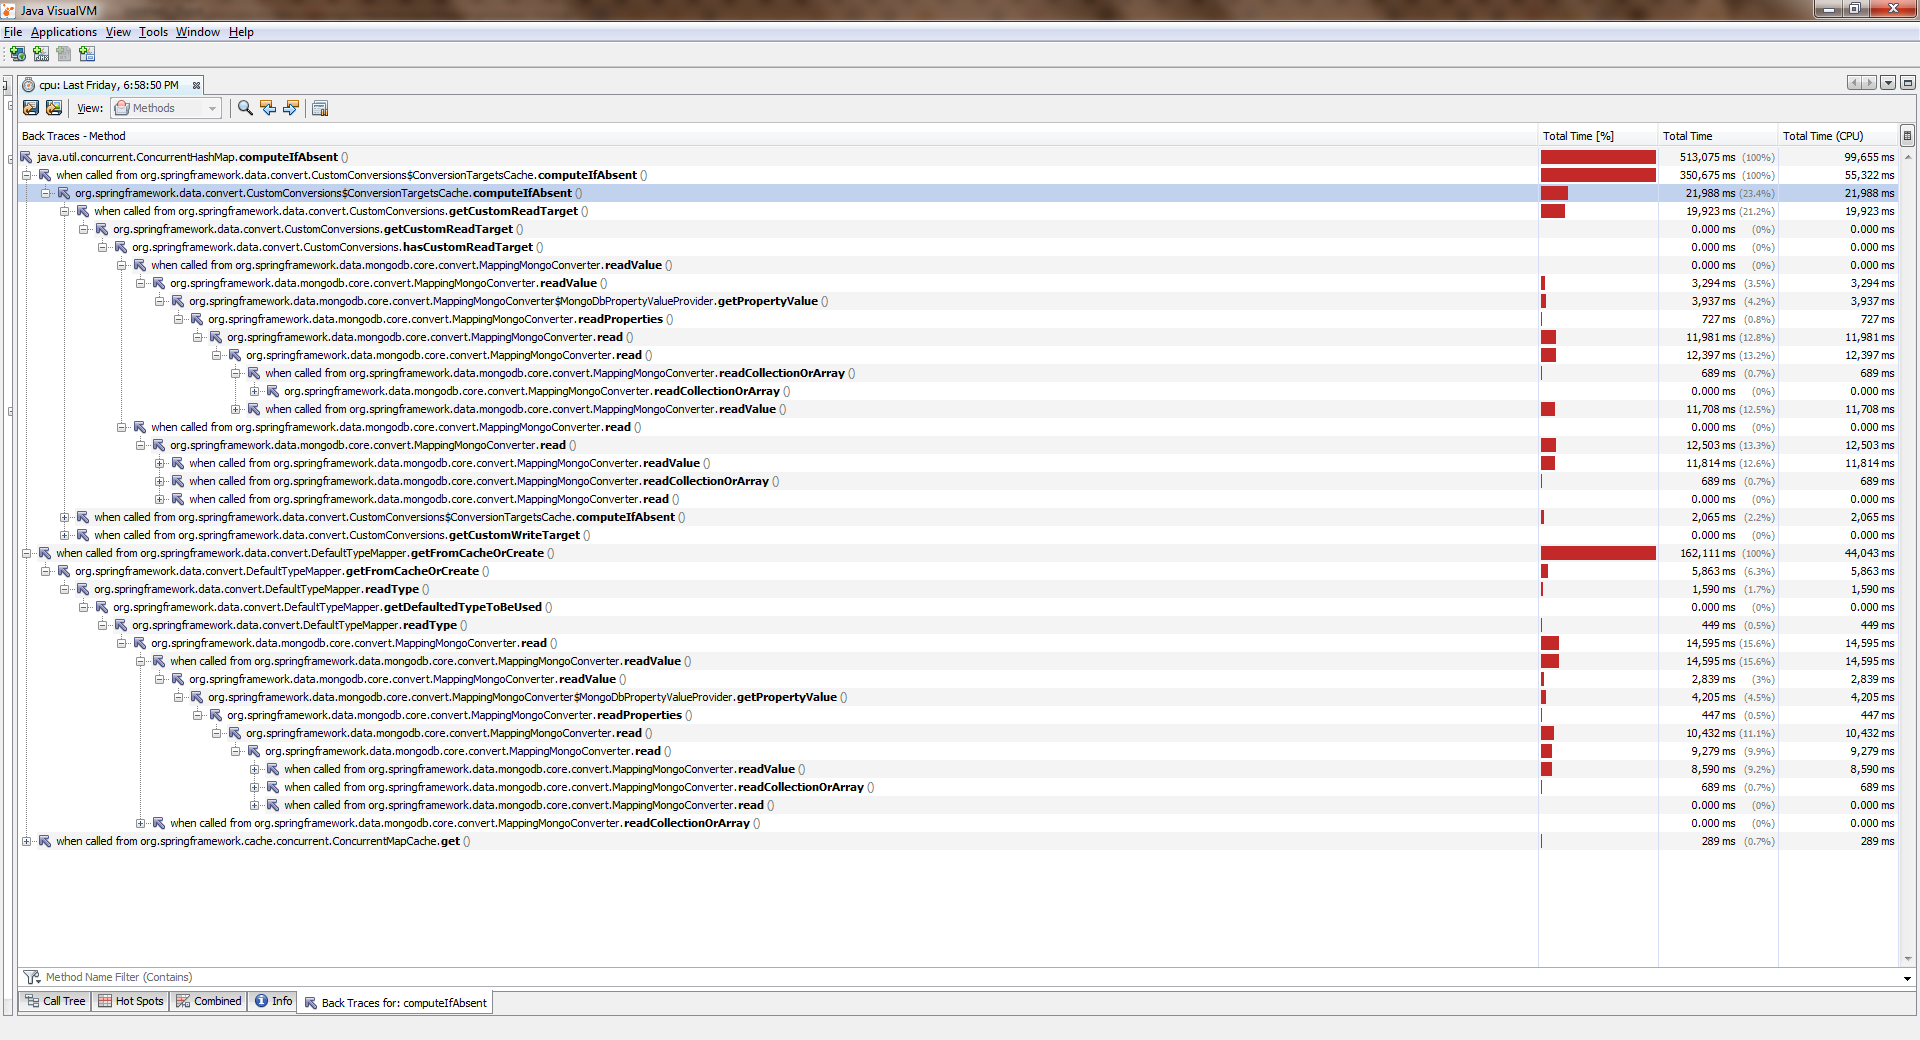
While the application worked with a single thread, everything was more or less good. Streams became more and became significantly worse. It turned out that it was ConcurrentHashMap::computeIfAbsentblocked, and even if the key was already added to the dictionary . And this became the reason for quite a bug in Spring Date Mongo.
You can verify this with a simple measurement ("eight"). Here is his conclusion:
Benchmark        Mode  Cnt    Score    Error  Units
1 thread
computeIfAbsent  avgt   20   19,405 ±  0,411  ns/op
getAndPut        avgt   20    4,578 ±  0,045  ns/op
2 threads
computeIfAbsent  avgt   20   66,492 ±  2,036  ns/op
getAndPut        avgt   20    4,454 ±  0,110  ns/op
4 threads
computeIfAbsent  avgt   20  155,975 ±  8,850  ns/op
getAndPut        avgt   20    5,616 ±  2,073  ns/op
6 threads
computeIfAbsent  avgt   20  203,188 ± 10,547  ns/op
getAndPut        avgt   20    7,024 ±  0,456  ns/op
8 threads
computeIfAbsent  avgt   20  302,036 ± 31,702  ns/op
getAndPut        avgt   20    7,990 ±  0,144  ns/op
Can this be clearly considered a mistake by the developers? In my humble opinion, no, no. The documentation says:
Some attempted update operations on this map by other threads may be blocked while computation is in progress, so the computation should be short and simple, and must not attempt to update any other mappings of this map
In other words, it ConcurrentHashMap::computeIfAbsentcloses the cell containing the key from the outside world (in contrast to ConcurrentHashMap::get), which is generally true, since it allows you to dodge the race while calling the method from different threads when the key has not yet been added.
On the other hand, in the most common mode of operation, the calculation of the value and its binding with the key occurs only during the first call, and all subsequent calls only return the previously calculated value. Therefore, it makes sense to change the logic so that the lock is set only when changing. It was made here .
In more recent editions (> 8) it has ConcurrentHashMap::computeIfAbsentbecome faster:
JDK 11
Benchmark        Mode  Cnt   Score   Error  Units
1 thread
computeIfAbsent  avgt   20   6,983 ± 0,066  ns/op
getAndPut        avgt   20   5,291 ± 1,220  ns/op
2 threads
computeIfAbsent  avgt   20   7,173 ± 0,249  ns/op
getAndPut        avgt   20   5,118 ± 0,395  ns/op
4 threads
computeIfAbsent  avgt   20   7,991 ± 0,447  ns/op
getAndPut        avgt   20   5,270 ± 0,366  ns/op
6 threads
computeIfAbsent  avgt   20  11,919 ± 0,865  ns/op
getAndPut        avgt   20   7,249 ± 0,199  ns/op
8 threads
computeIfAbsent  avgt   20  14,360 ± 0,892  ns/op
getAndPut        avgt   20   8,511 ± 0,229  ns/op
Pay attention to the insidiousness of this example: the semantic content has not changed much, because at first glance we just used a more advanced syntax. At the same time, while the application runs in one thread, the user almost does not feel the difference! This is how seemingly harmless changesthe pig mine for our performance.
Не всегда ConcurrentHashMap::computeIfAbsent взаимозаменяем с выражением getAndPut, потому что ConcurrentHashMap::computeIfAbsent является атомарной операцией. В этом же коде
private TypeInformation<?> getFromCacheOrCreate(Alias alias) {
  TypeInformation<?> info = cache.get(alias);
  if (info == null) {
    info = getAlias.apply(alias);
    cache.put(alias, info);
  }
  return info;
}
из-за отсутствия внешней синхронизации появляется гонка. Если функция, передаваемая в ConcurrentHashMap::computeIfAbsent для заданного ключа всегда возвращает одно и то же значения, то это "безопасная" гонка, самое большее, что нам грозит — это вычисление одного и того же значения 2 и более раз. Если же таких гарантий нет, то механическая замена чревата поломкой приложения. Будьте осторожны!
These hands didn't change anything
It also happens that the code does not change at all, but suddenly it starts to slow down.
Imagine that we are faced with the task of shifting the elements of an array into a collection. It will be most logical to use a ready-made method Collection::addAll, but here's the bad luck - it takes a collection:
publicinterfaceCollection<E> extendsIterable<E> {
  booleanaddAll(Collection<? extends E> c);
}
The easiest way is to wrap the array in Arrays::asList. It will turn out something like
booleanaddItems(Collection<T> collection){
  T[] items = getArray();
  return collection.addAll(Arrays.asList(items));
}
During the proofreading, performance-conscious colleagues will probably tell us that there are two problems in this code at once:
- wrapping the array in a list (extra object)
- creating an iterator (another extra object) and passing through it
In fact, in the reference implementation, Collection::addAllwe will see this:
publicabstractclassAbstractCollection<E> implementsCollection<E> {
  publicbooleanaddAll(Collection<? extends E> c){
    boolean modified = false;
    for (E e : c) {
      if (add(e))
        modified = true;
    }
    return modified;
  }
}
So an iterator is created here and the elements are sorted using it. Therefore, experienced comrades offer their solution:
booleanaddItems(Collection<T> collection){
  T[] items = getArray();
  return Collections.addAll(collection, items);
}
Inside the code, quite rightly seeming more productive:
publicstatic <T> booleanaddAll(Collection<? super T> c, T... elements){
  boolean result = false;
    for (T element : elements)
      result |= c.add(element);
  return result;
}
First, an iterator is not created. Secondly, the pass goes in the usual counting cycle, besides, the arrays fit well in the caches, its elements are located in memory sequentially (which means there will be few cache misses), and access to them by index is very fast. Well, a wrapper list is not created either. It sounds good and sound.
Finally, colleagues cite ultima ratio regum: documentation. And there, in gray on white (or green on black) it says:
/**
 * ...
 * The behavior of this convenience method is identical to that of
 * c.addAll(Arrays.asList(elements)), but this method is likely
 * to run significantly faster under most implementations.           <----
 * @since 1.5
 */@SafeVarargspublicstatic <T> booleanaddAll(Collection<? super T> c, T... elements){
  //...
}
That is, the developers themselves (and who should they believe, if not them?) Write that for most implementations the utility method works much faster. And he is really faster. Sometimes.
This benchmark will help to verify this , which we will launch for HashSet-a at the G8:
Benchmark          (collection)  (size)  Mode  Cnt     Score   Error  Units
addAll                  HashSet      10  avgt  100     155,2 ±   2,8  ns/op
addAll                  HashSet     100  avgt  100    1884,4 ±  37,4  ns/op
addAll                  HashSet    1000  avgt  100   17917,3 ± 298,8  ns/op
collectionsAddAll       HashSet      10  avgt  100     136,1 ±   0,8  ns/op
collectionsAddAll       HashSet     100  avgt  100    1538,3 ±  31,4  ns/op
collectionsAddAll       HashSet    1000  avgt  100   15168,6 ± 289,4  ns/op
It seems that the more experienced comrades were right. Nearly.
In later editions (for example, in 11) the brilliance of the utility method will fade somewhat:
Benchmark          (collection)  (size)  Mode  Cnt     Score   Error  Units
addAll                  HashSet      10  avgt  100     143,1 ±   0,6  ns/op
addAll                  HashSet     100  avgt  100    1738,4 ±   7,3  ns/op
addAll                  HashSet    1000  avgt  100   16853,9 ± 101,0  ns/op
collectionsAddAll       HashSet      10  avgt  100     132,1 ±   1,1  ns/op
collectionsAddAll       HashSet     100  avgt  100    1661,1 ±   7,1  ns/op
collectionsAddAll       HashSet    1000  avgt  100   15450,9 ±  93,9  ns/op
It can be seen that we are not talking about any "much faster" one. And if we repeat the experiment for ArrayList-a, then it turns out that the utility method starts to lose a lot (the further - the stronger):
Benchmark            (collection)  (size)  Mode  Cnt     Score   Error  Units
JDK 8
addAll                  ArrayList      10  avgt  100      38,5 ±   0,5  ns/op
addAll                  ArrayList     100  avgt  100     188,4 ±   7,0  ns/op
addAll                  ArrayList    1000  avgt  100    1278,8 ±  42,9  ns/op
collectionsAddAll       ArrayList      10  avgt  100      62,7 ±   0,7  ns/op
collectionsAddAll       ArrayList     100  avgt  100     495,1 ±   2,0  ns/op
collectionsAddAll       ArrayList    1000  avgt  100    4892,5 ±  48,0  ns/op
JDK 11
addAll                  ArrayList      10  avgt  100      26,1 ±   0,0  ns/op
addAll                  ArrayList     100  avgt  100     161,1 ±   0,4  ns/op
addAll                  ArrayList    1000  avgt  100    1276,7 ±   3,7  ns/op
collectionsAddAll       ArrayList      10  avgt  100      41,6 ±   0,0  ns/op
collectionsAddAll       ArrayList     100  avgt  100     492,6 ±   1,5  ns/op
collectionsAddAll       ArrayList    1000  avgt  100    6792,7 ± 165,5  ns/op
There is nothing unexpected here, it is ArrayListbuilt around an array, so the developers have farsightedly redefined the method Collection::addAll:
publicbooleanaddAll(Collection<? extends E> c){
  Object[] a = c.toArray();
  modCount++;
  int numNew = a.length;
  if (numNew == 0)
    returnfalse;
  Object[] elementData;
  finalint s;
  if (numNew > (elementData = this.elementData).length - (s = size))
    elementData = grow(s + numNew);
  System.arraycopy(a, 0, elementData, s, numNew);    <--- переносим данные пачкой
  size = s + numNew;
  returntrue;
}
Now back to our mines. Suppose that we nevertheless accepted the solution proposed on proofreading and left this code:
booleanaddItems(Collection<T> collection){
  T[] items = getArray();
  return Collections.addAll(collection, items);
}
For the time being, everything is fine, but after adding new functionality, the method sometimes gets hot and starts to slow down. We open source codes - the code did not change. The amount of data is the same. And performance sagged a lot. This is another type of mine.
We uncover the debugger and find the beautiful:
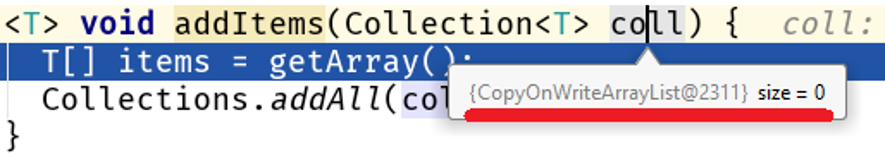
Please note: we did not change the algorithm, the amount of processed data did not change, but their nature changed and a performance problem started up in our code:
                                 Java 8     Java 11
                  размер
addAll                10           56,9        25,2    ns/op
collectionsAddAll     10          352,2       142,9    ns/op
addAll               100          159,9        84,3    ns/op
collectionsAddAll    100         4607,1      3964,3    ns/op
addAll              1000         1244,2       760,2    ns/op
collectionsAddAll   1000       355796,9    364677,0    ns/op
On large arrays, the difference between Collections::addAlland Collection::addAllis a modest 500 times. The fact is that it COWListdoes not just expand the existing array, but creates a new one each time elements are added:
publicbooleanadd(E e){
  synchronized (lock) {
    Object[] es = getArray();
    int len = es.length;
    es = Arrays.copyOf(es, len + 1);     <---- привет сборщику мусора
    es[len] = e;
    setArray(es);
    returntrue;
  }
}
Who is guilty?
The main problem here is that the method Collections::addAllaccepts an interface, while the method addAlldoes not have a body. No body - no business, therefore, the documentation is written on the basis of the implementation existing in AbstractCollection::addAll, which is a generalized algorithm applicable to all collections. This means that more specific implementations of data structures that are at a lower level of abstraction can alter this behavior.
        Collection::addAll  – верхний уровень
AbstractCollection::addAll  – средний уровень  <--- описано в документации
         ArrayList::addAll
           HashSet::addAll  – нижний уровень   <--- тут может быть что угодно
           COWList::addAll
More about abstractions
Since we are talking about the levels of abstraction, I’ll tell you about one example from life.
Let's compare these two ways of saving the nth number of entities in the database:
@Transactionalvoidsave(int n){
  for (int i = 0; i < n; i++) {
    SimpleEntity e = new SimpleEntity();
    repository.save(e);
  }
}
@Transactionalvoid_save(int n){
  for (int i = 0; i < n; i++) {
    SimpleEntity e = new SimpleEntity();
    repository.saveAndFlush(e);
  }
}
At first glance, the performance of both methods should not be very different, because
- in both cases the same number of entities will be stored in the database
- if the key is taken from the sequence, then the number of calls will be the same
- the amount of data transferred is the same
Let's turn to the method SimpleJpaRepository::saveAndFlush:
@Transactionalpublic <S extends T> S save(S entity){
  if (entityInformation.isNew(entity)) {
    em.persist(entity);
  return entity;
  } else {
    return em.merge(entity);
  }
}
@Transactionalpublic <S extends T> S saveAndFlush(S entity){
  S result = save(entity);
  flush();
  return result;
}
@Transactionalpublicvoidflush(){
  em.flush();
}
The worst place here is the method flush(). Why dumb? It seems to me that its disclosure in the interface JpaRepositorywas a mistake of the developers. I will try to justify my thought. Usually this method is not used at all by the developer, because the call is EntityManager::flushtied to the completion of a transaction controlled by Spring:
// управление сессией передано каркасу@Transactionalpublicvoidmethod(){ <-- скрытый Session::open
  /*.*/
}                      <-- скрытый Session::flush
Please note: EntityManager- this is part of the specification JPAimplemented in Hibernate as a session (Session interface and SessionImpl class, respectively). Spring Date is a framework that runs on top of an ORM, in this case, on top of Hibernate. It turns out that the method JpaRepository::saveAndFlushgives us access to the lower levels of the API, although the task of the framework is to hide the low-level details (the situation is somewhat similar to the story with Unsafe in the JDK).
In our case, when used, JpaRepository::saveAndFlushwe break into the lower layers of the application, thereby breaking something.
Ломается способность Хибернейта отправлять данные пачками, кратно настройке jdbc.batch_size, которая указывается в application.yml:
spring:
  jpa:
    properties:
      hibernate:
        jdbc.batch_size: 500
Работа Хибернейта построена на событиях, поэтому что при сохранении 1000 сущностей вот так
@Transactionalvoidsave(int n){
  for (int i = 0; i < n; i++) {
    SimpleEntity e = new SimpleEntity();
    repository.save(e);
  }
}
при вызове repository.save(e) не происходит мгновенного сохранения. Вместо этого создаётся событие, которое ставится в очередь. По завершению транзакции данные сливаются при помощи EntityManager::flush, который делит вставки/обновления на пачки кратно jdbc.batch_size и создаёт из них запросы. В нашем случае jdbc.batch_size: 500, так что сохранение 1000 сущностей на деле означает лишь 2 запроса.
А вот с ручным сливом сессии на каждом проходе цикла
@Transactionalvoid_save(int n){
  for (int i = 0; i < n; i++) {
    SimpleEntity e = new SimpleEntity();
    repository.saveAndFlush(e);
  }
}
очередь очищается и сохранение 1000 сущностей означает 1000 запросов.
Thus, interfering with the lower layers of the application can easily become a mine, and not only a productivity mine (see Unsafe and its uncontrolled use).
How much does it slow down? Take the best case (for us) - the database is on the same host as the application. My measurement shows the following picture:
                    (entityCount)  Mode  Cnt    Score   Error  Units
bulkSave                       10    ss  500   16,613 ± 1,714  ms/op
bulkSave                      100    ss  500   31,371 ± 1,453  ms/op
bulkSave                     1000    ss  500   35,687 ± 1,973  ms/op
bulkSaveUsingFlush             10    ss  500   32,653 ± 2,166  ms/op
bulkSaveUsingFlush            100    ss  500   61,983 ± 6,304  ms/op
bulkSaveUsingFlush           1000    ss  500  184,814 ± 6,976  ms/op
Obviously, if the database is located on a remote host, then the cost of data transfer will increasingly degrade performance as the data volume grows.
Thus, working at the wrong level of abstraction can easily create a time bomb. By the way, in one of my previous articles, I talked about a curious attempt to improve StringBuilder-a: there I was unsuccessful just when trying to get into a more abstract level of code.
Minefield borders
Let's play a sapper? Find mine:
// org.springframework.cache.interceptor.CacheAspectSupport Object generateKey(CacheOperationContext ctx, Object result){
  Object key = ctx.generateKey(result);
  Assert.notNull(key, "Null key ..." + context.metadata.operation);
  // ...return key;
} |
\ /
// org.springframework.cache.interceptor.CacheAspectSupport
|
\ /
Object generateKey(CacheOperationContext ctx, Object result){
Object key = ctx.generateKey(result);
|
\ /
Assert.notNull(key, "Null key ..." + context.metadata.operation);
return key;
}“Are you kidding me?” The critic exclaims. “But is there just a gluing of two lines? What does it matter in bloody E.?” Let me draw your attention to the fact that I highlighted not only the gluing of strings, but also the name of the class and the name of the method. Indeed, the danger of gluing strings is not in gluing itself, but in what happens in the method that creates the keys for the cache, i.e. in certain scenarios we will have a lot of calls to this method, which means a lot of garbage lines.
Therefore, an error message should be created only when this error is actually thrown:
// org.springframework.cache.interceptor.CacheAspectSupport Object generateKey(CacheOperationContext ctx, Object result){
  Object key = ctx.generateKey(result);
  if (key == null) {
    thrownew IAE("Null key ..." + context.metadata.operation);
  }
  // ...return key;
}
Thus, minefields have boundaries - this is the amount of data, the frequency of access to the method, etc. quantitative indicators, upon reaching and exceeding which a slight drawback becomes statistically significant.
On the other hand, this is the feature, to the intersection of which complication of the code does not give a significant (measurable) improvement.
This is another conclusion for the developer: in most cases, deceit is evil, leading to meaningless complication of the code. In 99 cases out of 100, we win nothing.
It should be remembered that there is always
The one hundredth case
Here is the code that Nitzan Wakart gives in his article The volatile read surprise :
@BenchmarkMode(Mode.AverageTime)
@OutputTimeUnit(TimeUnit.NANOSECONDS)
@State(Scope.Thread)
publicclassLoopyBenchmarks{
  @Param({ "32", "1024", "32768" })
  int size;
  byte[] bunn;
  @Setuppublicvoidprepare(){
    bunn = newbyte[size];
  }
  @BenchmarkpublicvoidgoodOldLoop(Blackhole fox){
    for (int y = 0; y < bunn.length; y++) { // good old C style for (the win?)
      fox.consume(bunn[y]);
    }
  }
  @BenchmarkpublicvoidsweetLoop(Blackhole fox){
    for (byte bunny : bunn) { // syntactic sugar loop goodness
      fox.consume(bunny);
    }
  }
}
When we set up the experience, we will find an amazing difference between the two ways to iterate over an array:
Benchmark              (size)     Score  Score error  Units
goodOldLoop               32     46.630        0.097  ns/op
goodOldLoop             1024   1199.338        0.705  ns/op
goodOldLoop            32768  37813.600       56.081  ns/op
sweetLoop                 32     19.304        0.010  ns/op
sweetLoop               1024    475.141        1.227  ns/op
sweetLoop              32768  14295.800       36.071  ns/op
Here, an inexperienced developer can make such an obvious and benchmarked conclusion: traversing an array using the new syntax works faster than a counting cycle. This is the wrong conclusion, because it is worth changing the method a bit goodOldLoop:
@BenchmarkpublicvoidgoodOldLoopReturns(Blackhole fox){
  byte[] sunn = bunn; // make a local copy of the fieldfor (int y = 0; y < sunn.length; y++) {
    fox.consume(sunn[y]);
  }
}
and its indicators are comparable to those of the “faster” method sweetLoop:
Benchmark              (size)     Score  Score error  Units
goodOldLoopReturns        32     19.306        0.045  ns/op
goodOldLoopReturns      1024    476.493        1.190  ns/op
goodOldLoopReturns     32768  14292.286       16.046  ns/op
sweetLoop                 32     19.304        0.010  ns/op
sweetLoop               1024    475.141        1.227  ns/op
sweetLoop              32768  14295.800       36.071  ns/op
The point here is insidious Blackhole::consume:
//...publicvolatilebyte b1, b2;
publicvolatile BlackholeL2 nullBait = null;
/**
 * Consume object. This call provides a side effect preventing JIT to eliminate dependent computations.
 *
 * @param b object to consume.
 */publicfinalvoidconsume(byte b){
  if (b == b1 & b == b2) {
    // SHOULD NEVER HAPPEN
    nullBait.b1 = b; // implicit null pointer exception
  }
}
thanks to which a volatile access suddenly appeared inside our cycle, which acts like a barrier, forbidding the compiler from some permutations and improvements. In the first version of the method, the goodOldLoopcompiler is forced to load a field from memory this.bunneach time the loop for-eachpasses, and the loop does this only once, implicitly saving the field to a local variable (EMNIP, in Java Concurrency In Practice this is called "synchronization on the stack"). This explains the difference in performance.
A critical reader will say: “What does this matter in everyday work? This example is artificial, it’s Blackhole::consumenever used in the JMH infrastructure. In general, what’s the difference in how to iterate over an array in real code?”
To reflect this killer argument, let's take a look at an example:
byte[] bunn;
publicvoidgoodOldLoop(Blackhole fox){
  for (int y = 0; y < bunn.length; y++) {
    fox.consume(bunn[y]);
  }
}
Doesn’t resemble anything? Right? Well, let's make some changes:
E[] bunn;
publicvoidforEach(Consumer<E> fox){
  for (int y = 0; y < bunn.length; y++) {
    fox.consume(bunn[y]);
  }
}
It turned out Iterable::forEach! And if you open implementations of this method for collections working on top of an array, then suddenly they all use either a sugar cycle or saving to a variable before passing (all the sources from JDK 13):
//ArrayListpublicvoidforEach(Consumer<? super E> action){
  Objects.requireNonNull(action);
  finalint expectedModCount = modCount;
  final Object[] es = elementData;
  finalint size = this.size;
  for (int i = 0; modCount == expectedModCount && i < size; i++)
    action.accept(elementAt(es, i));
  if (modCount != expectedModCount)
    thrownew ConcurrentModificationException();
}
//Arrays$ArrayListpublicvoidforEach(Consumer<? super E> action){
  Objects.requireNonNull(action);
  for (E e : a) {
    action.accept(e);
  }
}
//CopyOnWriteArrayListpublicvoidforEach(Consumer<? super E> action){
  Objects.requireNonNull(action);
  for (Object x : getArray()) {
    @SuppressWarnings("unchecked") E e = (E) x;
    action.accept(e);
  }
}
//ArrayDequepublicvoidforEach(Consumer<? super E> action){
  Objects.requireNonNull(action);
  final Object[] es = elements;
  for (int i = head, end = tail, to = (i <= end) ? end : es.length; ; i = 0, to = end) {
    for (; i < to; i++)
      action.accept(elementAt(es, i));
    if (to == end) {
      if (end != tail) thrownew ConcurrentModificationException();
      break;
    }
  }
}
And you need to remember this when you are implementing your data structure or improving an existing one. For example, not so long ago there was a proposal for improvementCollections.nCopies()::forEach :
@OverridepublicvoidforEach(final Consumer<? super E> action){
  Objects.requireNonNull(action);
  for (int i = 0; i < this.n; i++) {
    action.accept(this.element);
  }
}
At first glance, this code is not necessary to synchronize on the stack, that is, to the values of the fields.. this.nAnd this.elementare recorded only once, when you create an object:
privatestaticclassCopiesList<E>
  extendsAbstractList<E>
  implementsRandomAccess, Serializable{
  finalint n;
  final E element;
  CopiesList(int n, E e) {
    assert n >= 0;
    this.n = n;
    element = e;
  }
As it turned out, you can’t rely on this , as well as on@Stable .
Please note: in 99 cases out of 100 it doesn’t matter exactly how you bypass the array, but there is always 1 out of 100 case in which there will be volatile access inside the loop and the wrong solution will become a performance problem. This is another example of a mine that fires only under special conditions.
In one of my articles, I showed a similar example of the destructive effect on the performance of the "cycle and volatile" bundle.
Echo of war
I want to complete the article with an example of an ancient improvement, which became a mine:
//java.lang.Integer@HotSpotIntrinsicCandidatepublicstatic Integer valueOf(int i){
    if (i >= IntegerCache.low && i <= IntegerCache.high)
        return IntegerCache.cache[i + (-IntegerCache.low)];
    returnnew Integer(i);
}
Once upon a time, the developers felt that it would be nice to cache the values of some types ( java.lang.Integer, java.lang.Long, java.lang.Short, java.lang.Byte, java.lang.Character). Moreover, it was added to the language specification, so when we write
Integer intgr = Integer.valueOf(42);no new object is created.
If we dare to write like this:
Integer intgr = new Integer(42);then all static analyzers will yell about performance degradation, FindBags and Sonar will ruin the builds until we return to the canonical Integer::valueOfinstead of the godless constructor.
After some time, much steeper improvements were introduced: analysis of the scope of the variable and scalarization. Their combination allows instead of creating an object on the heap to display it as a set of fields on the stack, in cases where the object does not leak from the "native" method (or leaks shortly after gluing the body of the method to the call point). And suddenly it turned out that this optimization works with the constructor and breaks if the wrapped simple value is dragged through the cache inside Integer::valueOf. This story is described in detail in the report "Compress me completely . "
That's all for today. Remember that even very simple code in certain conditions can be very, very insidious. I hope my examples will help you in your daily work. If you have your own examples, then I will be grateful if you share them in the comments.