How scoring works in the car sharing industry. Part 2. Determine the aggressive driver in 5 seconds.
In the last article, we reviewed the scoring algorithm based on sharp accelerations and decelerations. The results of scoring according to this algorithm weakly correlate with the probability of an accident. In this article, we turn to more advanced driving style analysis algorithms based on speeds, engine speeds and accelerometer readings.

For the analysis, we will use data of 250,000 trips of 43,000 car sharing users, of whom 250 were accidents. Teletomatic devices Remoto are installed on the analyzed cars. In the article we will consider two groups of drivers - aggressive and neat. Aggressive drivers are defined as drivers who repeatedly commit violations of the rules of the road.
To begin, let us analyze the average speed of movement and average turnovers of users who did not get into the accident and the perpetrators of the accident.

Figure 1. Average speed
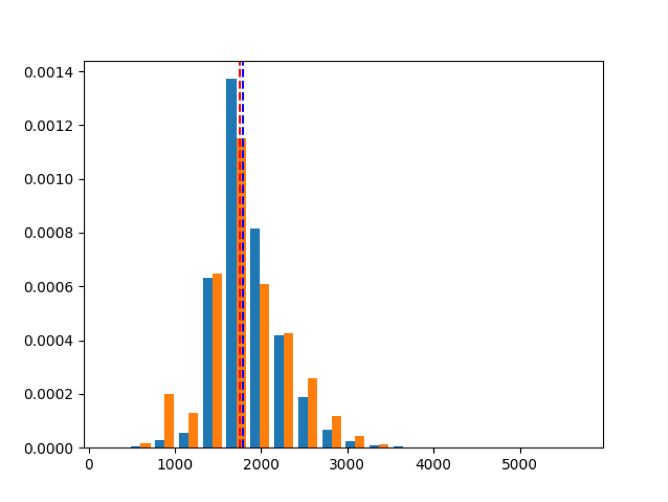
Figure 2. Average engine speed
On histograms 1 and 2, blue and orange indicate the indicators of users without an accident and the perpetrators of an accident, respectively, where the dotted lines are the medians. It is seen that the average users with accidents and without - slightly different. This suggests that most of the route drivers drive the same way.
Next, we selected 10 drivers: 5 with an aggressive driving style and 5 with a calm one. Analysis of the data from the routes of these user groups showed an interesting feature - the first 5 seconds of the trip aggressive users quickly pick up speed and keep the engine running higher. Also, aggressive users slow down with great acceleration when the car is completely stopped (at a traffic light or at the end of a trip). For speed, engine speed and acceleration, we used the following values for the analysis:
On our test sample it was clearly visible that the maximum turnovers of aggressive drivers at the beginning of the route are much higher than those of the others, like the maximum acceleration. As a result, we decided to calculate these values for all 250,000 routes, dividing the data into two groups: the perpetrators of road accidents and ordinary users.
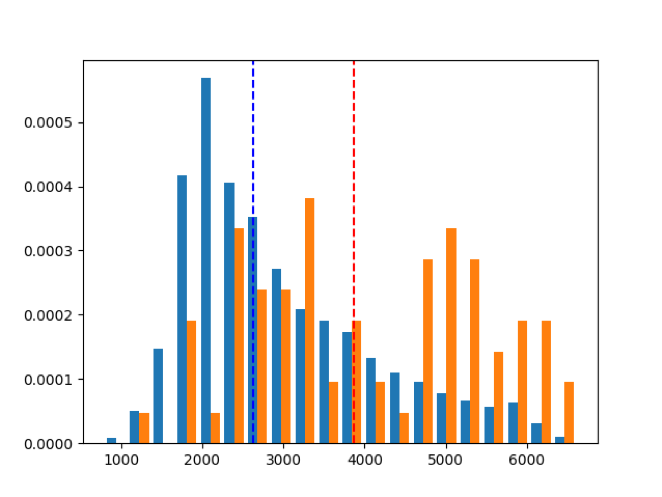
Figure 3. Maximum revolutions at the start of the trip
. Histogram 3 shows the distribution of the maximum engine revolutions, orange - the trips of the users responsible for the accident, the blue - of all users. Dotted lines are medians. One can see a bright shift of the drivers responsible for the accident to the right, i.e. In the first 5 seconds of the trip, these drivers keep their pace higher than the others. 36% of drivers from the same group have revolutions higher than 4800 at the start of the route, and only 9% of all the drivers in question have such revolutions.
Similarly, with maximum acceleration. Histogram 4 depicts the distribution of maximum accelerations. Those responsible for the accident maximum acceleration is higher than the rest.

Figure 4. Maximum acceleration at the start of the trip.
Now let's consider not only the start of the trip, but all five-second intervals from the moment of a full stop and five-second intervals to a full stop. For every 5 seconds of the beginning of the movement we calculate the maximum value of the engine speed and maximum acceleration. Then for each user we find the maximum values.
The largest deviations for the beginning of the movement show the maximum speed, and for stops - the maximum acceleration.

Figure 5. Maximum engine speed at the start of movement
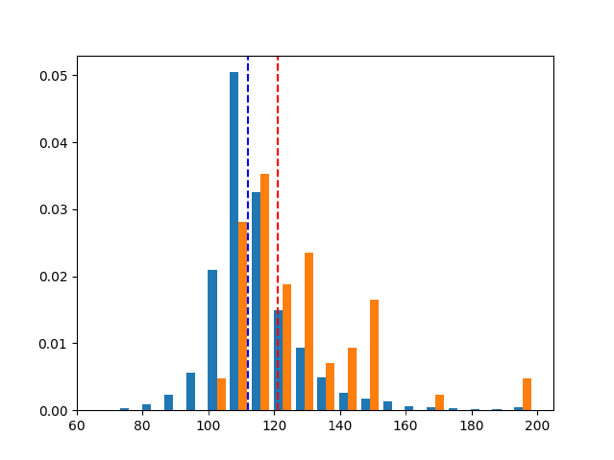
Figure 6. Maximum acceleration at stopping
As a result, it turns out that 80% of drivers guilty of accidents have a turnover of more than 5,000, when only 20% of all drivers have such speed, in other words 80% of drivers of those responsible for accidents belong to 20% of all users. Also, 52% of the drivers of the perpetrators of an accident, have a turnover above 5800, despite the fact that 10% of all users had such speed. With acceleration when stopping a similar situation, although visually the shift is less, 60% of drivers with accidents showed an acceleration of more than 120, when only 20% of all drivers have such accelerations when stopping.
We consider the maximum values due to the strong variation of indicators of aggressive drivers, the deviation of data from one aggressive driver is always higher than that of a quiet driver. In other words, quiet drivers usually drive in the same way, when aggressive drivers can drive, just like calmly and extremely aggressively, it’s hard to say why and what affects it (there can be both mood and haste, etc.).
We considered the starts and stops within the trip and got a good deviation for drivers with an accident relative to the entire mass of drivers. Drivers with an aggressive driving style are most often responsible for road accidents, 80% of the perpetrators of road accidents fall into the group of aggressive in terms of maximum speed at the start of the movement. This group of drivers should pay attention to car sharing operators, since for them, an accident is always a loss.
Other important elements of the trip are turns, I will tell about them in the next article.
Author: Kirill Kulchenkov, kulchenkov32 , business consultant, Bright Box.
For the analysis, we will use data of 250,000 trips of 43,000 car sharing users, of whom 250 were accidents. Teletomatic devices Remoto are installed on the analyzed cars. In the article we will consider two groups of drivers - aggressive and neat. Aggressive drivers are defined as drivers who repeatedly commit violations of the rules of the road.
To begin, let us analyze the average speed of movement and average turnovers of users who did not get into the accident and the perpetrators of the accident.
Figure 1. Average speed
Figure 2. Average engine speed
On histograms 1 and 2, blue and orange indicate the indicators of users without an accident and the perpetrators of an accident, respectively, where the dotted lines are the medians. It is seen that the average users with accidents and without - slightly different. This suggests that most of the route drivers drive the same way.
Next, we selected 10 drivers: 5 with an aggressive driving style and 5 with a calm one. Analysis of the data from the routes of these user groups showed an interesting feature - the first 5 seconds of the trip aggressive users quickly pick up speed and keep the engine running higher. Also, aggressive users slow down with great acceleration when the car is completely stopped (at a traffic light or at the end of a trip). For speed, engine speed and acceleration, we used the following values for the analysis:
- Maximum value;
- Maximum change value;
- Mean statistical deviation;
- Average value;
- Median value.
On our test sample it was clearly visible that the maximum turnovers of aggressive drivers at the beginning of the route are much higher than those of the others, like the maximum acceleration. As a result, we decided to calculate these values for all 250,000 routes, dividing the data into two groups: the perpetrators of road accidents and ordinary users.
Figure 3. Maximum revolutions at the start of the trip
. Histogram 3 shows the distribution of the maximum engine revolutions, orange - the trips of the users responsible for the accident, the blue - of all users. Dotted lines are medians. One can see a bright shift of the drivers responsible for the accident to the right, i.e. In the first 5 seconds of the trip, these drivers keep their pace higher than the others. 36% of drivers from the same group have revolutions higher than 4800 at the start of the route, and only 9% of all the drivers in question have such revolutions.
Similarly, with maximum acceleration. Histogram 4 depicts the distribution of maximum accelerations. Those responsible for the accident maximum acceleration is higher than the rest.
Figure 4. Maximum acceleration at the start of the trip.
Now let's consider not only the start of the trip, but all five-second intervals from the moment of a full stop and five-second intervals to a full stop. For every 5 seconds of the beginning of the movement we calculate the maximum value of the engine speed and maximum acceleration. Then for each user we find the maximum values.
The largest deviations for the beginning of the movement show the maximum speed, and for stops - the maximum acceleration.
Figure 5. Maximum engine speed at the start of movement
Figure 6. Maximum acceleration at stopping
As a result, it turns out that 80% of drivers guilty of accidents have a turnover of more than 5,000, when only 20% of all drivers have such speed, in other words 80% of drivers of those responsible for accidents belong to 20% of all users. Also, 52% of the drivers of the perpetrators of an accident, have a turnover above 5800, despite the fact that 10% of all users had such speed. With acceleration when stopping a similar situation, although visually the shift is less, 60% of drivers with accidents showed an acceleration of more than 120, when only 20% of all drivers have such accelerations when stopping.
We consider the maximum values due to the strong variation of indicators of aggressive drivers, the deviation of data from one aggressive driver is always higher than that of a quiet driver. In other words, quiet drivers usually drive in the same way, when aggressive drivers can drive, just like calmly and extremely aggressively, it’s hard to say why and what affects it (there can be both mood and haste, etc.).
We considered the starts and stops within the trip and got a good deviation for drivers with an accident relative to the entire mass of drivers. Drivers with an aggressive driving style are most often responsible for road accidents, 80% of the perpetrators of road accidents fall into the group of aggressive in terms of maximum speed at the start of the movement. This group of drivers should pay attention to car sharing operators, since for them, an accident is always a loss.
Other important elements of the trip are turns, I will tell about them in the next article.
Author: Kirill Kulchenkov, kulchenkov32 , business consultant, Bright Box.